The SkyWalking official UI provides the default and powerful visualization capabilities for SkyWalking to observe distributed clusters.
Watch the latest introduction video on Youtube:
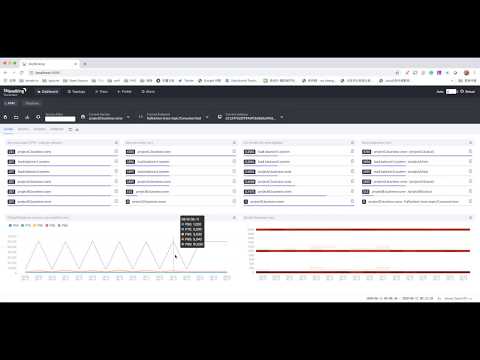
The SkyWalking dashboard includes these parts:
The dashboard provides metrics of services, service instances, and endpoints. Here's a quick terminology guide on metrics:
p99, p95, p90, p75, and p50. See percentile on Wiki.The Service, Instance and Dashboard selectors can be reloaded manually, so it's not necessary to always reload the whole page. Note that the Reload Zone does not reload these selectors.
Two default dashboards are provided to visualize the metrics of service and database.
Click the Lock button on the left of the Service/Instance/Endpoint Reload button to customize your dashboard.
Users may customize their dashboards. The default dashboards are provided in the default templates located in the /ui-initialized-templates folders.
The template file must end with .yml or .yaml. It follows this format:
templates:
  - name: template name # The unique name
    # The type includes DASHBOARD, TOPOLOGY_INSTANCE, TOPOLOGY_ENDPOINT.
    # DASHBOARD type templates could have multiple definitions, by using different names.
    # TOPOLOGY_INSTANCE, TOPOLOGY_ENDPOINT type templates should be defined once,
    # as they are used in the topology page only.
    type: "DASHBOARD"
    # Custom the dashboard or create a new one on the UI, set the metrics as you like in the edit mode.
    # Then, you could export this configuration through the page and add it here.
    configuration: |-
      [
        {
          "name":"Spring Sleuth",
          "type":"service",
          "children":[
            {
              "name":"Sleuth",
              "children": [{
                "width": "3",
                "title": "HTTP Request",
                "height": "200",
                "entityType": "ServiceInstance",
                "independentSelector": false,
                "metricType": "REGULAR_VALUE",
                "metricName": "meter_http_server_requests_count",
                "queryMetricType": "readMetricsValues",
                "chartType": "ChartLine",
                "unit": "Count"
              }
              ...
              ]
            }
          ]
      }
      ]
    # Activated means this templates added into the UI page automatically.
    # False means providing a basic template, user needs to add it manually on the page.
    activated: false
    # True means wouldn't show up on the dashboard. Only keeps the definition in the storage.
    disabled: false
NOTE: UI initialized templates would only be initialized if no template in the storage has the same name. Check the entity named ui_template in your storage.
A topology map shows the relationship between services and instances with metrics.
Global topology is shown by default, which means that all services are included.
<group name>::<logic name> format. Topology maps are available for single group, single service, or global (where all services are included).Since SkyWalking provides distributed agents, trace query is a key feature.
Profile is an interactive feature. It provides method-level performance diagnoses.
To start profile analysis, you need to create a profile task:
Once the profile is done, the profiled trace segments would show up, and you could request to analyze any span. Typically, we analyze spans with long self duration. If a span and its children both have long duration, you could set the analysis boundaries by choosing to Include Children or Exclude Children.
Choose the appropriate span, and click Analyze. You will see the stack-based analysis results. The slowest methods are highlighted.
Since version 8.3.0, SkyWalking has provided log query for browser monitoring. Use Apache SkyWalking Client JS agent to collect metrics and error logs.
Since version 8.5.0, SkyWalking supports collecting logs through its native agents and third party agents (such as Fluentd and Filebeat). See Log Analyzer Document for more details.
The alarm page lists all triggered alarms. See backend setup documentation to learn how to set up alarm rules or integrate with third party systems.