| commit d6b674dd0331571383388d8f401cf53e188a7d5f |
| Author: Nan Xiang <xiangnan@pingcap.com> |
| Date: Fri Jun 9 09:52:05 2023 +0800 |
| |
| update a blog (#26202) |
| |
| * update a blog |
| |
| * Update docs/blog/content/material/2023_06_07_How_to_Run_SQl_Trace_with_ShardingSphere.md |
| |
| * Update 2023_06_07_How_to_Run_SQl_Trace_with_ShardingSphere.md |
| |
| --------- |
| |
| Co-authored-by: 吴伟杰 <wuweijie@apache.org> |
| |
| diff --git a/docs/blog/content/material/2023_06_07_How_to_Run_SQl_Trace_with_ShardingSphere.md b/docs/blog/content/material/2023_06_07_How_to_Run_SQl_Trace_with_ShardingSphere.md |
| new file mode 100644 |
| index 00000000000..35e4ca86455 |
| --- /dev/null |
| +++ b/docs/blog/content/material/2023_06_07_How_to_Run_SQl_Trace_with_ShardingSphere.md |
| @@ -0,0 +1,262 @@ |
| ++++ |
| +title = "How to Run SQL Trace with ShardingSphere-Agent" |
| +weight = 100 |
| +chapter = true |
| ++++ |
| + |
| + |
| + |
| +[Apache ShardingSphere](https://shardingsphere.apache.org/), a data service platform that follows the Database Plus concept for distributed database systems, offers a range of features, including data sharding, read/write splitting, data encryption, and shadow database. In production environment, especially in data-sharding scenarios, SQL tracing is critical for monitoring and analyzing slow queries and abnormal executions. Therefore, a thorough understanding of SQL rewriting and query execution is crucial. |
| + |
| +## What is ShardingSphere-Agent |
| + |
| +[ShardingSphere-Agent](https://shardingsphere.apache.org/document/current/en/reference/observability/) provides an observable framework for ShardingSphere. It is implemented based on Java Agent technology, using Byte Buddy to modify the target bytecode and weave them into data collection logic. Metrics, tracing and logging functions are integrated into the agent through plugins to obtain observable data of system status. Among them, the tracing plugin is used to obtain the tracing information of SQL parsing and SQL execution, which can help users analyze SQL trace when using [Apache ShardingSphere-JDBC](https://shardingsphere.apache.org/document/current/en/user-manual/shardingsphere-jdbc/) or [Apache ShardingSphere-Proxy](https://shardingsphere.apache.org/document/current/en/user-manual/shardingsphere-proxy/). |
| + |
| +This post will take ShardingSphere-Proxy as an example to explain how to use ShardingSphere-Agent for SQL tracing. |
| + |
| +## Two Basic Concepts You Need to Know |
| + |
| +Before starting with the article, here are two important concepts that need to be paid attention to first: |
| + |
| +* Span: the basic unit in a trace. A span is created for each call in the trace and ideentified by a unique ID. Spans can contain some customized information such as descriptive information, timestamps, key-value pairs, etc. |
| + |
| +* Trace: the collection of spans with a tree structure. In ShardingSphere-Proxy, a trace represents to the full execution process of a SQL statement. |
| + |
| +When running a SQL statement in ShardingSphere-Proxy, it goes through parsing, routing, rewriting, execution, and merging. Currently, tracing has been implemented in two critical steps: parsing and execution — with execution oftentimes being the focus. In the execution stage, Proxy will connect to the physical database to execute the actual SQL. Therefore, the information obtained during this stage provides important evidence for troubleshooting issues and fully reflects the correspondence between logical SQL and actual SQL after rewriting. |
| + |
| +In ShardingSphere-Proxy, a trace consists of three types of spans: |
| + |
| +<table> |
| + <tr> |
| + <td>Span |
| + </td> |
| + <td>Description |
| + </td> |
| + </tr> |
| + <tr> |
| + <td><code>/ShardingSphere/rootInvoke/</code> |
| + </td> |
| + <td>This span indicates the complete execution of an SQL statement, and you can view the amount of time spent on executing an SQL |
| + </td> |
| + </tr> |
| + <tr> |
| + <td><code>/ShardingSphere/parseSQL/</code> |
| + </td> |
| + <td>This span indicates the parsing stage of the SQL execution. You can view the parsing time of an SQL and the SQL statements. (It is not available when a <code>PreparedStatement</code> is used.) |
| + </td> |
| + </tr> |
| + <tr> |
| + <td><code>/ShardingSphere/executeSQL/</code> |
| + </td> |
| + <td>This span indicates the rewritten SQL is executed. And the time spent on executing is also available. (This span is not available if the SQL doesn’t need to be executed in the backend physical database). |
| + </td> |
| + </tr> |
| +</table> |
| + |
| +## How to use ShardingSphere-Agent for SQL tracing |
| + |
| +For the convenience of viewing the tracing data, Zipkin or Jaeger is usually used to collect and display the tracing data. Currently, ShardingSphere-Agent supports reporting trace data to both components. Next, let’s use the sharding scenario as an example to explain how to report data and analyze the SQL trace. |
| + |
| +### Configuring ShardingSphere-Proxy |
| + |
| +* Download Proxy from the [official website](https://shardingsphere.apache.org/document/current/en/downloads/) [1] |
| +* Create `demo_ds_0` and `demo_ds_1` under the MySQL database as the storage unit `ds_0` and `ds_1` . |
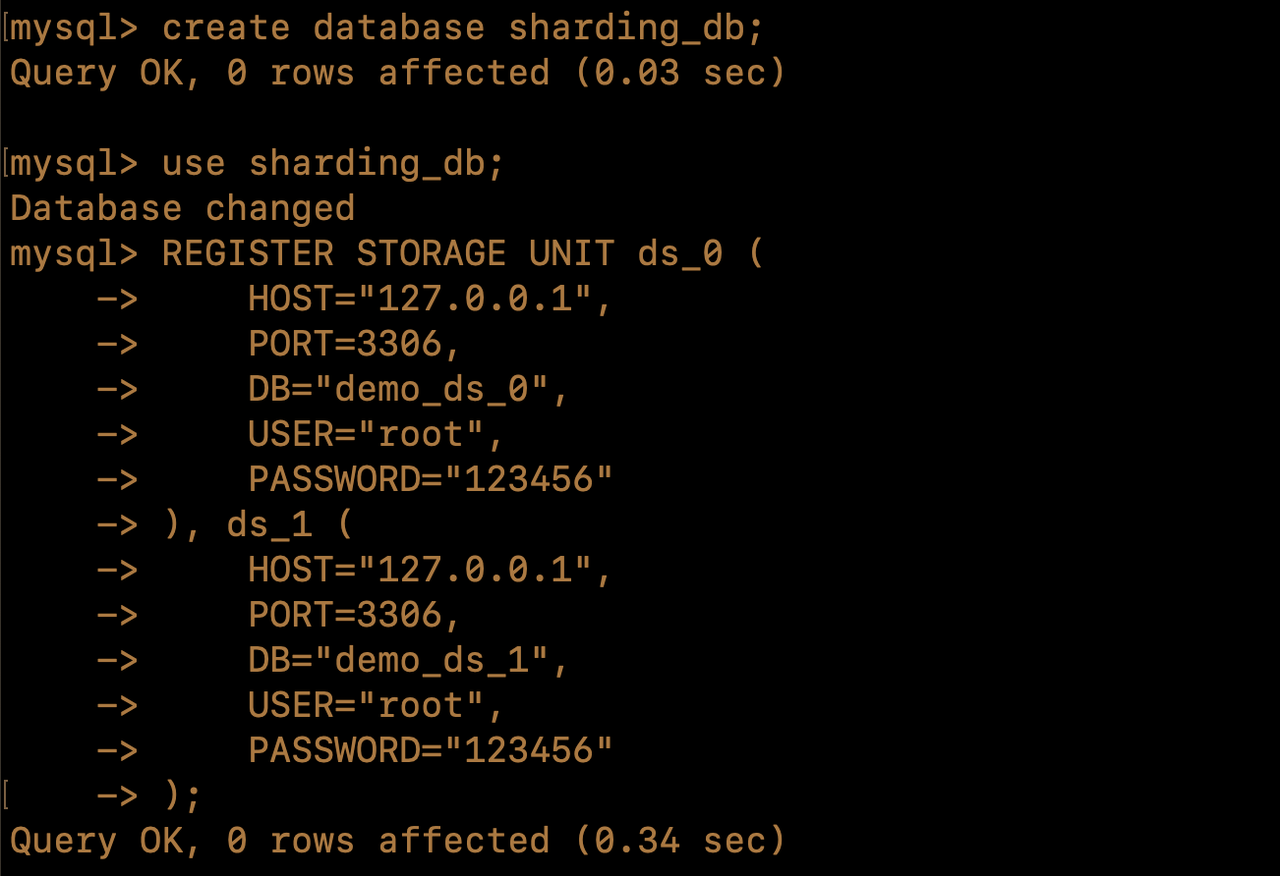
| +* Start Proxy, and connect to Proxy using a MySQL client tool; create logical database `sharding_db`, and register the storage units under this database using DistSQL (Distributed SQL). DistSQL is the specific SQL language for Apache ShardingSphere. It is used in exactly the same way as standard SQL, and is used to provide SQL-level operational capabilities for incremental functions. For details, please refer to the [DistSQL official document](https://shardingsphere.apache.org/document/current/en/user-manual/shardingsphere-proxy/distsql/) [2] |
| + |
| + |
| + |
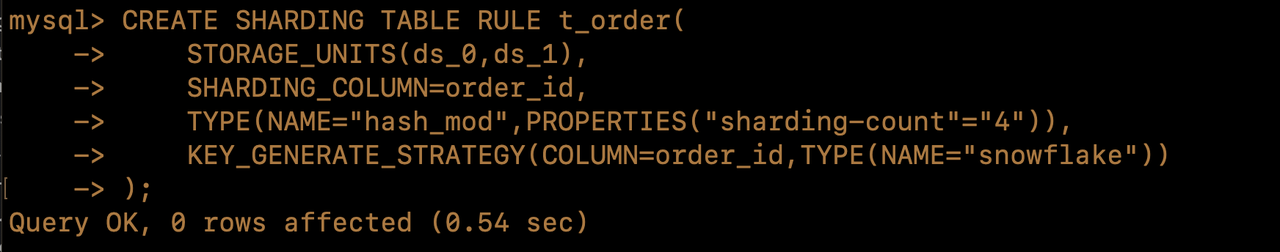
| +* Use DistSQL to create sharding `rule t_order`, set `ds_0` and `ds_1` as storage units, and set the number of shard to 4. |
| + |
| + |
| + |
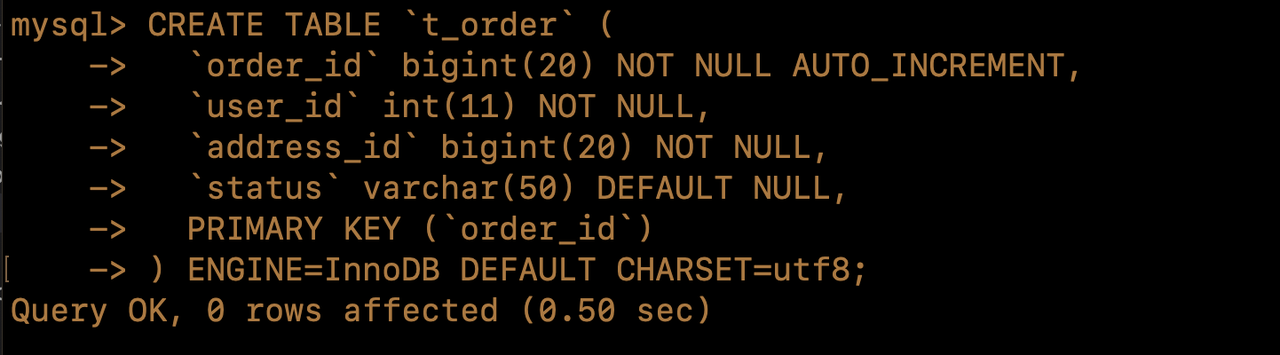
| +* Create table `t_order` |
| + |
| + |
| + |
| + |
| + |
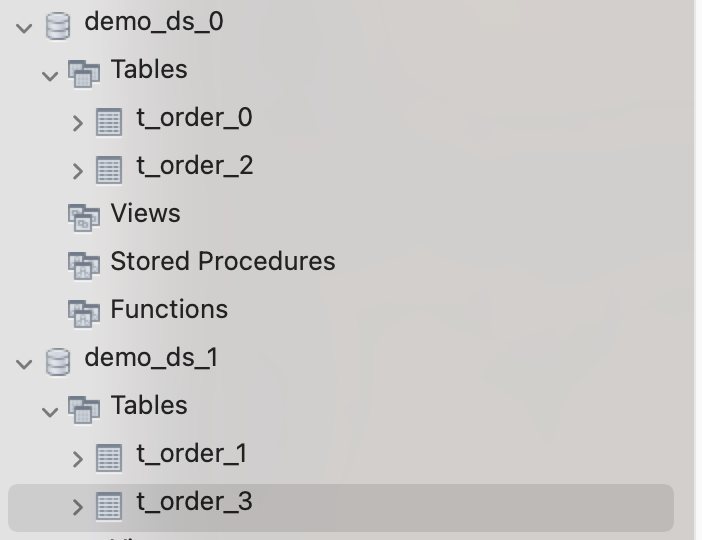
| +Finally, there will be tables `t_order_0` and `t_order_2` created in the physical database `demo_ds_0`, and `t_order_1` and `t_order_3` tables in the physical database `demo_ds_1`. |
| + |
| +After ShardingSphere-Proxy is well configured, the next step is to introduce how to report SQL trace data to Zipkin and Jaeger through ShardingSphere-Agent. |
| + |
| +### Reporting to Zipkin |
| + |
| +* Deploy Zipkin (please refer to the [official website](https://zipkin.io/pages/quickstart.html) [3]) |
| +* Configure `agent.yaml` to export data to Zipkin |
| + |
| +``` |
| +plugins: |
| + tracing: |
| + OpenTelemetry: |
| + props: |
| + otel.service.name: "shardingsphere" # the service name configured |
| + otel.traces.exporter: "zipkin" # Use zipkin exporter |
| + otel.exporter.zipkin.endpoint: "http://localhost:9411/api/v2/spans" # the address where zipkin receives data |
| + otel-traces-sampler: "always_on" # sampling setting |
| + otel.metrics.exporter: "none" # close OpenTelemetry metric collection |
| + |
| +``` |
| + |
| +* Restart Proxy and Agent after stopping Proxy (`--agent`means enabling Agent) |
| + |
| +``` |
| +./bin/stop.sh |
| + |
| +./bin/start.sh --agent |
| + |
| +``` |
| + |
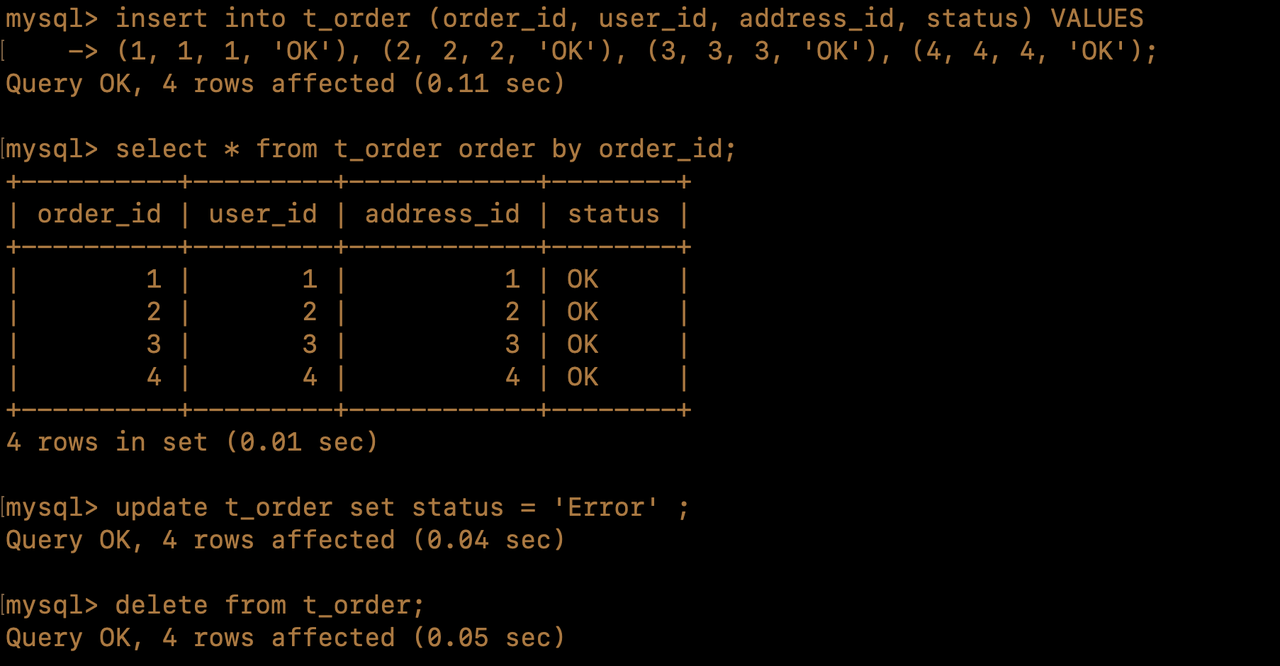
| +* Use a MySQL client tool to connect to the Proxy and execute the following queries — `insert`, `select`, `update`, and `delete` in sequence. |
| + |
| + |
| + |
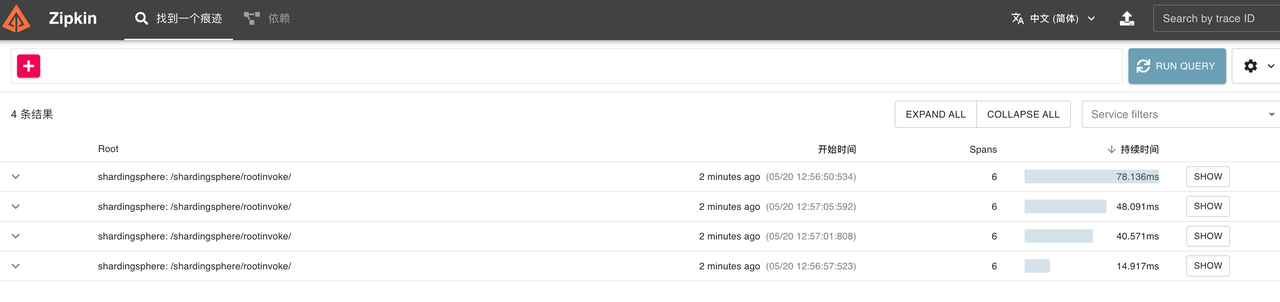
| +* Visit [http://127.0.0.1:9411/zipkin/](http://127.0.0.1:9411/zipkin/) (Zipkin UI), and you can see 4 pieces of trace data, which is exactly the same number of SQL queries. |
| + |
| + |
| + |
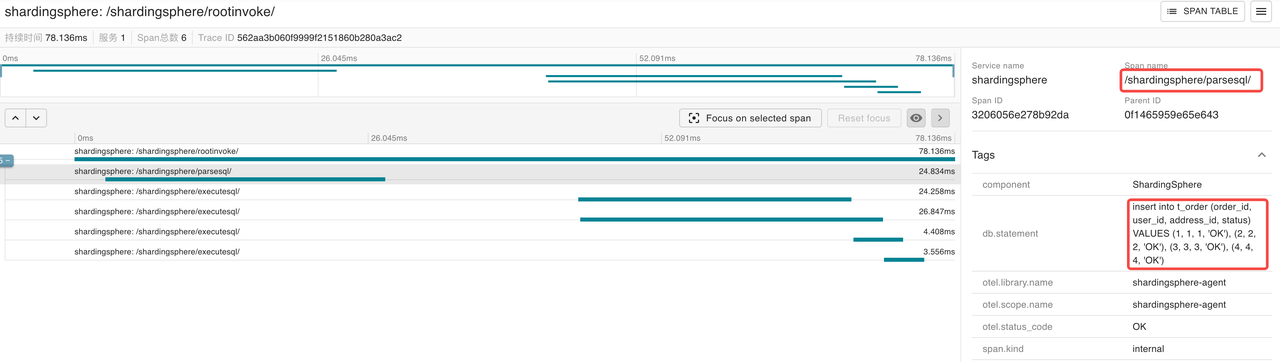
| +Let’s analyze the trace of the insert query. After finding the trace, you can see the execution details of this query. The Tags information in the `/shardingsphere/parsesql/` span shows that the parsed SQL is consistent with the SQL executed on the client. |
| + |
| + |
| + |
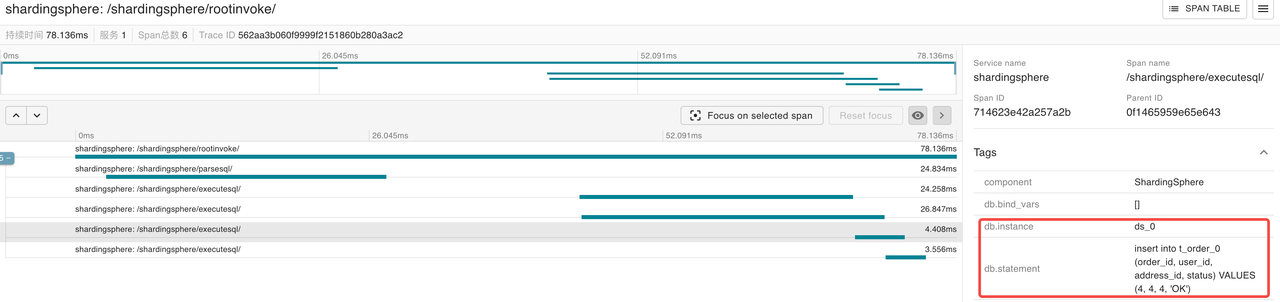
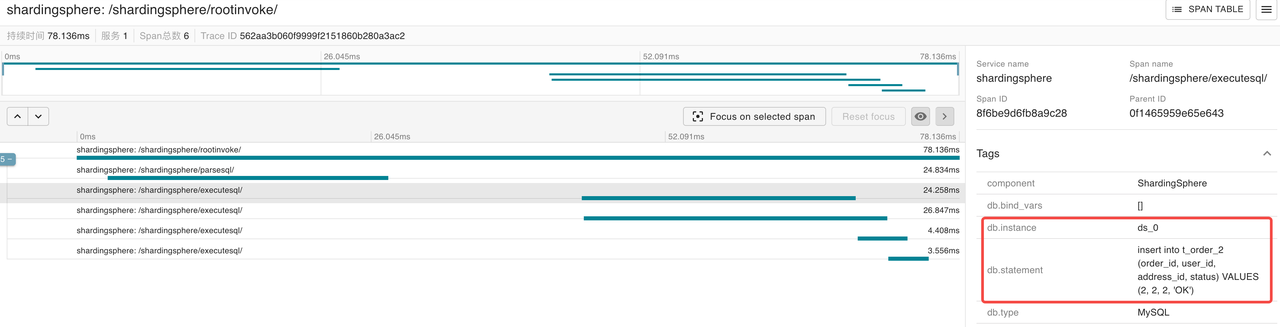
| +There are 4 `/shardingsphere/executesql/` spans shown in the span table. After reviewing the details, it is found that the following two SQL statements were executed in the storage unit `ds_0`: |
| + |
| +``` |
| +insert into t_order_0 (order_id, user_id, address_id, status) VALUES (4, 4, 4, 'OK') |
| +insert into t_order_2 (order_id, user_id, address_id, status) VALUES (2, 2, 2, 'OK') |
| +``` |
| + |
| + |
| + |
| + |
| + |
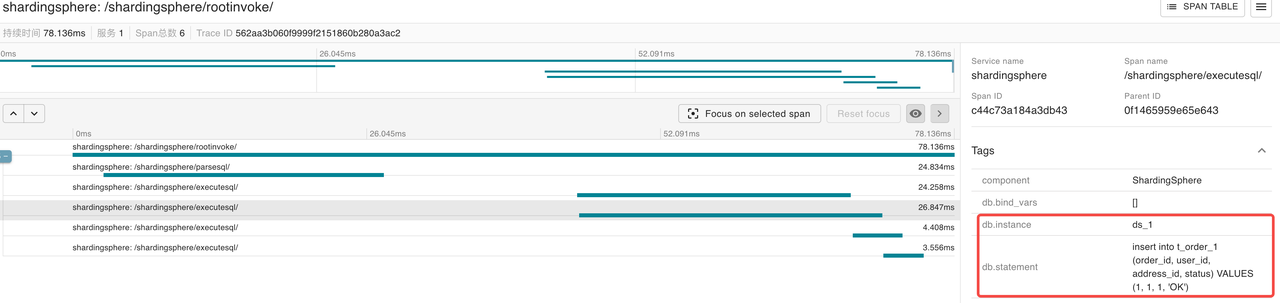
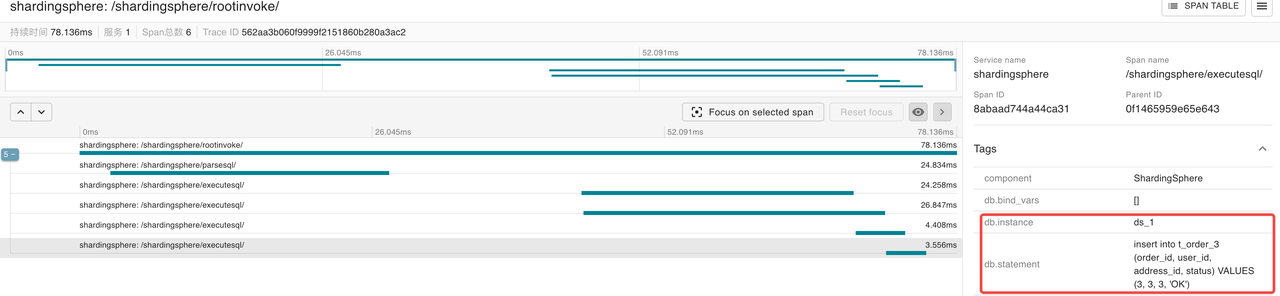
| +The following two SQL statements are executed in the storage unit `ds_1` |
| + |
| +``` |
| +insert into t_order_1 (order_id, user_id, address_id, status) VALUES (1, 1, 1, 'OK') |
| +insert into t_order_3 (order_id, user_id, address_id, status) VALUES (3, 3, 3, 'OK') |
| +``` |
| + |
| + |
| + |
| + |
| + |
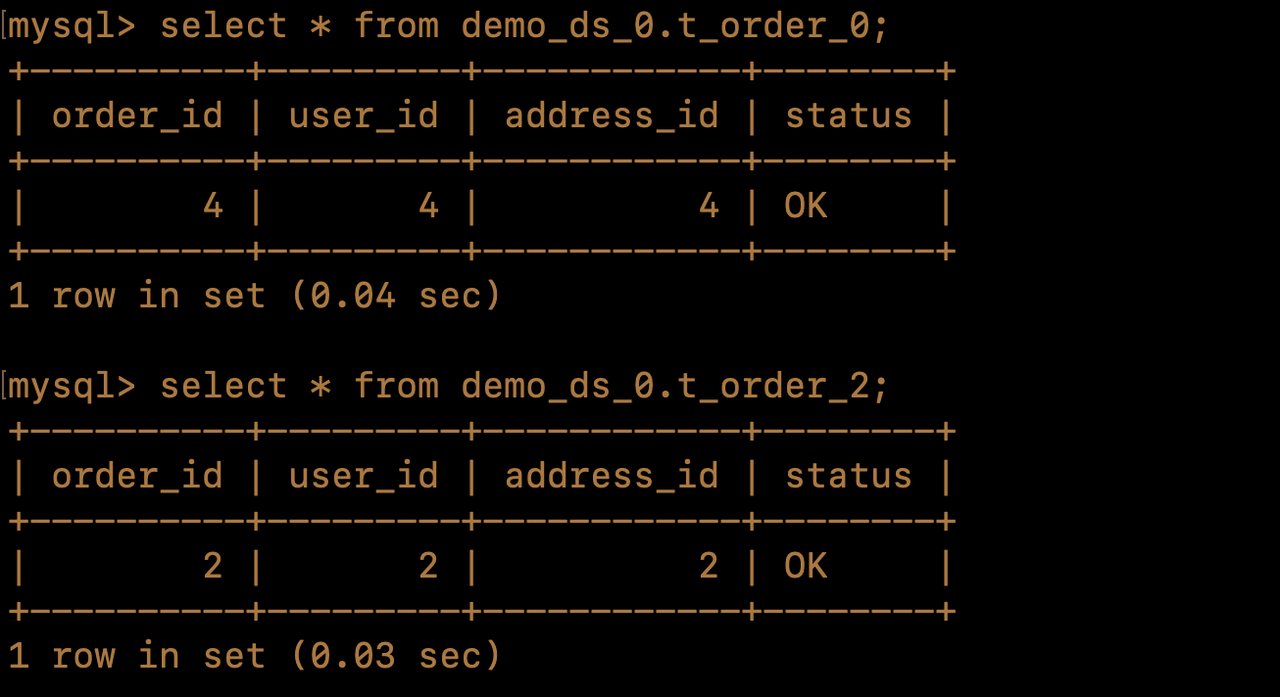
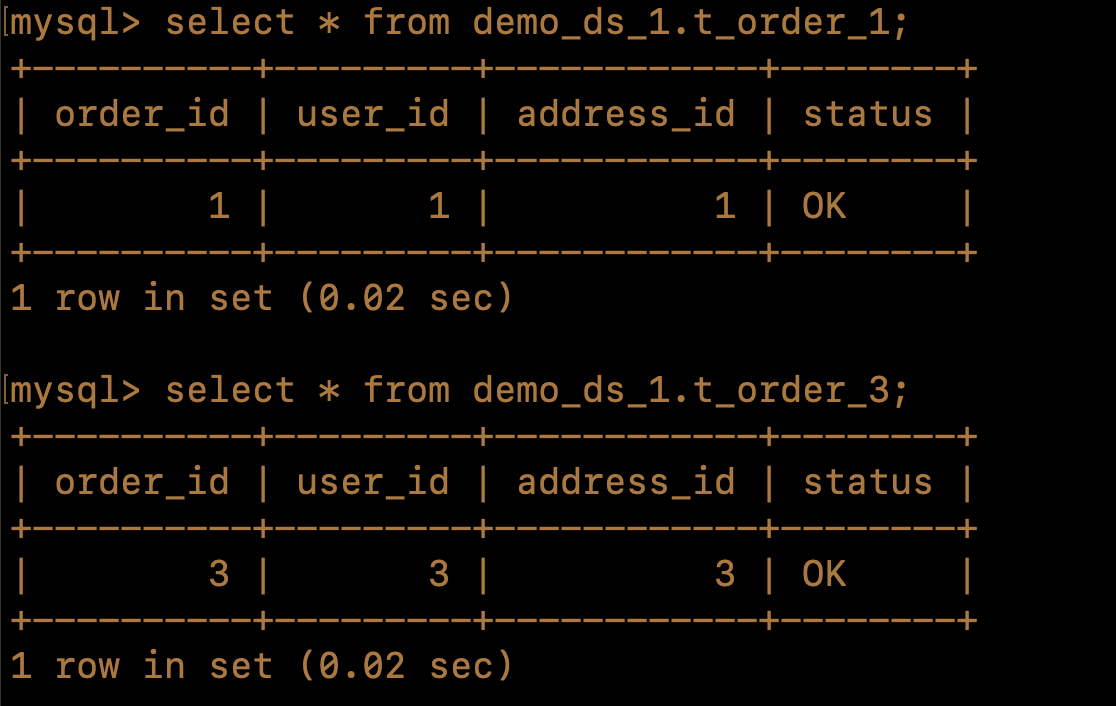
| +Then log in to the physical database to check the corresponding data (after executing the insert query) |
| + |
| + |
| + |
| + |
| + |
| +Due to the `t_orde`r table being partitioned into 4 shards and data with `order_id` 1 to 4 being inserted, one record will be inserted into each of the `t_order_0`, `t_order_1`, `t_order_2`, and `t_order_3` tables. As a result, there will be 4 `/shardingsphere/executesql` spans. The displayed SQL trace is consistent with the actual execution results. So you can view the time spent on each step through the span and also know the specific execution of the SQL through the `/shardingsphere/executesql/` span. |
| + |
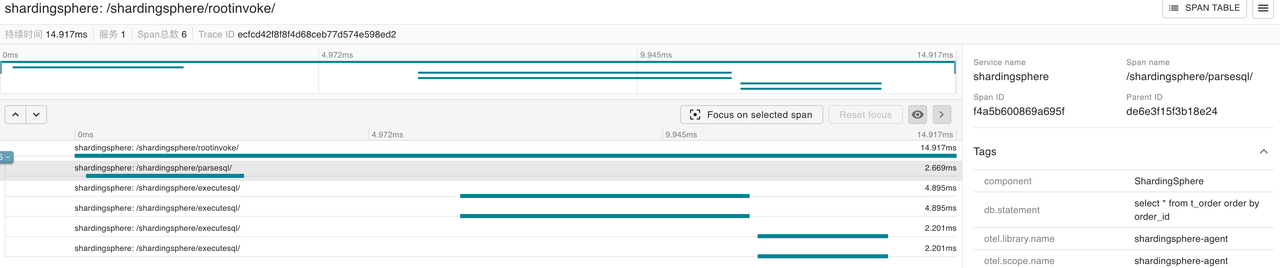
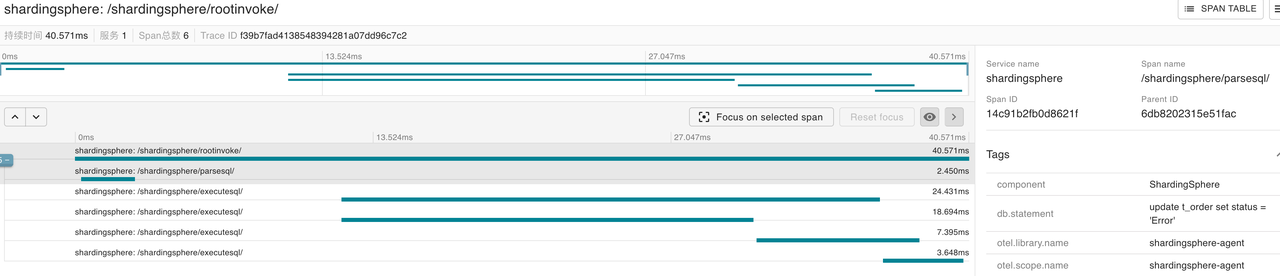
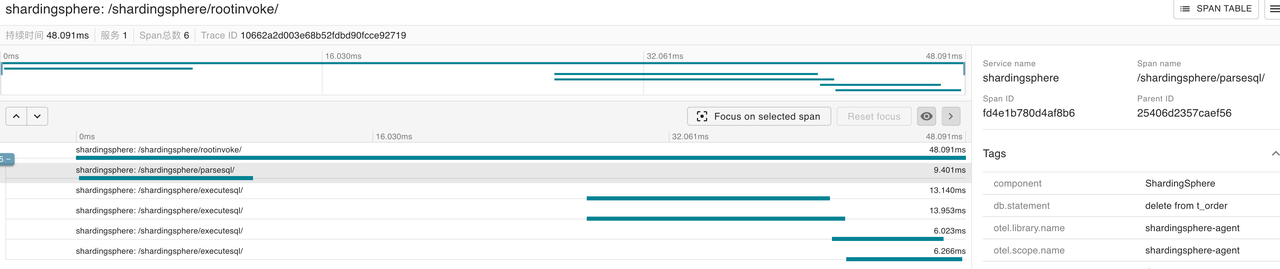
| +The following is the trace details of the select, update, and delete queries, which are also consistent with the actual situation. |
| + |
| + |
| + |
| + |
| + |
| + |
| + |
| +### Reporting to Jaeger |
| + |
| +* Deploy Jaeger (please refer to the [official website](https://www.jaegertracing.io/) [4]) |
| +* Deploy Proxy |
| +* Configure `agent.yaml` |
| + |
| +``` |
| +plugins: |
| + tracing: |
| + OpenTelemetry: |
| + props: |
| + otel.service.name: "shardingsphere" # the service name configured |
| + otel.traces.exporter: "jaeger" # Use jaeger exporter |
| + otel.exporter.otlp.traces.endpoint: "http://localhost:14250" # the address where jaeger receives data |
| + otel.traces.sampler: "always_on" # sampling setting |
| + otel.metrics.exporter: "none" # close OpenTelemetry metric collection |
| + |
| +``` |
| + |
| +* Restart Proxy and Agent after stopping Proxy (`--agent` means enabling Agent) |
| + |
| +``` |
| +./bin/stop.sh |
| + |
| +./bin/start.sh --agent |
| + |
| +``` |
| + |
| +* Log into Proxy and execute SQL queries under the `sharding_db` database (this SQL query is same as the ones executed in the Zipkin example) |
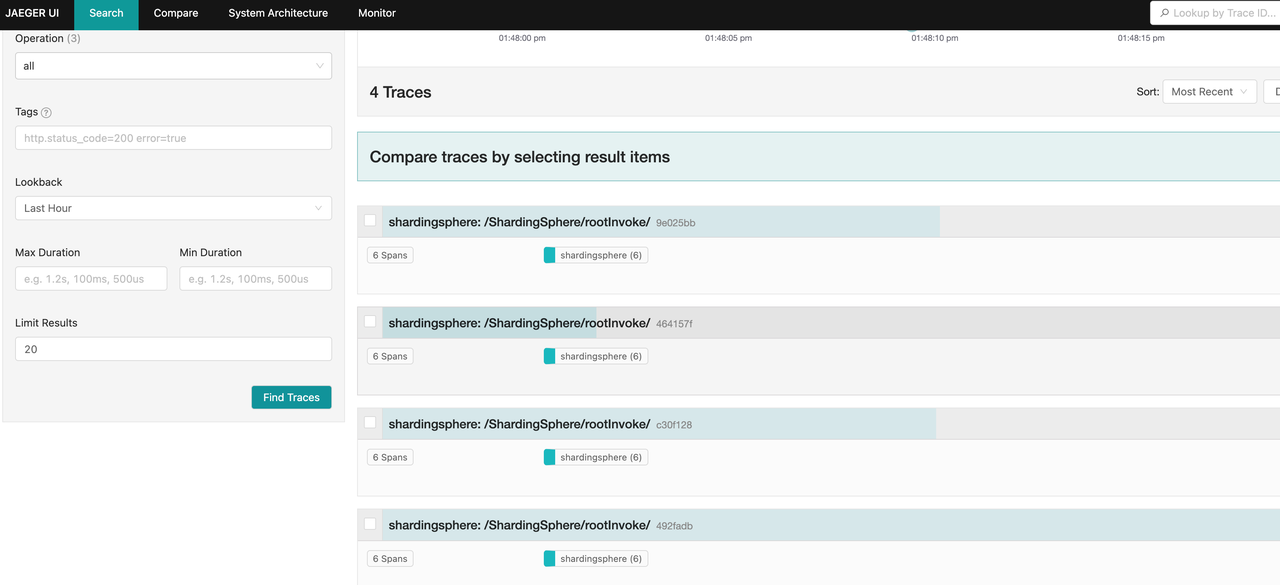
| +* From [http://127.0.0.1:16686/](http://127.0.0.1:16686/) (Jaeger UI address), you will see 4 trace data, same as the number of executed SQL queries. |
| + |
| + |
| + |
| +Since the executed SQL queries are the same as those in the Zipkin example, the trace data should also be the same. As an example, we will use the trace from the insert query. |
| + |
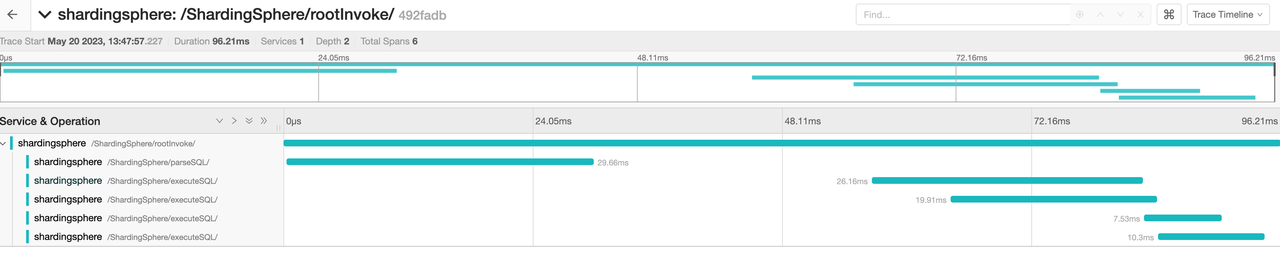
| +From the following picture, their are one parsed span and 4 executed span |
| + |
| + |
| + |
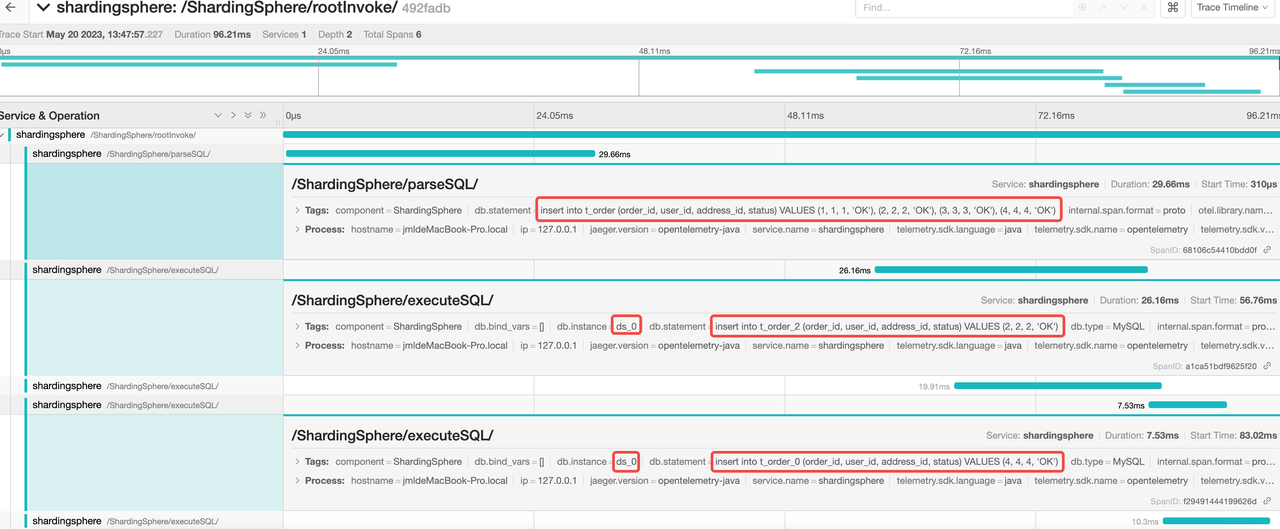
| +Storage unit `ds_0` has executed the following two SQL statements |
| + |
| +``` |
| +insert into t_order_0 (order_id, user_id, address_id, status) VALUES (4, 4, 4, 'OK') |
| +insert into t_order_2 (order_id, user_id, address_id, status) VALUES (2, 2, 2, 'OK') |
| +``` |
| + |
| + |
| + |
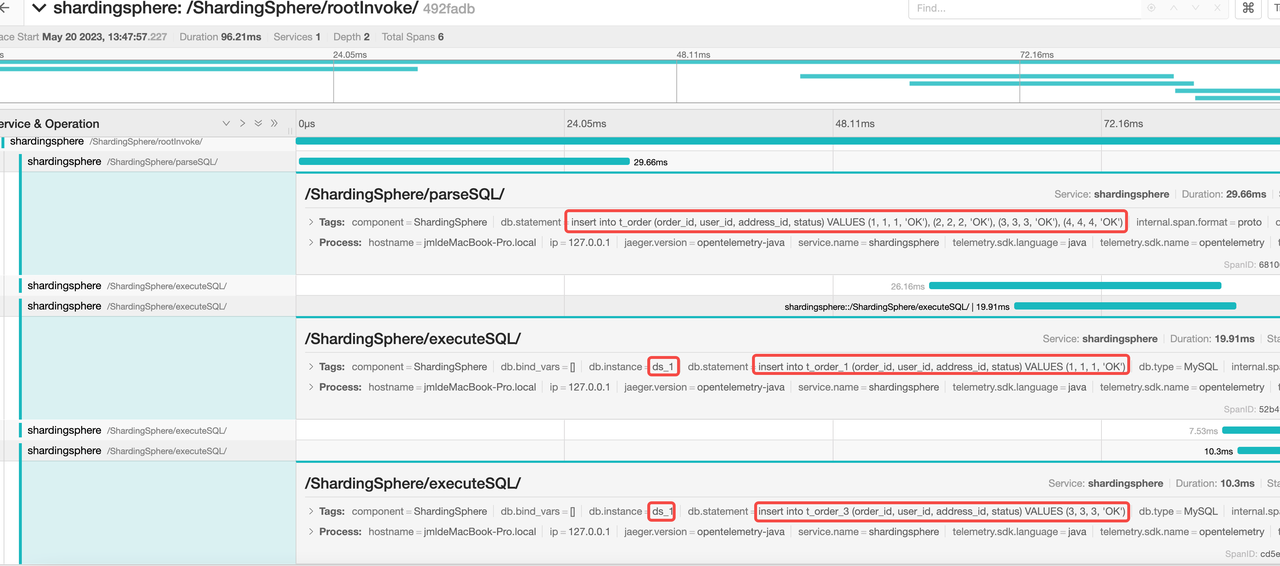
| +Storage unit `ds_1` has executed the following two SQL statements |
| + |
| +``` |
| +insert into t_order_1 (order_id, user_id, address_id, status) VALUES (1, 1, 1, 'OK') |
| +insert into t_order_3 (order_id, user_id, address_id, status) VALUES (3, 3, 3, 'OK') |
| +``` |
| + |
| + |
| + |
| +By analyzing the span number, the parsing result of SQL statement and the execution process, it is concluded that the whole SQL link is in line with the expectation |
| + |
| +## Use Sampling Rate |
| + |
| +Sampling is very common when the amount of trace data in the production environment is very large. Shown as follows, set the sampling rate to 0.01 (sampling rate of 1%). OpenTelemetry Exporters is used for exporting data here, and please refer to the [OpenTelemetry Exporters document](https://github.com/open-telemetry/opentelemetry-java/tree/main/sdk-extensions/autoconfigure) for detailed parameters. [5] |
| + |
| +``` |
| +plugins: |
| + tracing: |
| + OpenTelemetry: |
| + props: |
| + otel.service.name: "shardingsphere" |
| + otel.metrics.exporter: "none" |
| + otel.traces.exporter: "zipkin" |
| + otel.exporter.zipkin.endpoint: "http://localhost:9411/api/v2/spans" |
| + otel-traces-sampler: "traceidratio" |
| + otel.traces.sampler.arg: "0.01" |
| +``` |
| + |
| +## Summary |
| + |
| +SQL Tracking allows developers and DBAs to quickly diagnose and locate performance bottlenecks in applications. By collecting SQL tracing data through ShardingSphere-Agent and using visualization tools such as Zipkin and Jaeger, the time-consuming situation of each storage node can be analyzed, which helps to improve the stability and robustness of the application, and ultimately enhances the user experience. |
| + |
| +Finally, you’re welcome to join [ShardingSphere slack channel](https://app.slack.com/huddle/T026JKU2DPF/C027BBHUJ80)[6] to discuss your questions, suggestions or ideas about ShardingSphere and ShardingSphere-Agent. |
| + |
| +## Useful Links |
| + |
| +[1][ Download ShardingSphere-Proxy](https://shardingsphere.apache.org/document/current/en/downloads/) |
| + |
| +[2][ DistSQL document](https://shardingsphere.apache.org/document/current/cn/user-manual/shardingsphere-proxy/distsql/) |
| + |
| +[3][ Zipkin official](https://zipkin.io/pages/quickstart.html) |
| + |
| +[4][ Jaeger official](https://www.jaegertracing.io) |
| + |
| +[5][ OpenTelemetry Exporters document](https://github.com/open-telemetry/opentelemetry-java/tree/main/sdk-extensions/autoconfigure) |
| + |
| +[6][ ShardingSphere slack channel](https://app.slack.com/huddle/T026JKU2DPF/C027BBHUJ80) |
| + |
| + |
| + |
| + |
| + |
| + |
| + |
| + |
| + |
| diff --git a/docs/blog/static/img/2023_06_07_how_to_run_sql_trace_with_shardingsphere1.jpeg b/docs/blog/static/img/2023_06_07_how_to_run_sql_trace_with_shardingsphere1.jpeg |
| new file mode 100644 |
| index 00000000000..414b1a46385 |
| Binary files /dev/null and b/docs/blog/static/img/2023_06_07_how_to_run_sql_trace_with_shardingsphere1.jpeg differ |
| diff --git a/docs/blog/static/img/2023_06_07_how_to_run_sql_trace_with_shardingsphere2.png b/docs/blog/static/img/2023_06_07_how_to_run_sql_trace_with_shardingsphere2.png |
| new file mode 100644 |
| index 00000000000..705d03704a3 |
| Binary files /dev/null and b/docs/blog/static/img/2023_06_07_how_to_run_sql_trace_with_shardingsphere2.png differ |
| diff --git a/docs/blog/static/img/2023_06_07_how_to_run_sql_trace_with_shardingsphere3.png b/docs/blog/static/img/2023_06_07_how_to_run_sql_trace_with_shardingsphere3.png |
| new file mode 100644 |
| index 00000000000..bd98237bf00 |
| Binary files /dev/null and b/docs/blog/static/img/2023_06_07_how_to_run_sql_trace_with_shardingsphere3.png differ |
| diff --git a/docs/blog/static/img/2023_06_07_how_to_run_sql_trace_with_shardingsphere4.png b/docs/blog/static/img/2023_06_07_how_to_run_sql_trace_with_shardingsphere4.png |
| new file mode 100644 |
| index 00000000000..0d0626ccd22 |
| Binary files /dev/null and b/docs/blog/static/img/2023_06_07_how_to_run_sql_trace_with_shardingsphere4.png differ |
| diff --git a/docs/blog/static/img/2023_06_07_how_to_run_sql_trace_with_shardingsphere5.png b/docs/blog/static/img/2023_06_07_how_to_run_sql_trace_with_shardingsphere5.png |
| new file mode 100644 |
| index 00000000000..e13dfbe09c9 |
| Binary files /dev/null and b/docs/blog/static/img/2023_06_07_how_to_run_sql_trace_with_shardingsphere5.png differ |
| diff --git a/docs/blog/static/img/2023_06_07_how_to_run_sql_trace_with_shardingsphere6.png b/docs/blog/static/img/2023_06_07_how_to_run_sql_trace_with_shardingsphere6.png |
| new file mode 100644 |
| index 00000000000..ad938bbfd70 |
| Binary files /dev/null and b/docs/blog/static/img/2023_06_07_how_to_run_sql_trace_with_shardingsphere6.png differ |
| diff --git a/docs/blog/static/img/trace10.png b/docs/blog/static/img/trace10.png |
| new file mode 100644 |
| index 00000000000..db8256ccd64 |
| Binary files /dev/null and b/docs/blog/static/img/trace10.png differ |
| diff --git a/docs/blog/static/img/trace11.png b/docs/blog/static/img/trace11.png |
| new file mode 100644 |
| index 00000000000..17c6c1b8810 |
| Binary files /dev/null and b/docs/blog/static/img/trace11.png differ |
| diff --git a/docs/blog/static/img/trace12.png b/docs/blog/static/img/trace12.png |
| new file mode 100644 |
| index 00000000000..49ce1395b7c |
| Binary files /dev/null and b/docs/blog/static/img/trace12.png differ |
| diff --git a/docs/blog/static/img/trace13.png b/docs/blog/static/img/trace13.png |
| new file mode 100644 |
| index 00000000000..64d8032b48a |
| Binary files /dev/null and b/docs/blog/static/img/trace13.png differ |
| diff --git a/docs/blog/static/img/trace14.png b/docs/blog/static/img/trace14.png |
| new file mode 100644 |
| index 00000000000..7e1bb6f3444 |
| Binary files /dev/null and b/docs/blog/static/img/trace14.png differ |
| diff --git a/docs/blog/static/img/trace15.png b/docs/blog/static/img/trace15.png |
| new file mode 100644 |
| index 00000000000..76c7f021621 |
| Binary files /dev/null and b/docs/blog/static/img/trace15.png differ |
| diff --git a/docs/blog/static/img/trace16.png b/docs/blog/static/img/trace16.png |
| new file mode 100644 |
| index 00000000000..0b97cf6f65e |
| Binary files /dev/null and b/docs/blog/static/img/trace16.png differ |
| diff --git a/docs/blog/static/img/trace17.png b/docs/blog/static/img/trace17.png |
| new file mode 100644 |
| index 00000000000..a2c54c50bc8 |
| Binary files /dev/null and b/docs/blog/static/img/trace17.png differ |
| diff --git a/docs/blog/static/img/trace18.png b/docs/blog/static/img/trace18.png |
| new file mode 100644 |
| index 00000000000..89061af01e3 |
| Binary files /dev/null and b/docs/blog/static/img/trace18.png differ |
| diff --git a/docs/blog/static/img/trace19.png b/docs/blog/static/img/trace19.png |
| new file mode 100644 |
| index 00000000000..9b45f8bca18 |
| Binary files /dev/null and b/docs/blog/static/img/trace19.png differ |
| diff --git a/docs/blog/static/img/trace20.png b/docs/blog/static/img/trace20.png |
| new file mode 100644 |
| index 00000000000..9a12f88bbb6 |
| Binary files /dev/null and b/docs/blog/static/img/trace20.png differ |
| diff --git a/docs/blog/static/img/trace21.png b/docs/blog/static/img/trace21.png |
| new file mode 100644 |
| index 00000000000..bc8769129cb |
| Binary files /dev/null and b/docs/blog/static/img/trace21.png differ |
| diff --git a/docs/blog/static/img/trace7.png b/docs/blog/static/img/trace7.png |
| new file mode 100644 |
| index 00000000000..9600d3be7e3 |
| Binary files /dev/null and b/docs/blog/static/img/trace7.png differ |
| diff --git a/docs/blog/static/img/trace8.png b/docs/blog/static/img/trace8.png |
| new file mode 100644 |
| index 00000000000..aaa8a743d16 |
| Binary files /dev/null and b/docs/blog/static/img/trace8.png differ |
| diff --git a/docs/blog/static/img/trace9.png b/docs/blog/static/img/trace9.png |
| new file mode 100644 |
| index 00000000000..cbdb8642b53 |
| Binary files /dev/null and b/docs/blog/static/img/trace9.png differ |