| --- |
| { |
| "title": "Quick Start", |
| "sidebar_label": "Quick Start", |
| "language": "en-US", |
| "description": "How to quickly try out the DOG Stack observability solution? This article walks through one-click deployment with Docker Compose and a complete tour of the Doris App plugin, log search, trace analysis, dashboards, and alerting.", |
| "keywords": [ |
| "DOG Stack quick start", |
| "Docker Compose", |
| "Doris App plugin", |
| "Grafana", |
| "OpenTelemetry", |
| "log search", |
| "trace analysis", |
| "dashboard", |
| "alerting" |
| ] |
| } |
| --- |
| |
| <!-- Knowledge type: operational steps --> |
| <!-- Applicable scenario: observability quick validation / DOG Stack onboarding --> |
| |
| The easiest way to experience DOG Stack is to visit the [online demo](https://observability-demo.velodb.io/) — no deployment required. If you want to run your own instance, getting started with Docker Compose is just as easy. |
| |
| |
| |
| ## Deployment |
| |
| ```Bash |
| git clone https://github.com/ai-observe/ai-observe-stack.git |
| cd ai-observe/demo |
| docker compose up -d |
| ``` |
| |
| This launches a complete DOG Stack along with a demo e-commerce application made up of 10+ microservices. |
| |
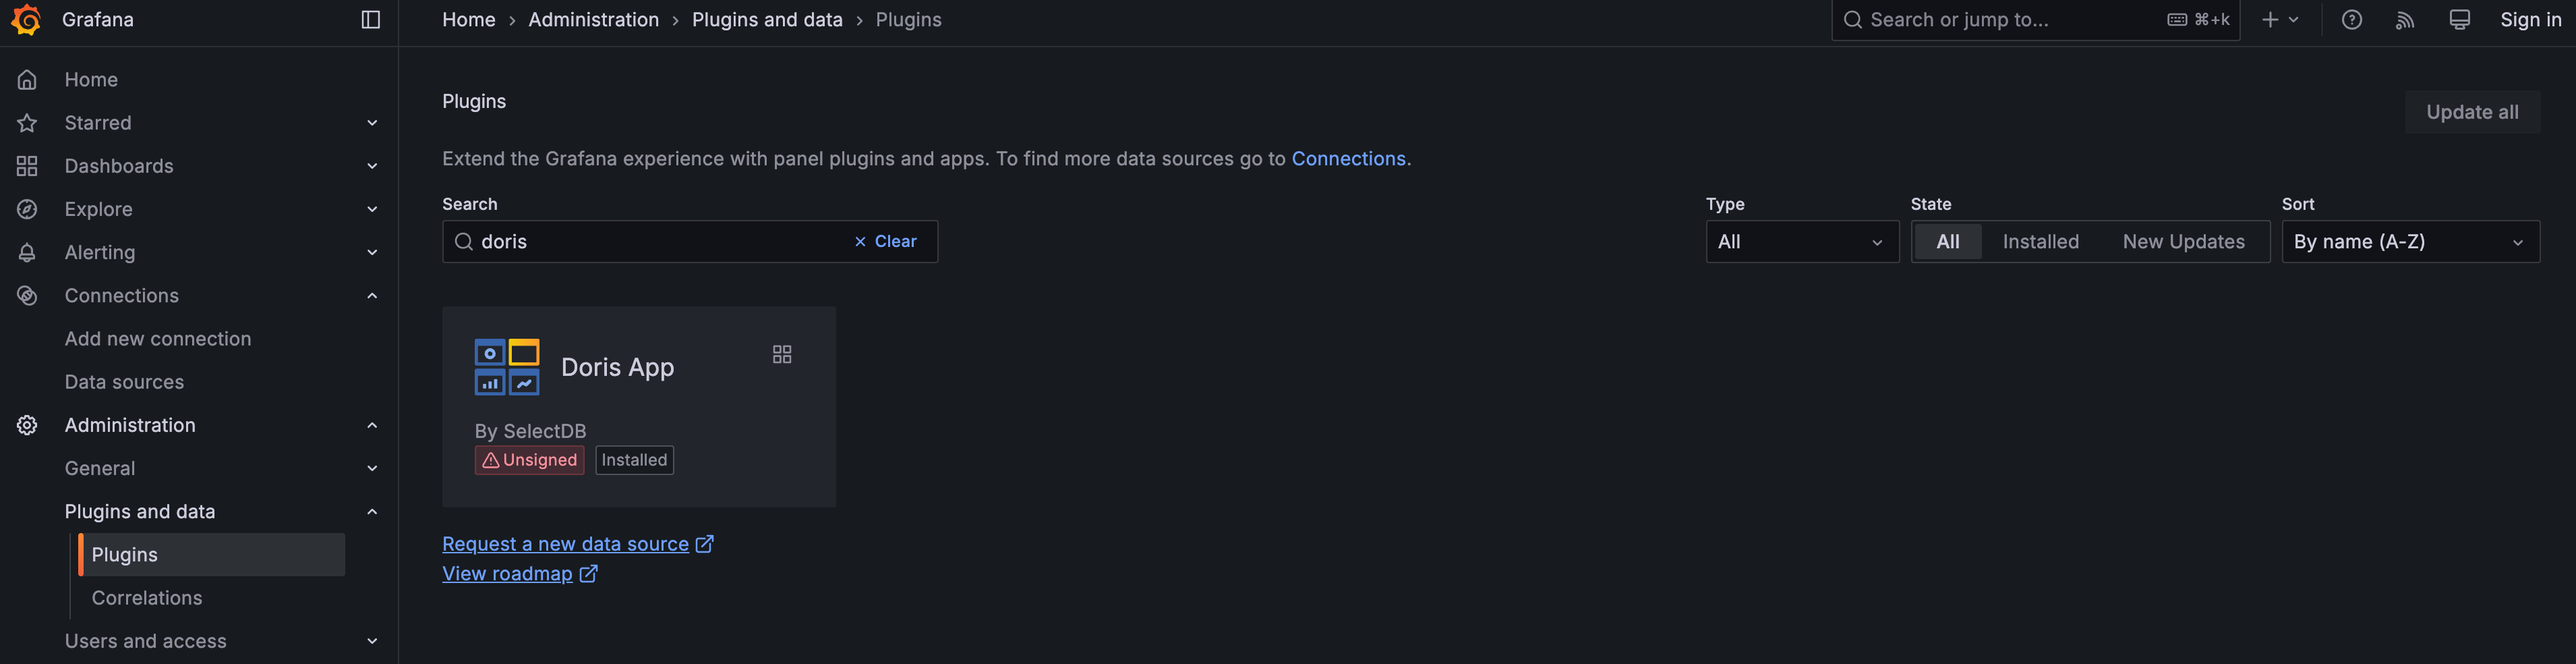
| Open your web browser, navigate to http://localhost:33000/grafana/plugins, search for `doris`, and click the **Doris App** entry. |
| |
|  |
| |
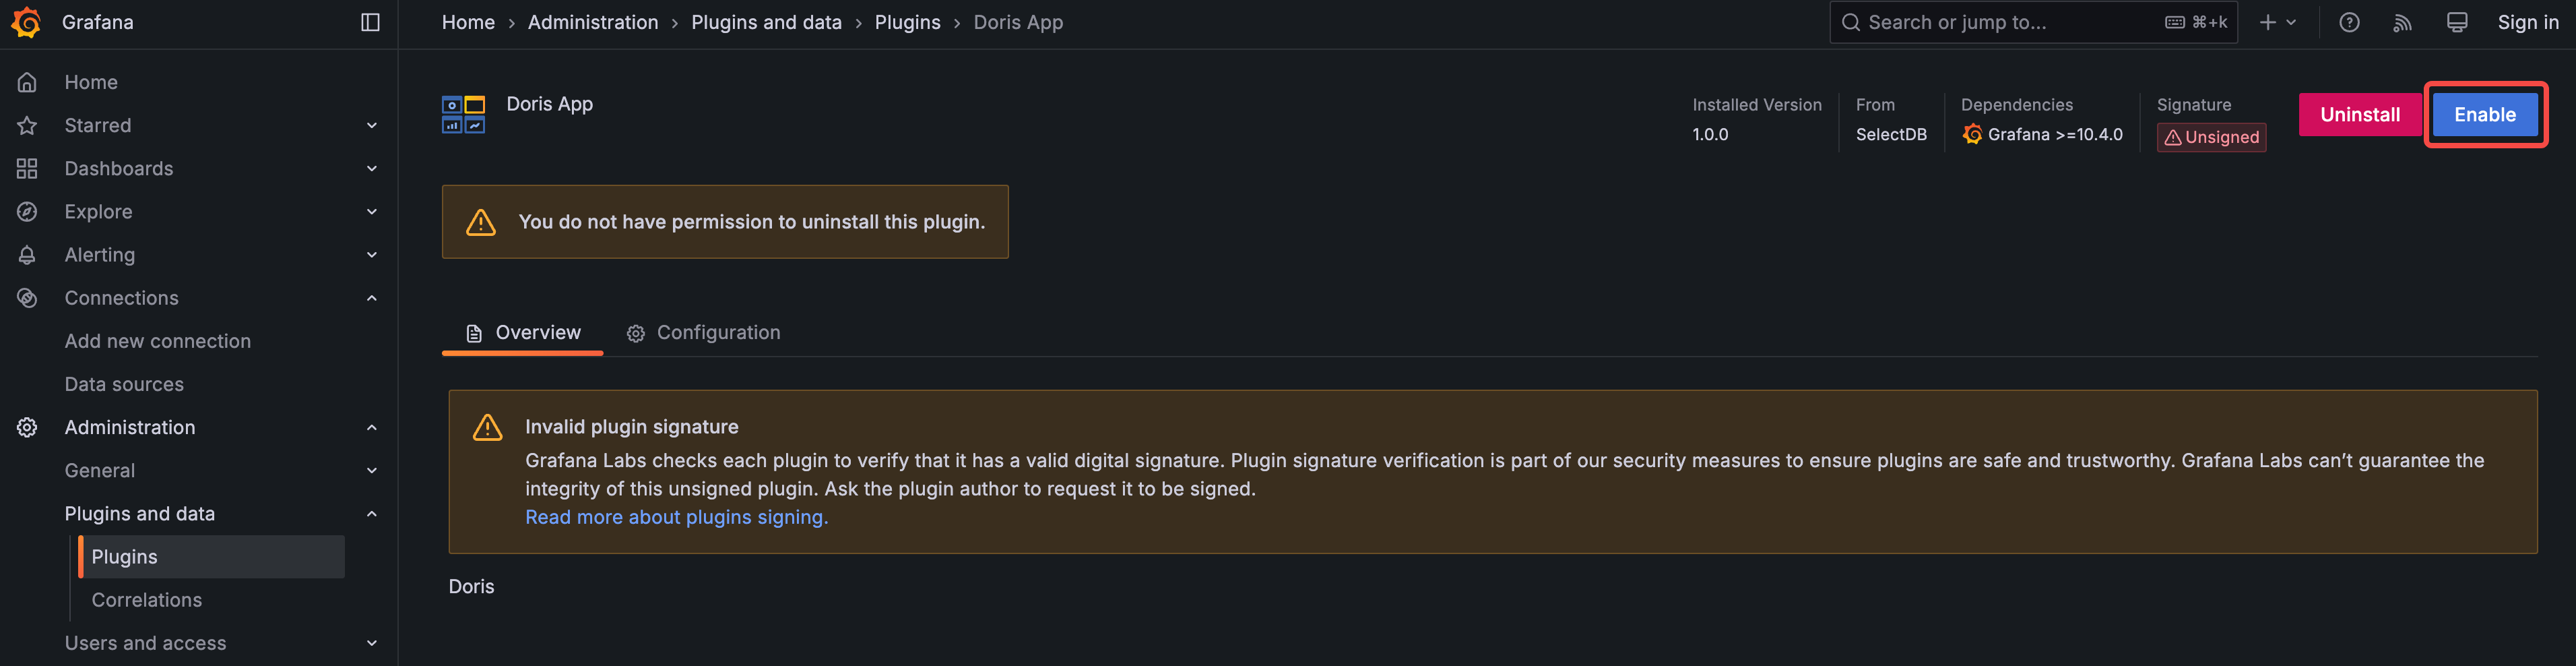
| Then click the **Enable** button to enable the Doris App. |
| |
|  |
| |
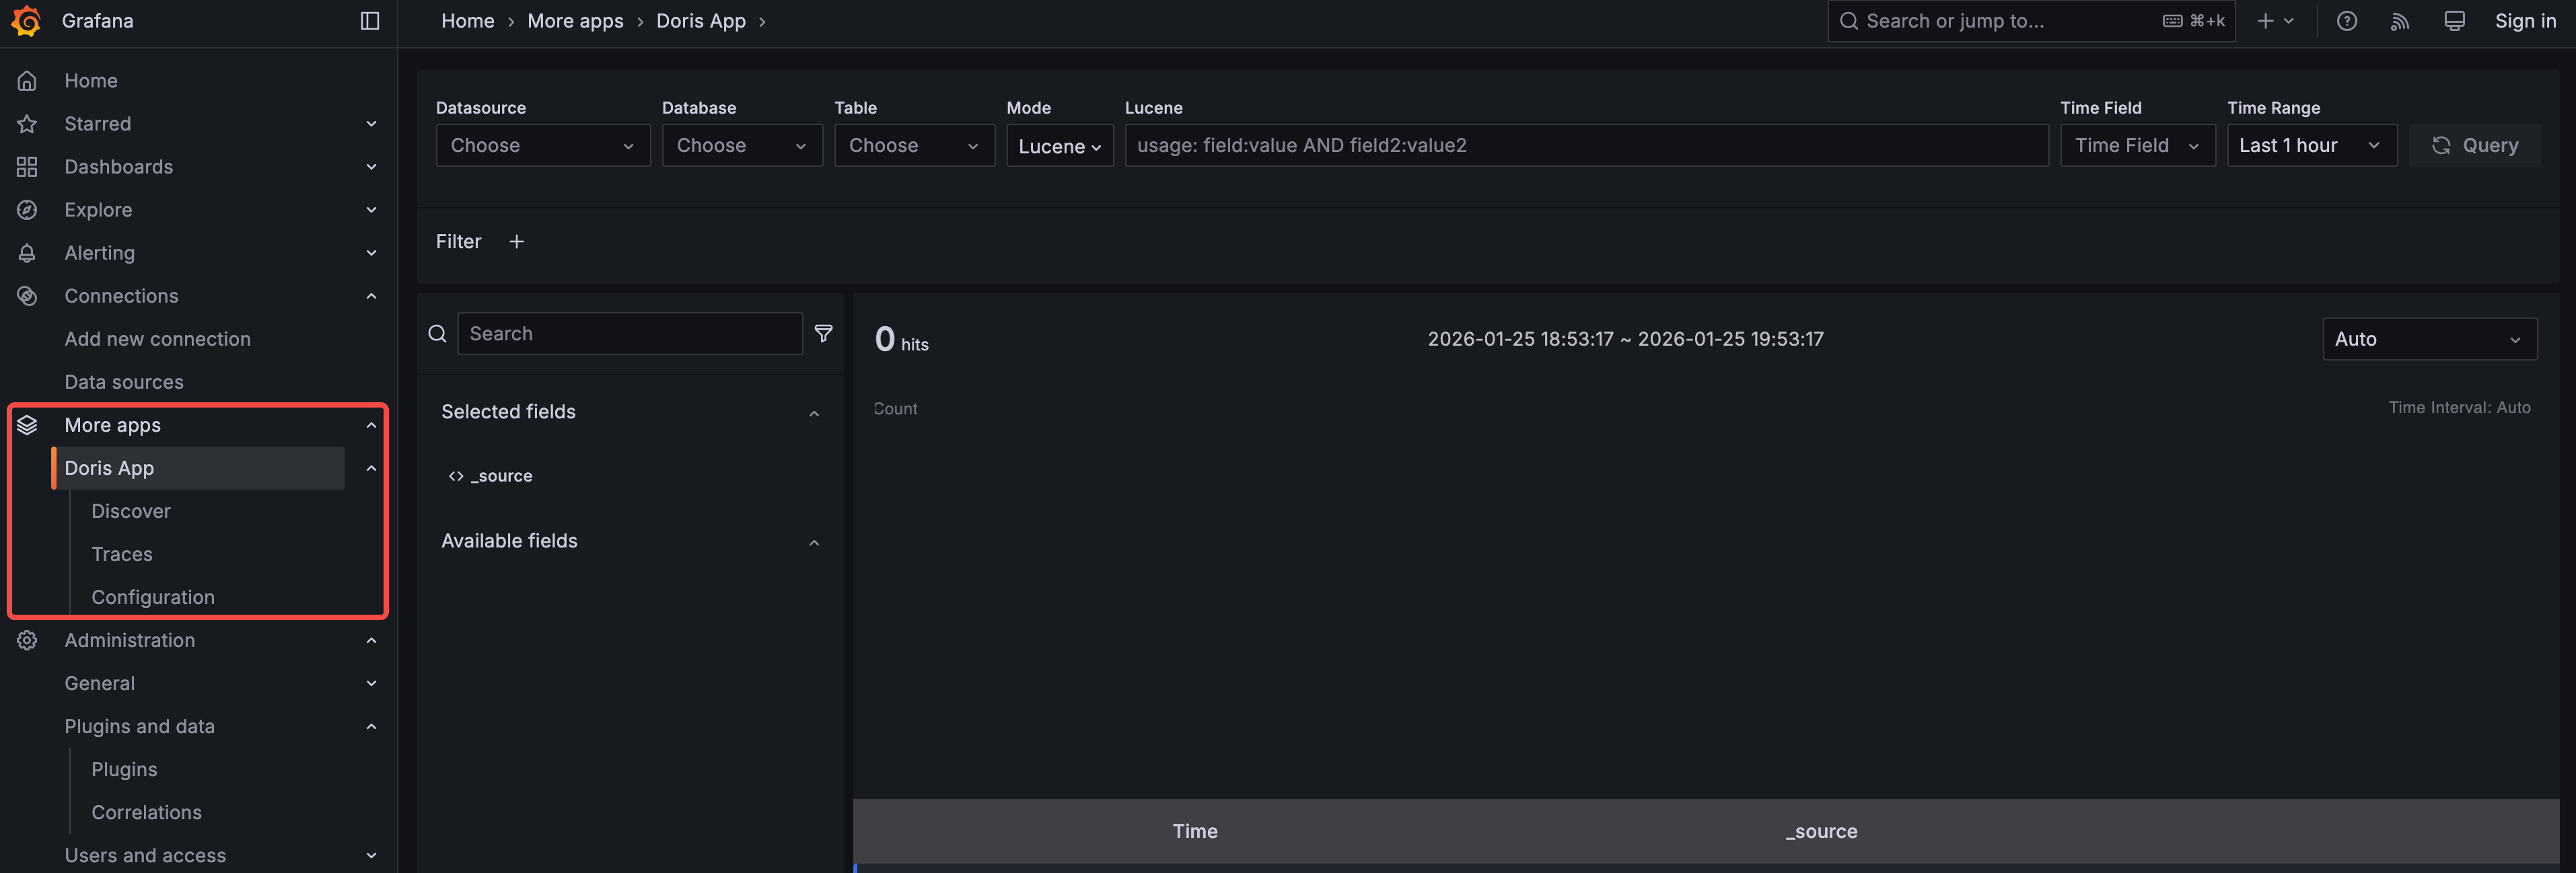
| Once enabled, you can find the Doris App under "More apps" in the left-side menu. Click "Doris App" to start exploring. |
| |
|  |
| |
| |
| |
| ## Search |
| |
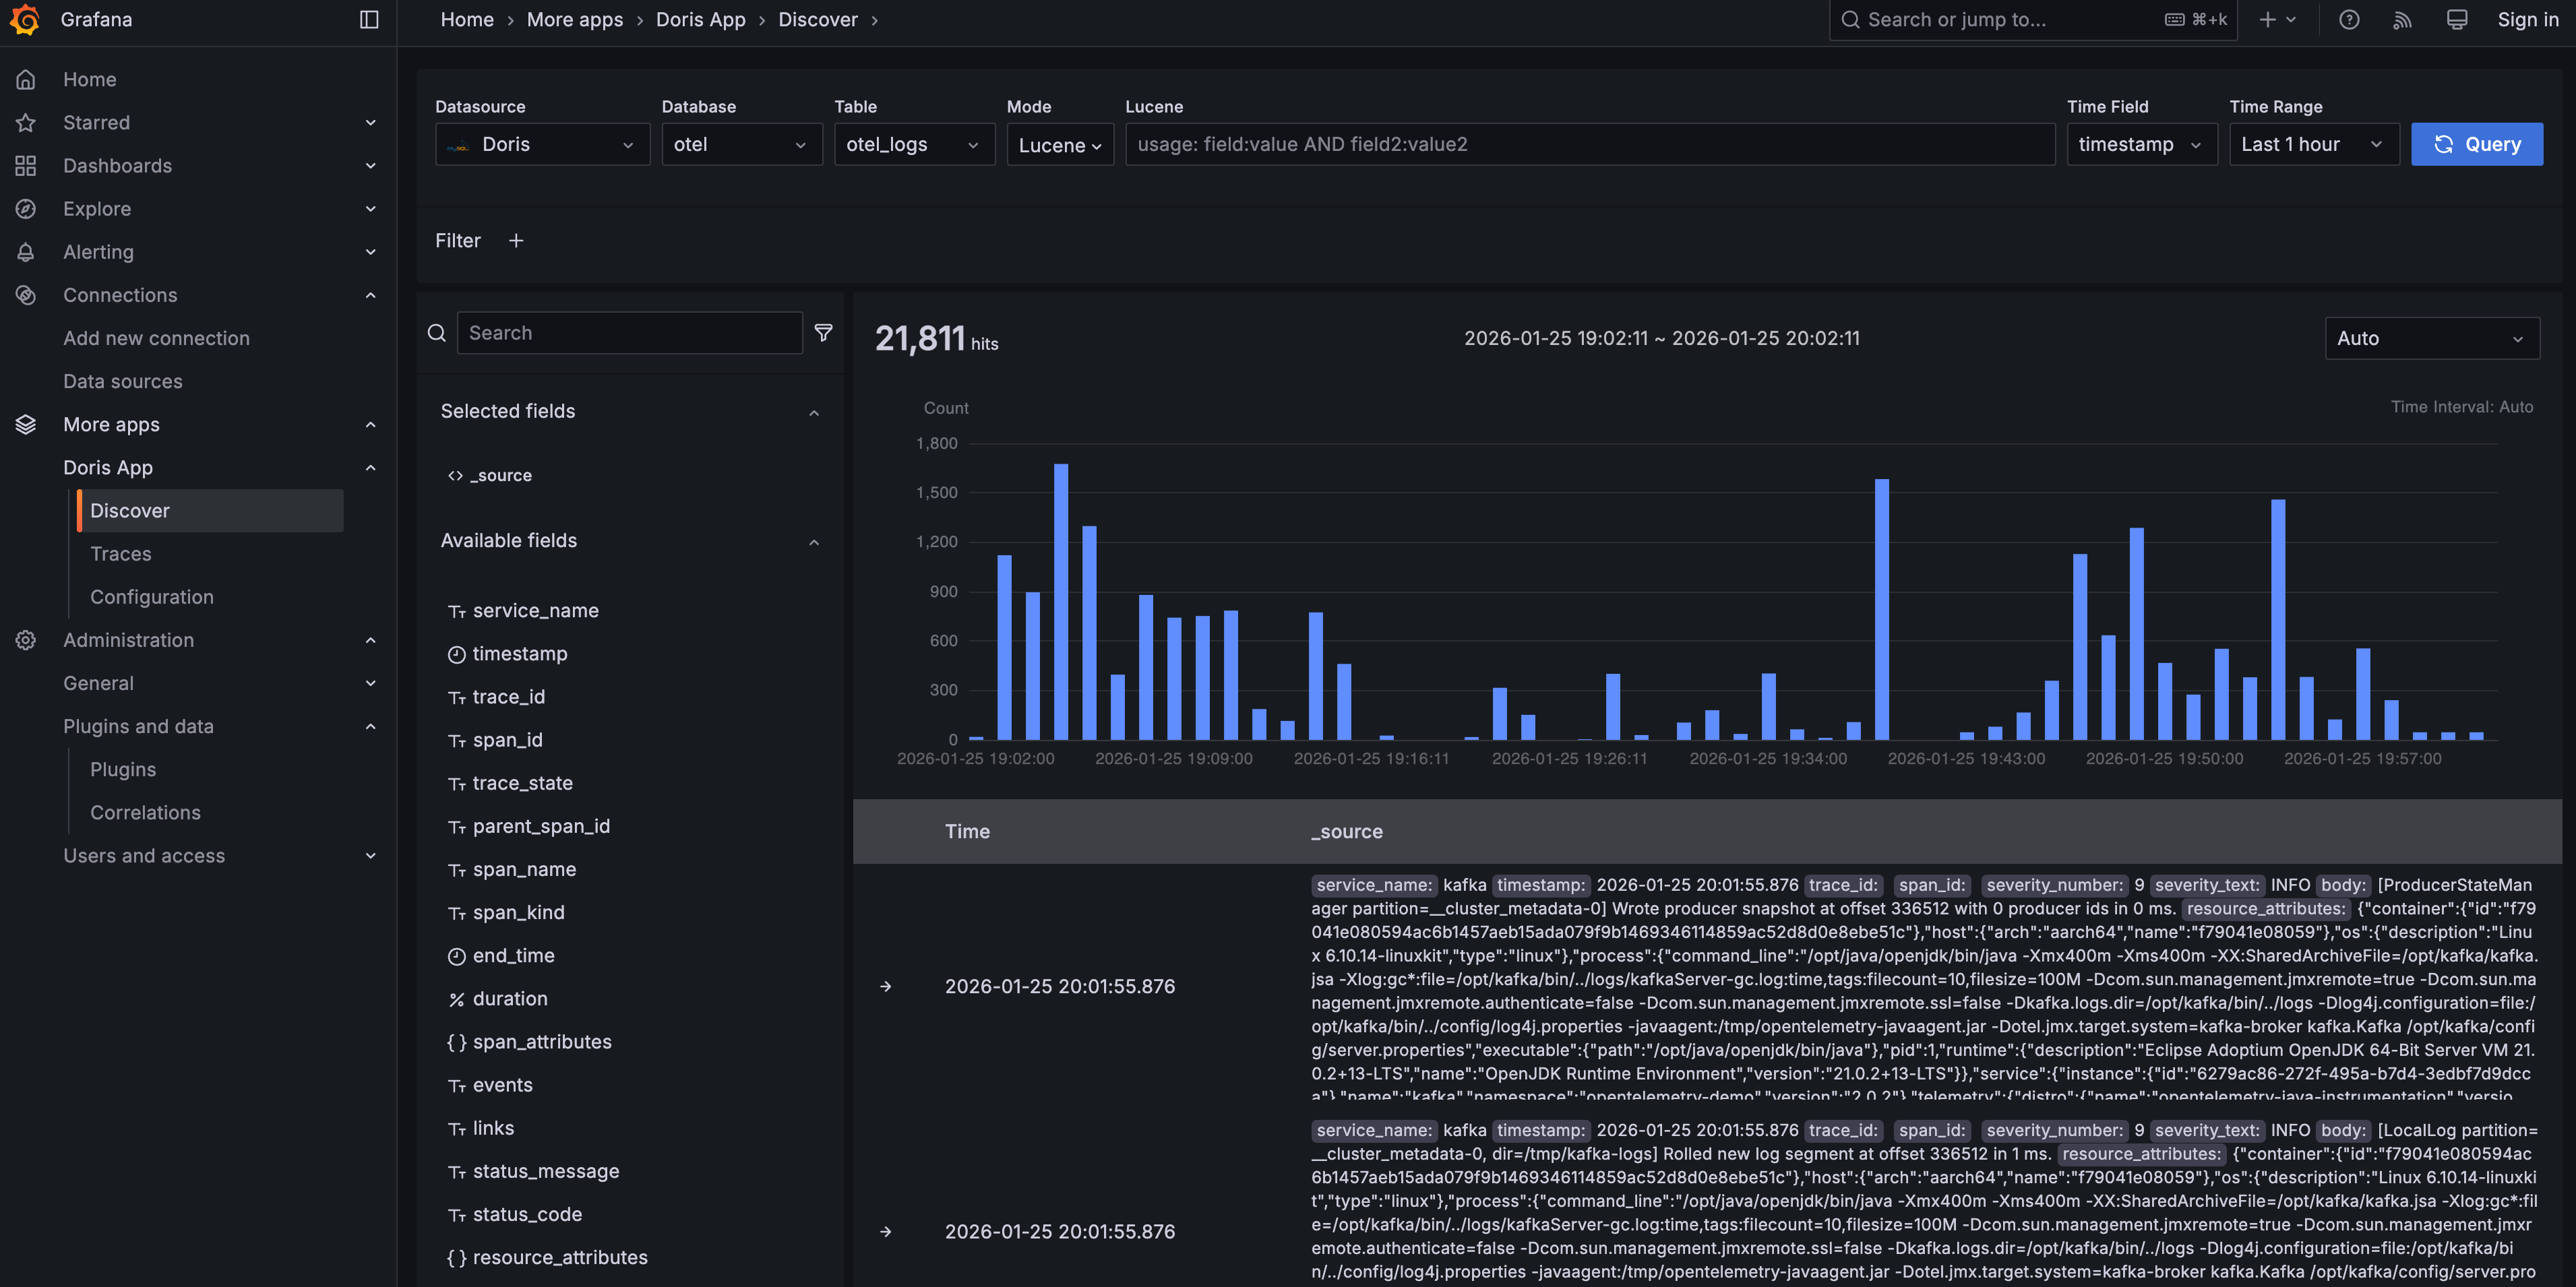
| In the Doris App, choose `Doris` as the data source, `otel` as the database, and `otel_logs` as the table — you will see some data. The UI should look familiar and easy to use for Kibana users. |
| |
|  |
| |
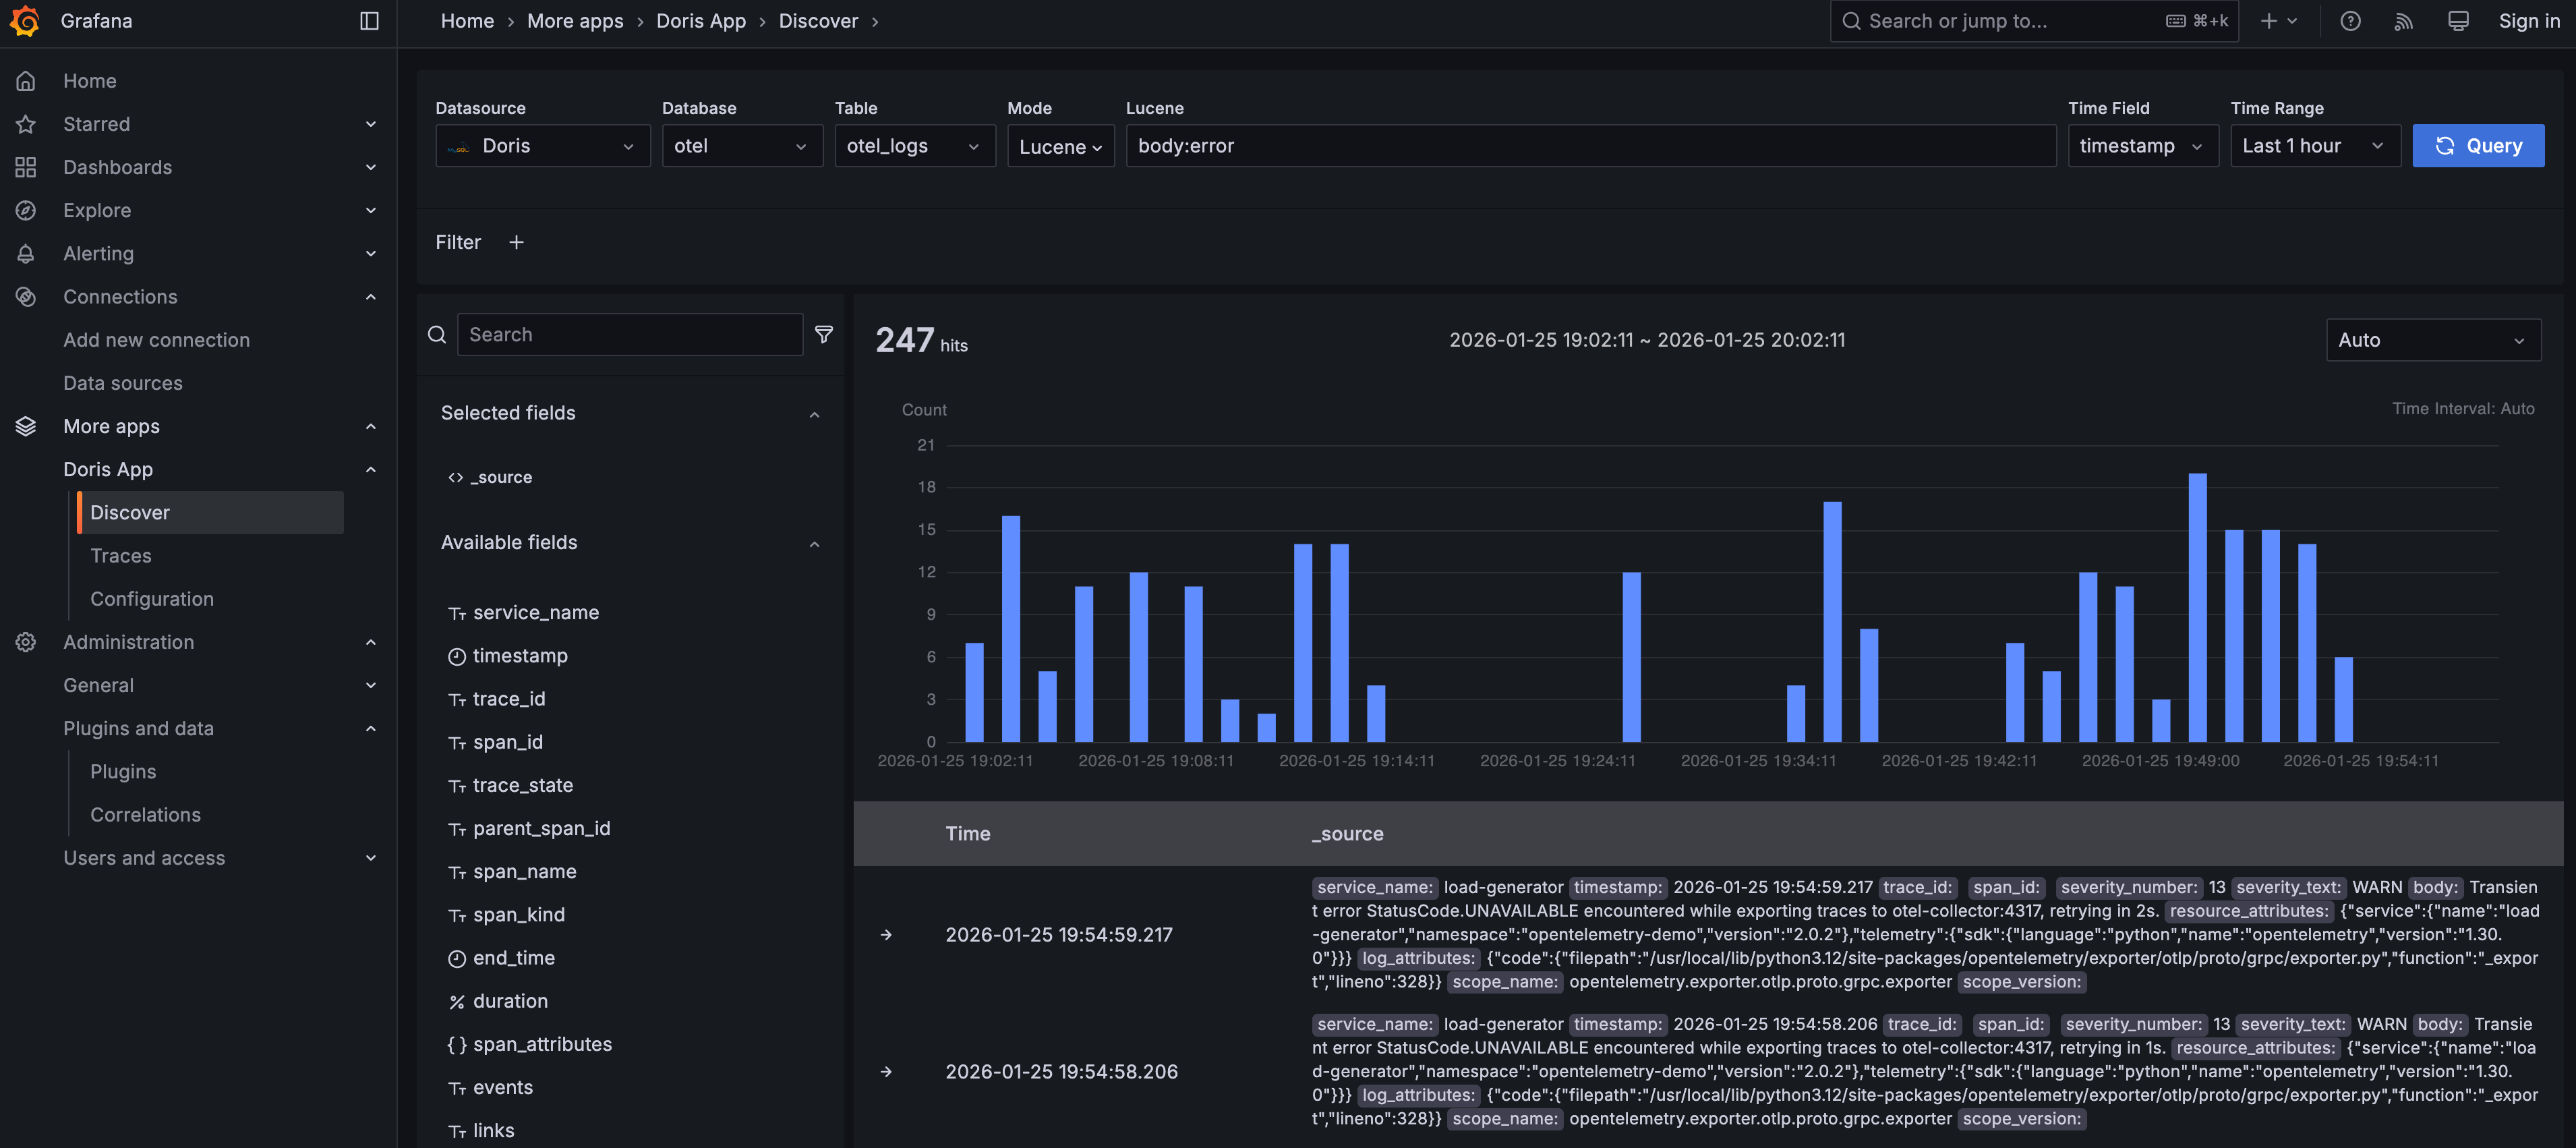
| Try entering `body:error` in the search box to find logs whose body field contains the word `error`. |
| |
|  |
| |
| |
| |
| ## Traces |
| |
| Click **Traces** under the **Doris App** menu to explore and analyze traces. |
| |
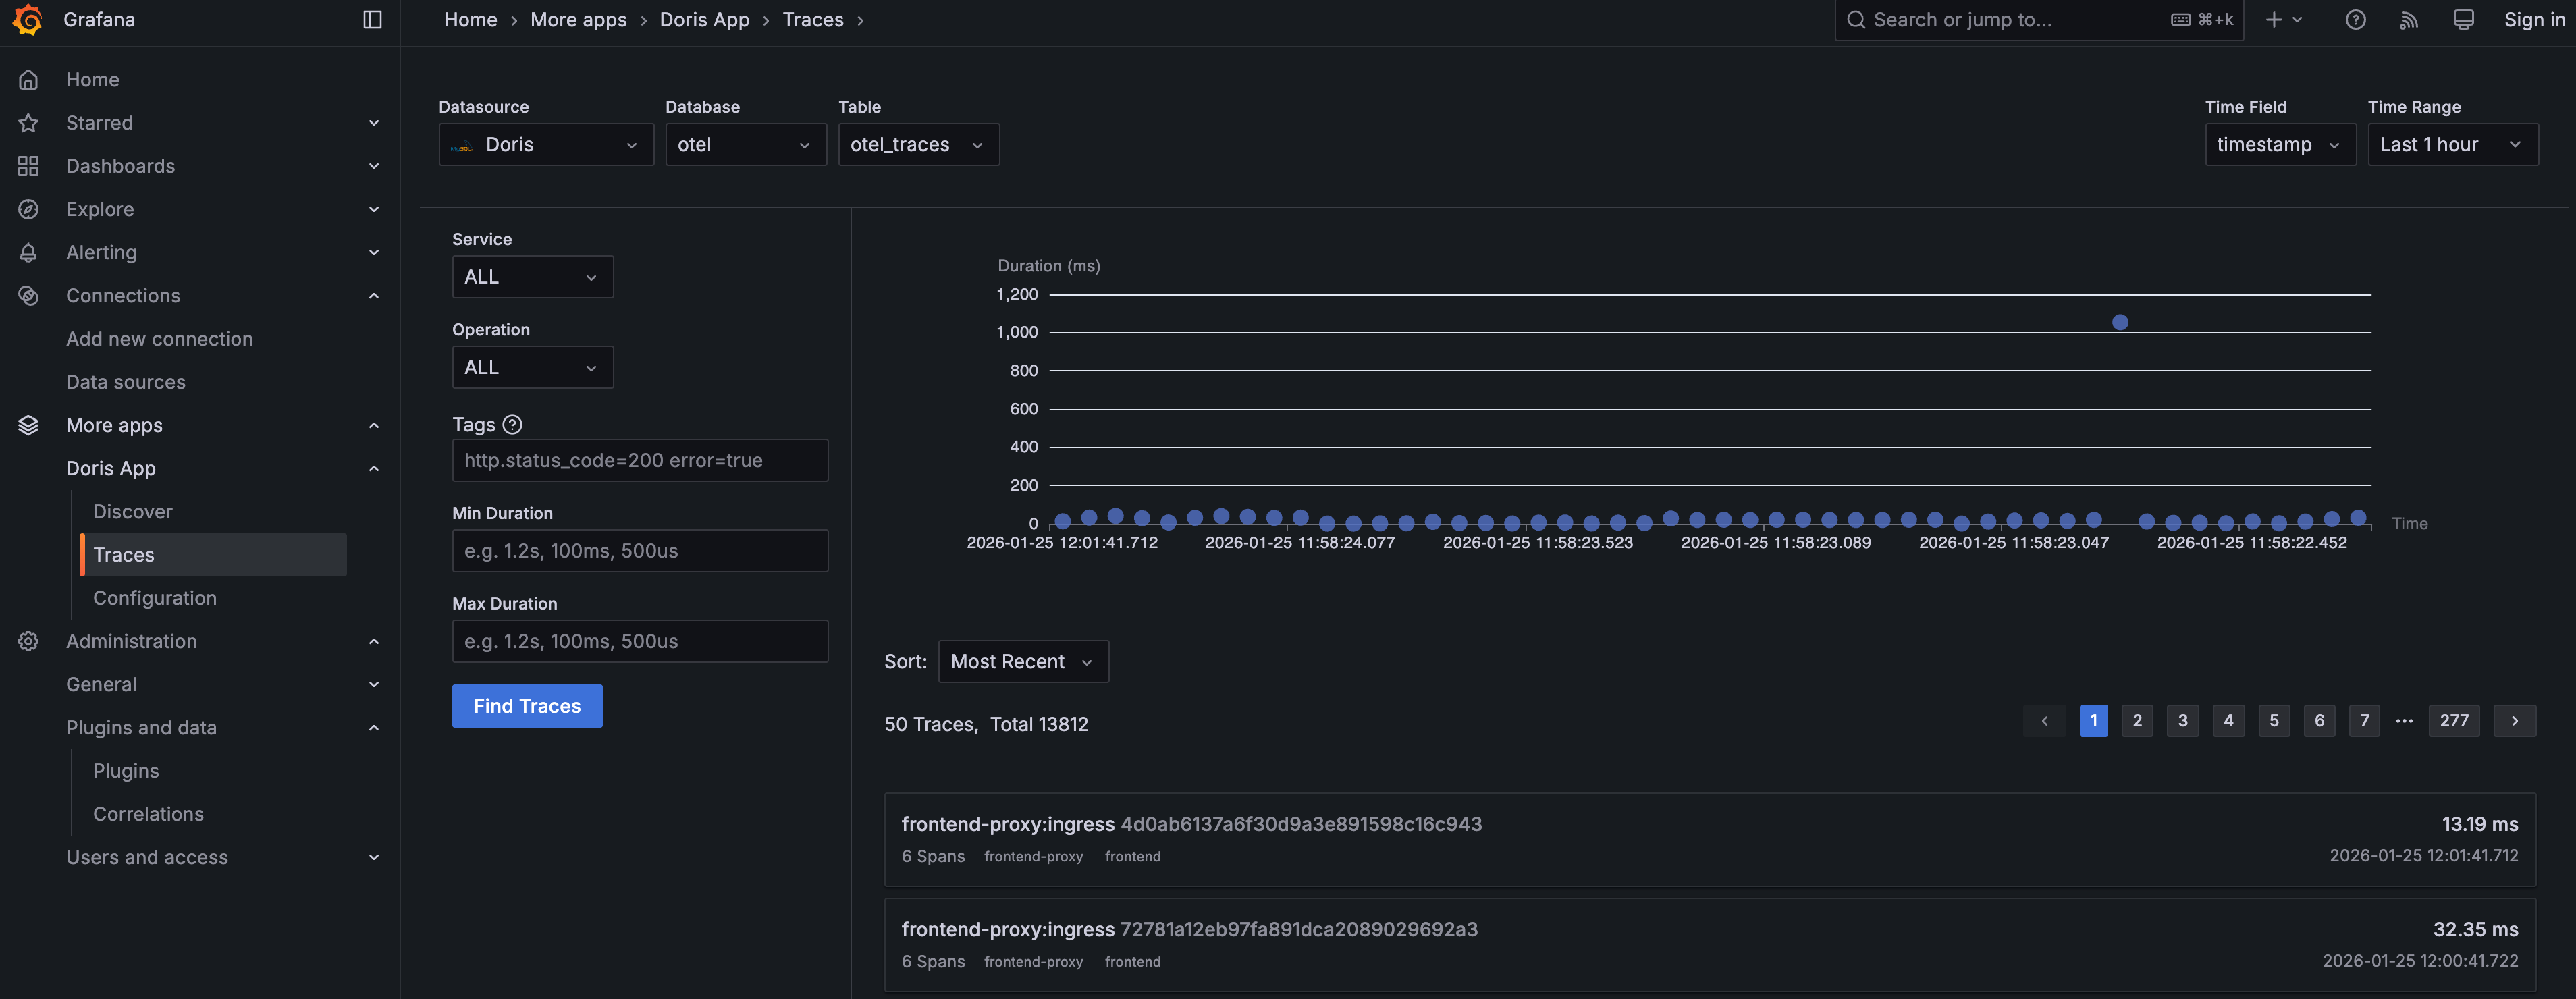
| Choose `Doris` as the data source, `otel` as the database, and `otel_traces` as the table. Click the **Find Traces** button to fetch the most recent 50 trace records — they will be displayed as a chart at the top and a list below. You can experiment with the Service, Operation, Tags, and Duration filters on the left, and try different sort options below the trace chart. |
| |
|  |
| |
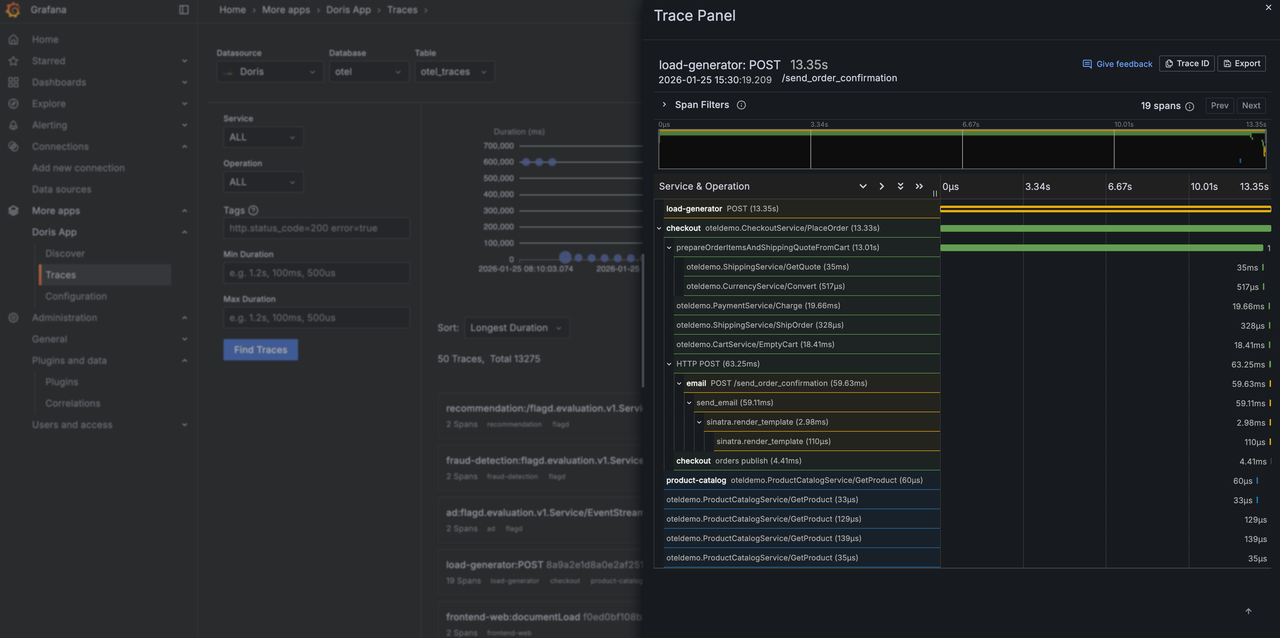
| Click a specific trace to view its waterfall visualization. Inside the waterfall view, use the **Span Filter** to further filter spans within the trace. |
| |
|  |
| |
| ## Dashboards |
| |
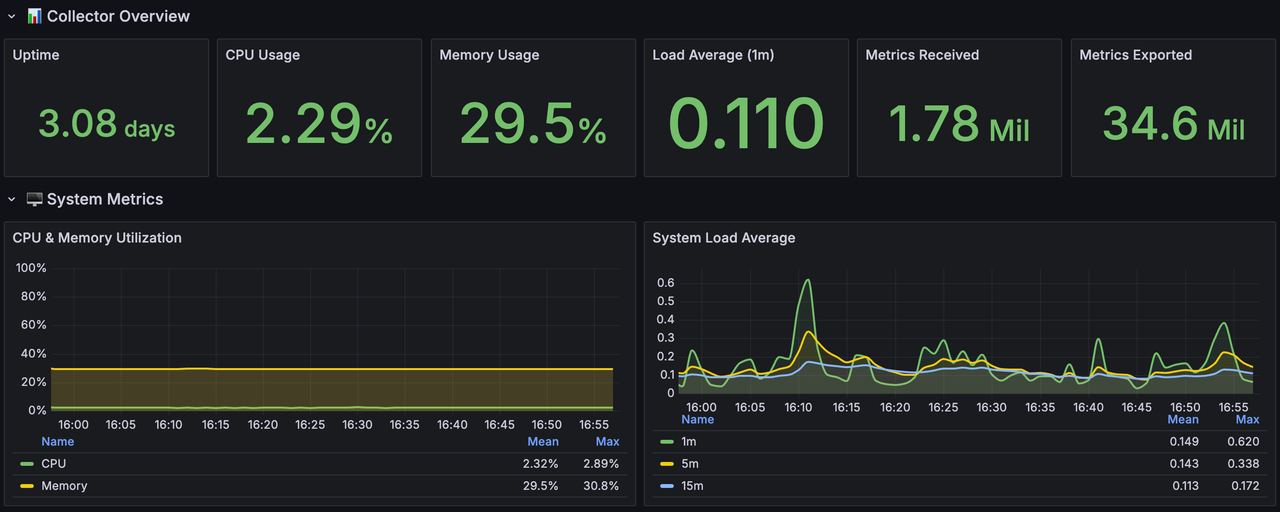
| Click **Dashboards** in the left-side menu, then click **Doris Demo**, and finally click **Collector Self-Monitoring**. You will see the demo dashboard below, which shows host metrics of the OpenTelemetry Collector itself. |
| |
|  |
| |
| |
| |
| ## Alerting |
| |
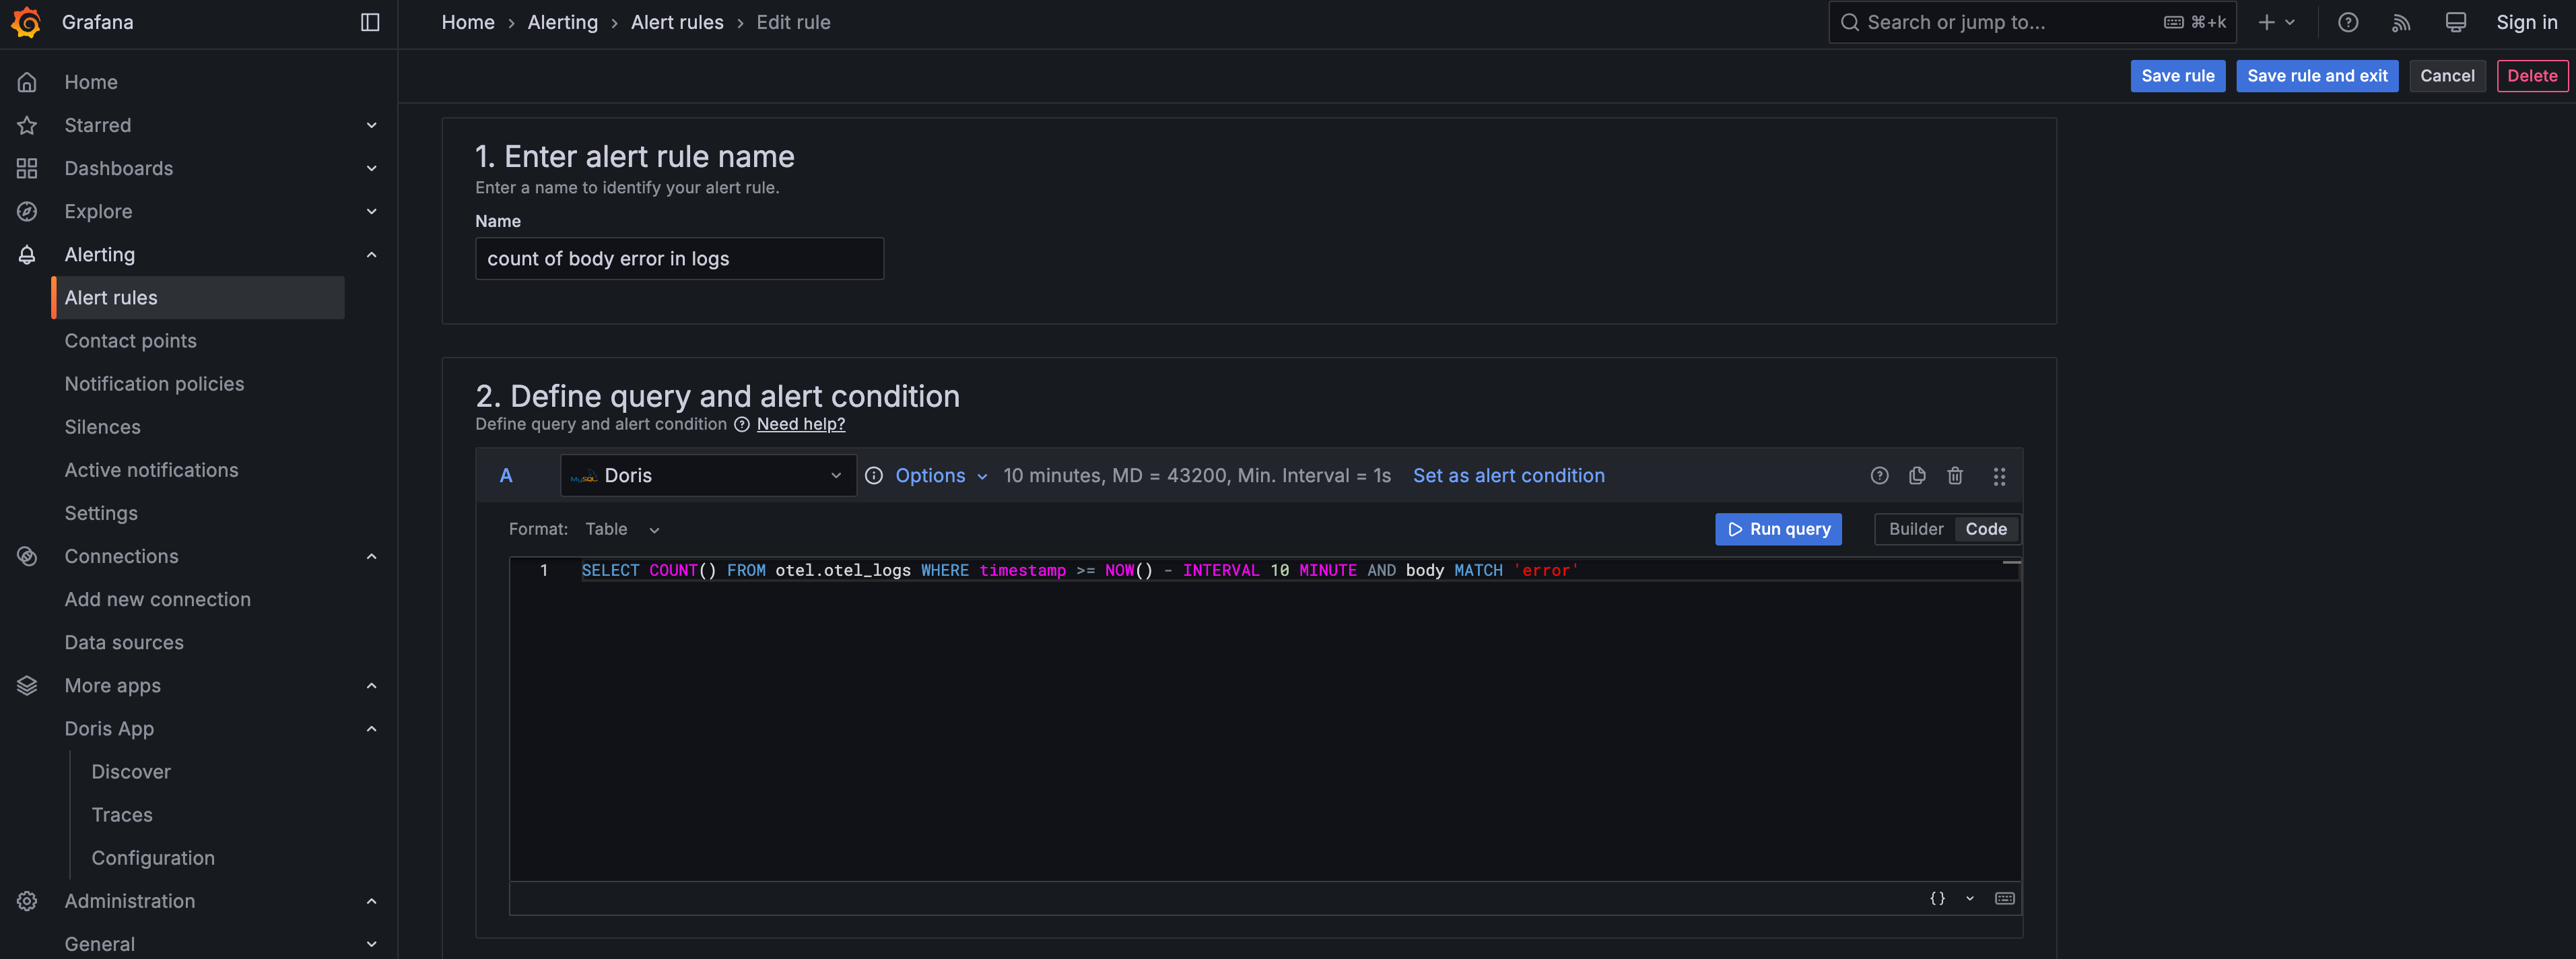
| You can create alert rules based on SQL queries against Doris. Specify the alert condition parameters such as the **Reduce** function and the **Threshold**. |
| |
|  |
