{ “title”: “Quick Start”, “sidebar_label”: “Quick Start”, “language”: “en-US”, “description”: “How to quickly try out the DOG Stack observability solution? This article walks through one-click deployment with Docker Compose and a complete tour of the Doris App plugin, log search, trace analysis, dashboards, and alerting.”, “keywords”: [ “DOG Stack quick start”, “Docker Compose”, “Doris App plugin”, “Grafana”, “OpenTelemetry”, “log search”, “trace analysis”, “dashboard”, “alerting” ] }
The easiest way to experience DOG Stack is to visit the online demo — no deployment required. If you want to run your own instance, getting started with Docker Compose is just as easy.
Deployment
git clone https://github.com/ai-observe/ai-observe-stack.git
cd ai-observe/demo
docker compose up -d
This launches a complete DOG Stack along with a demo e-commerce application made up of 10+ microservices.
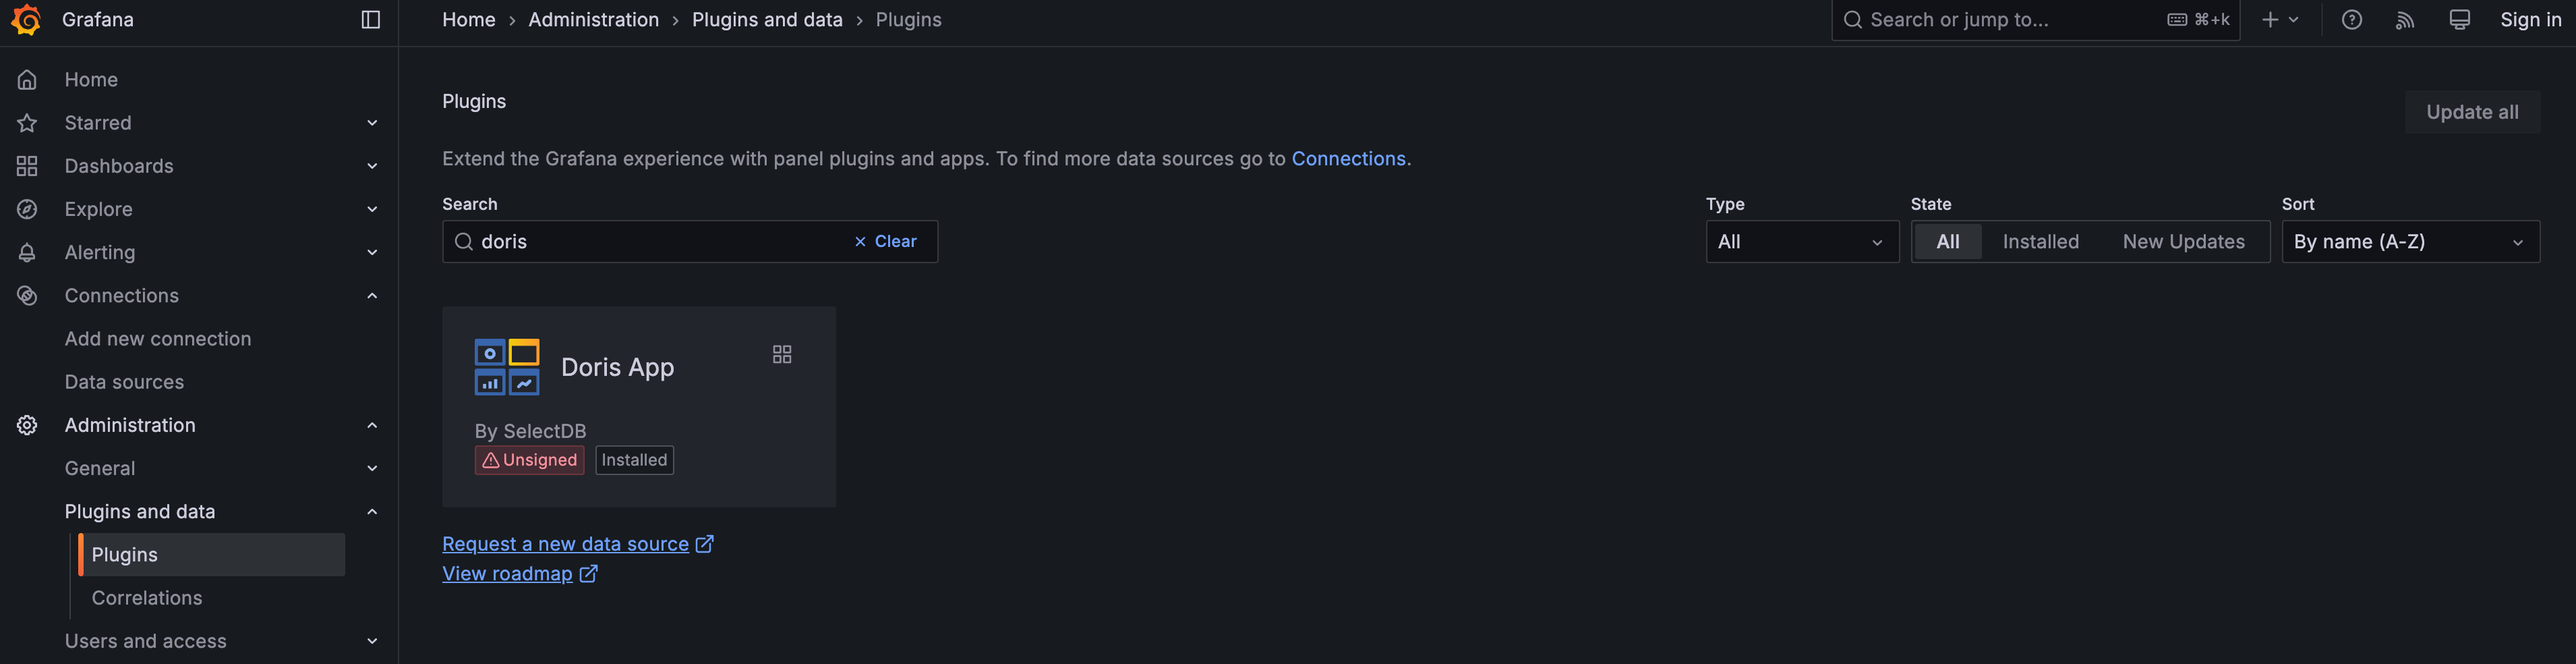
Open your web browser, navigate to http://localhost:33000/grafana/plugins, search for doris, and click the Doris App entry.
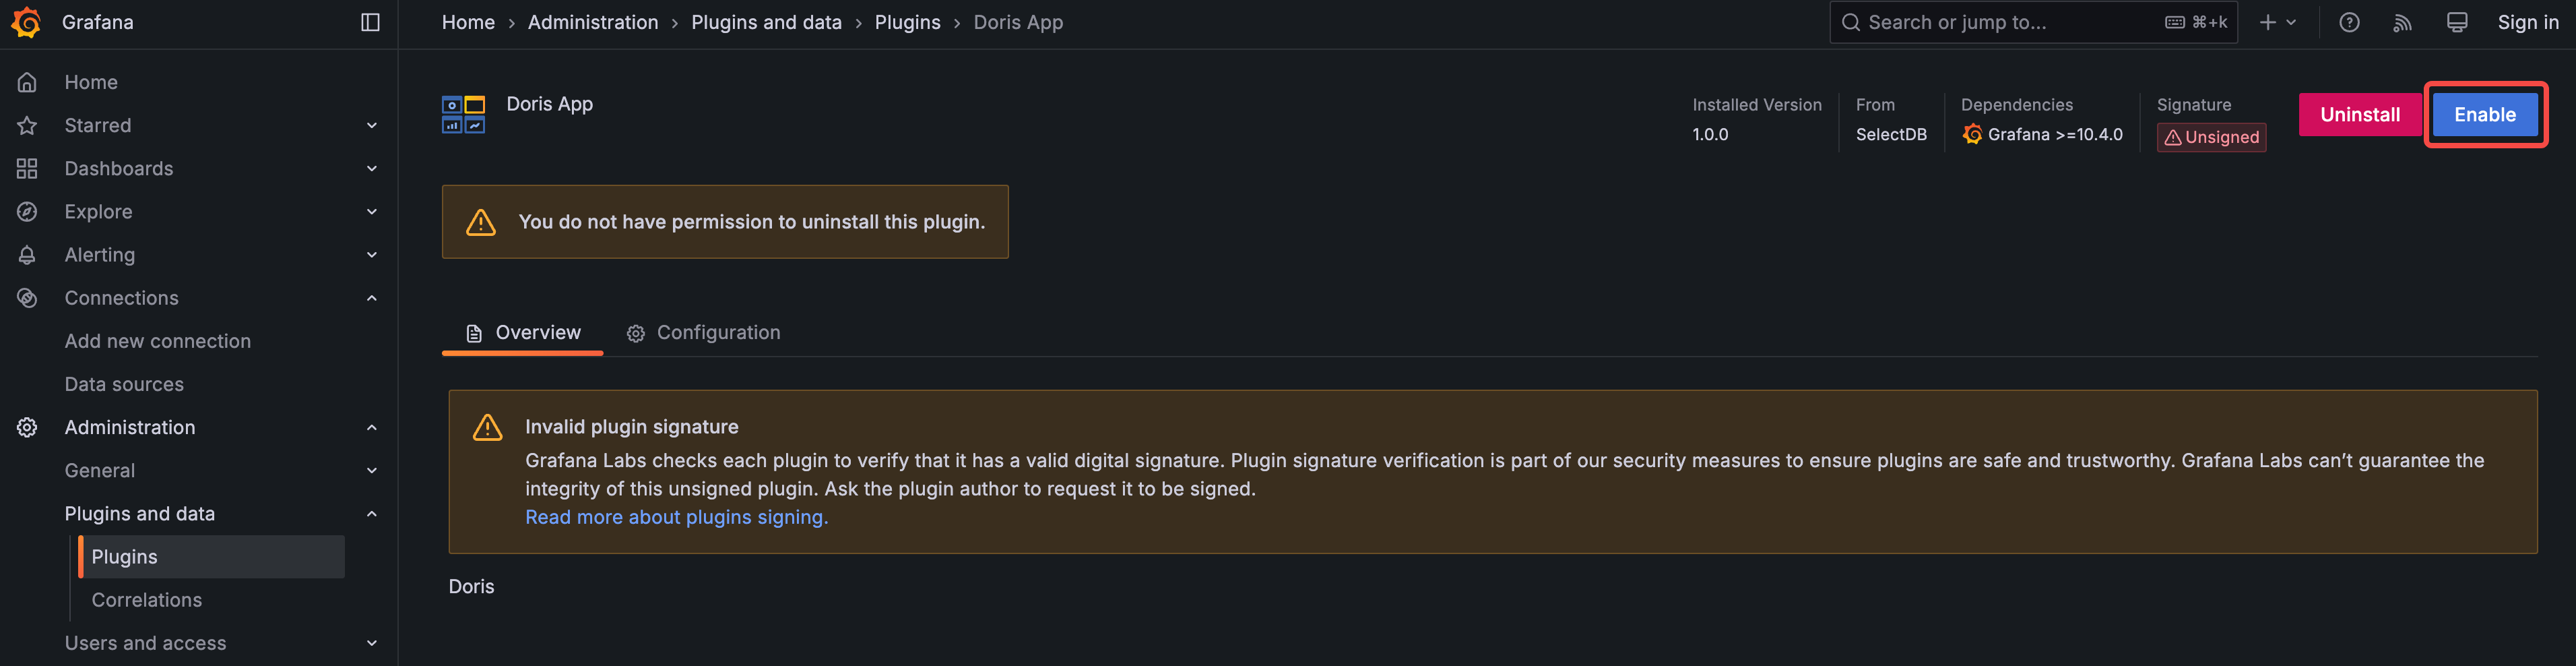
Then click the Enable button to enable the Doris App.
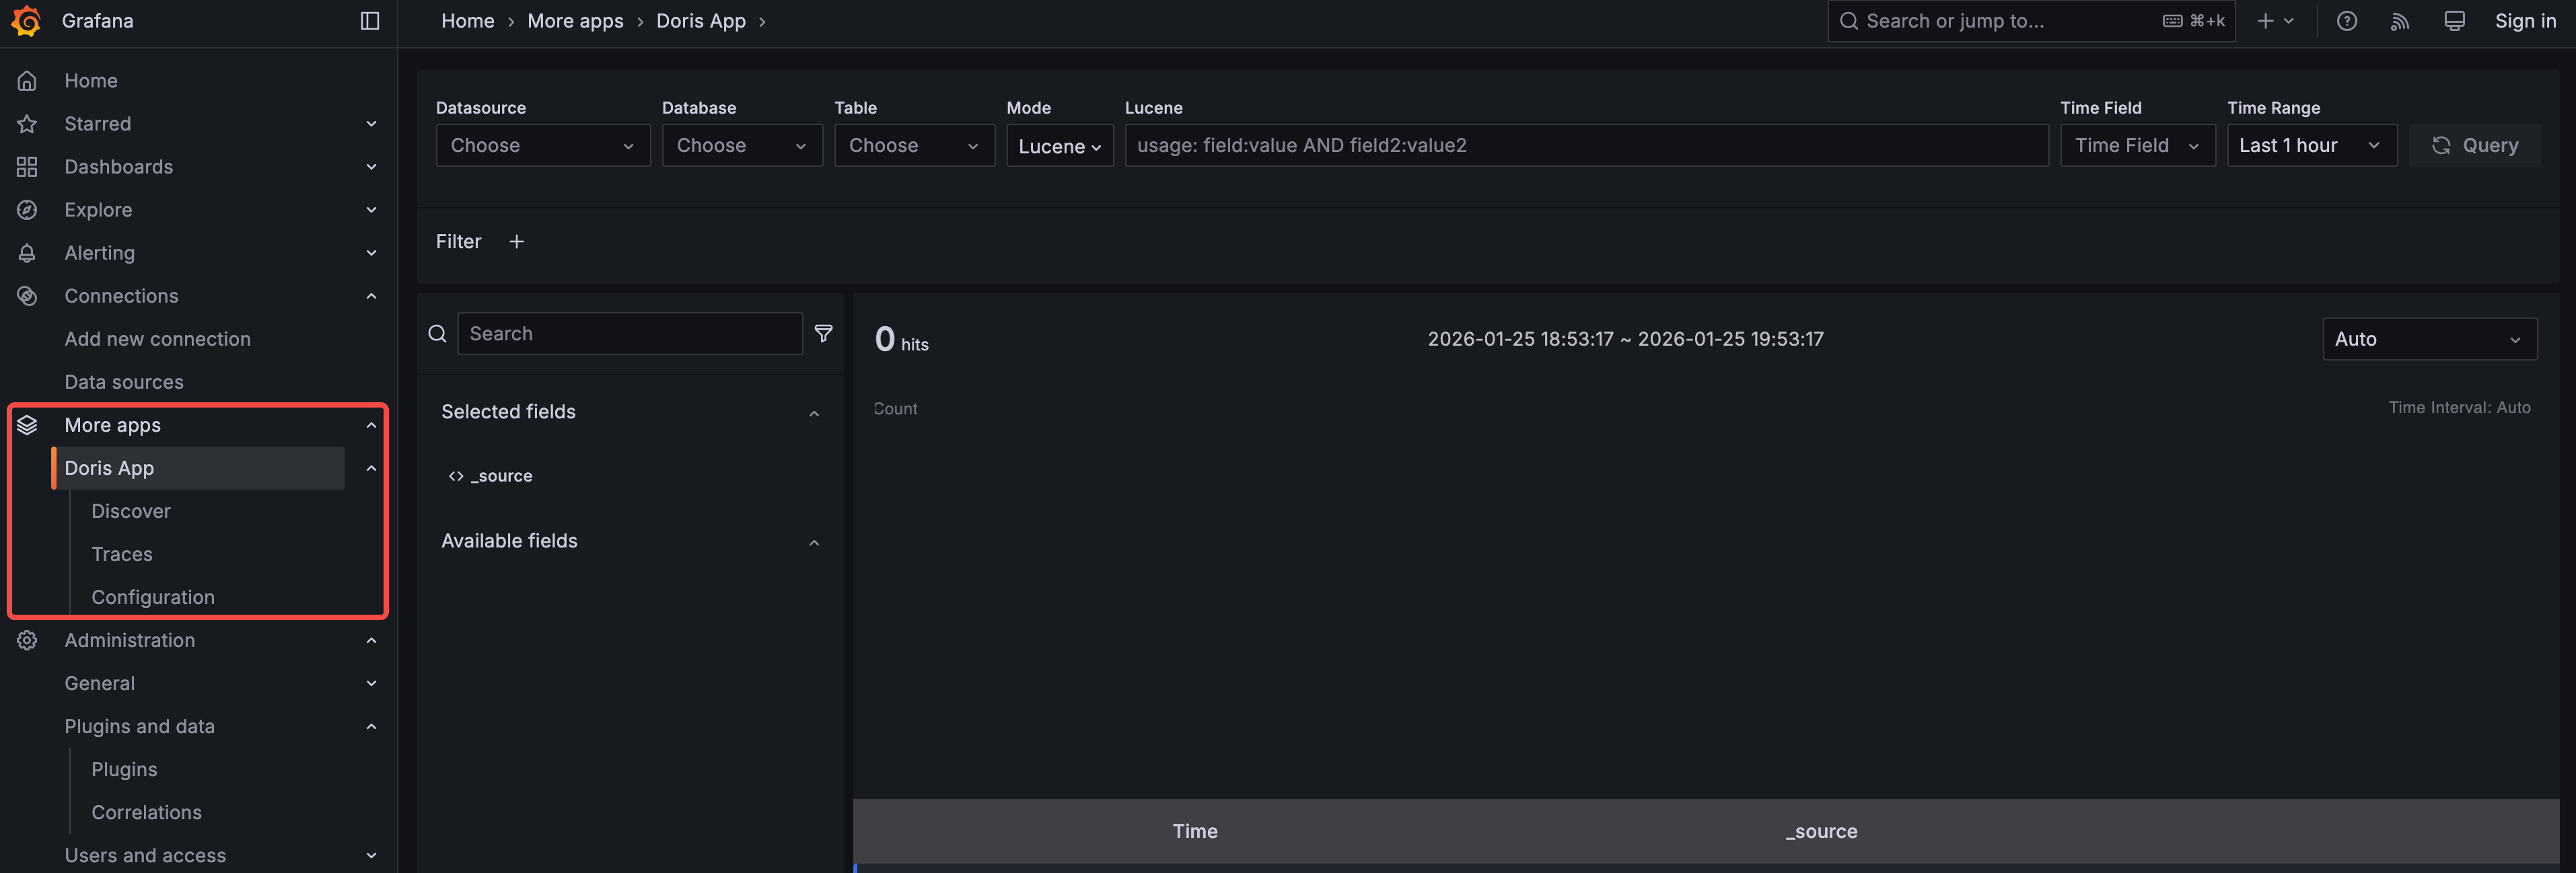
Once enabled, you can find the Doris App under “More apps” in the left-side menu. Click “Doris App” to start exploring.
Search
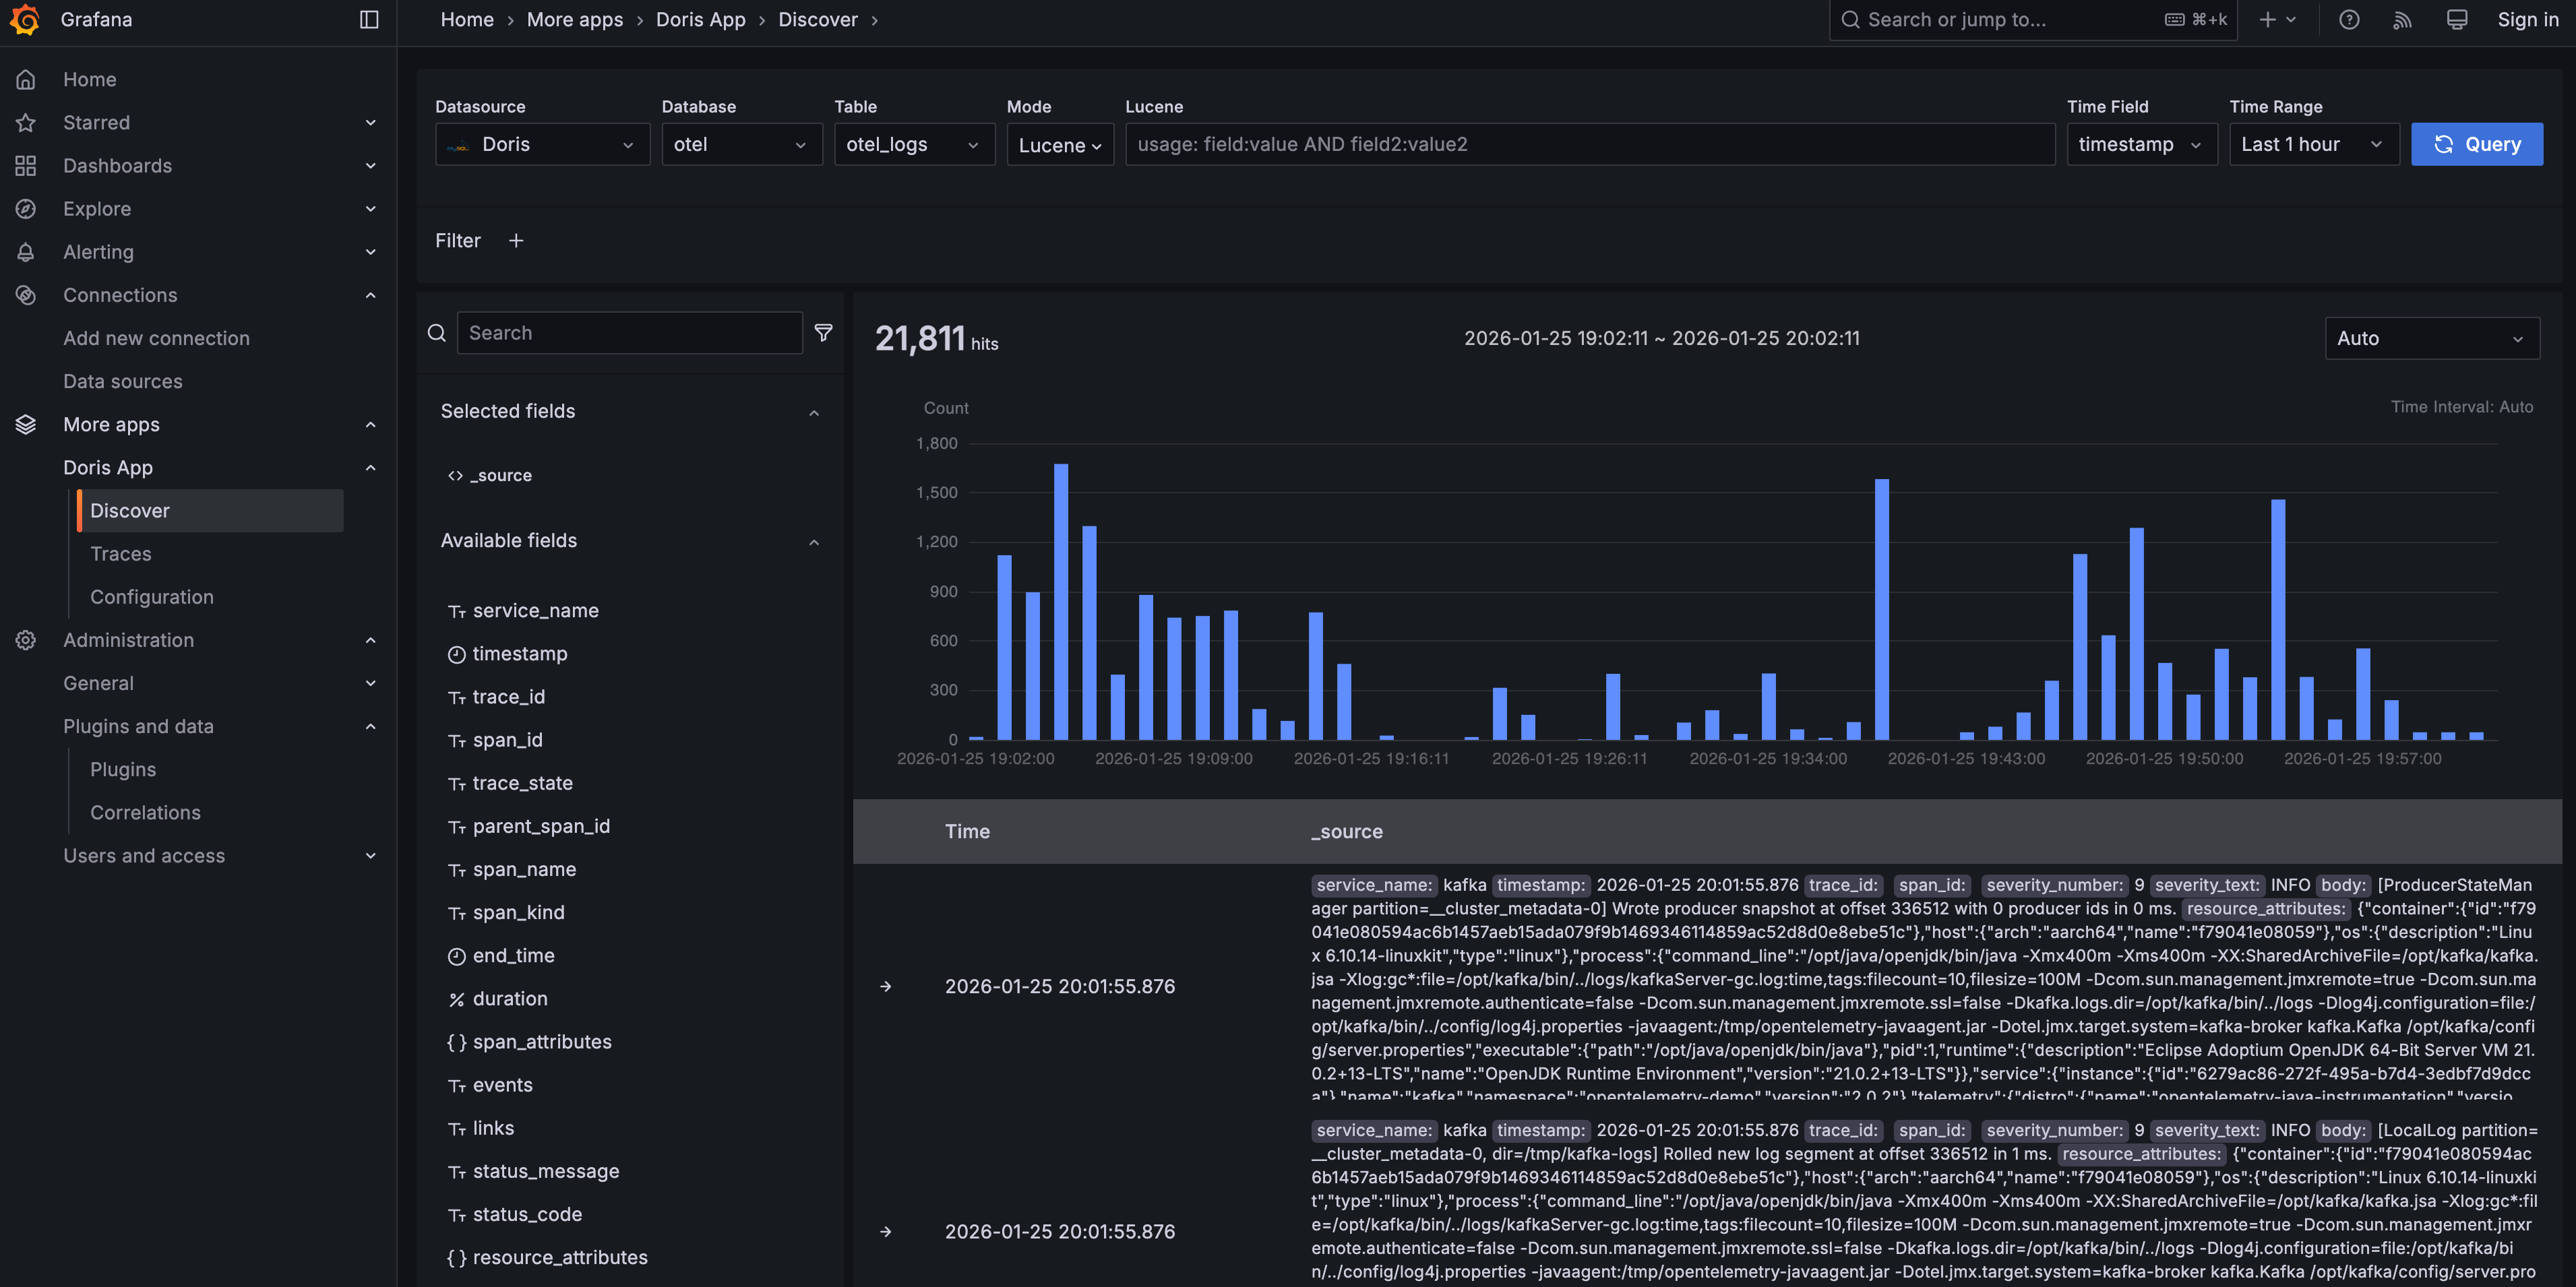
In the Doris App, choose Doris as the data source, otel as the database, and otel_logs as the table — you will see some data. The UI should look familiar and easy to use for Kibana users.
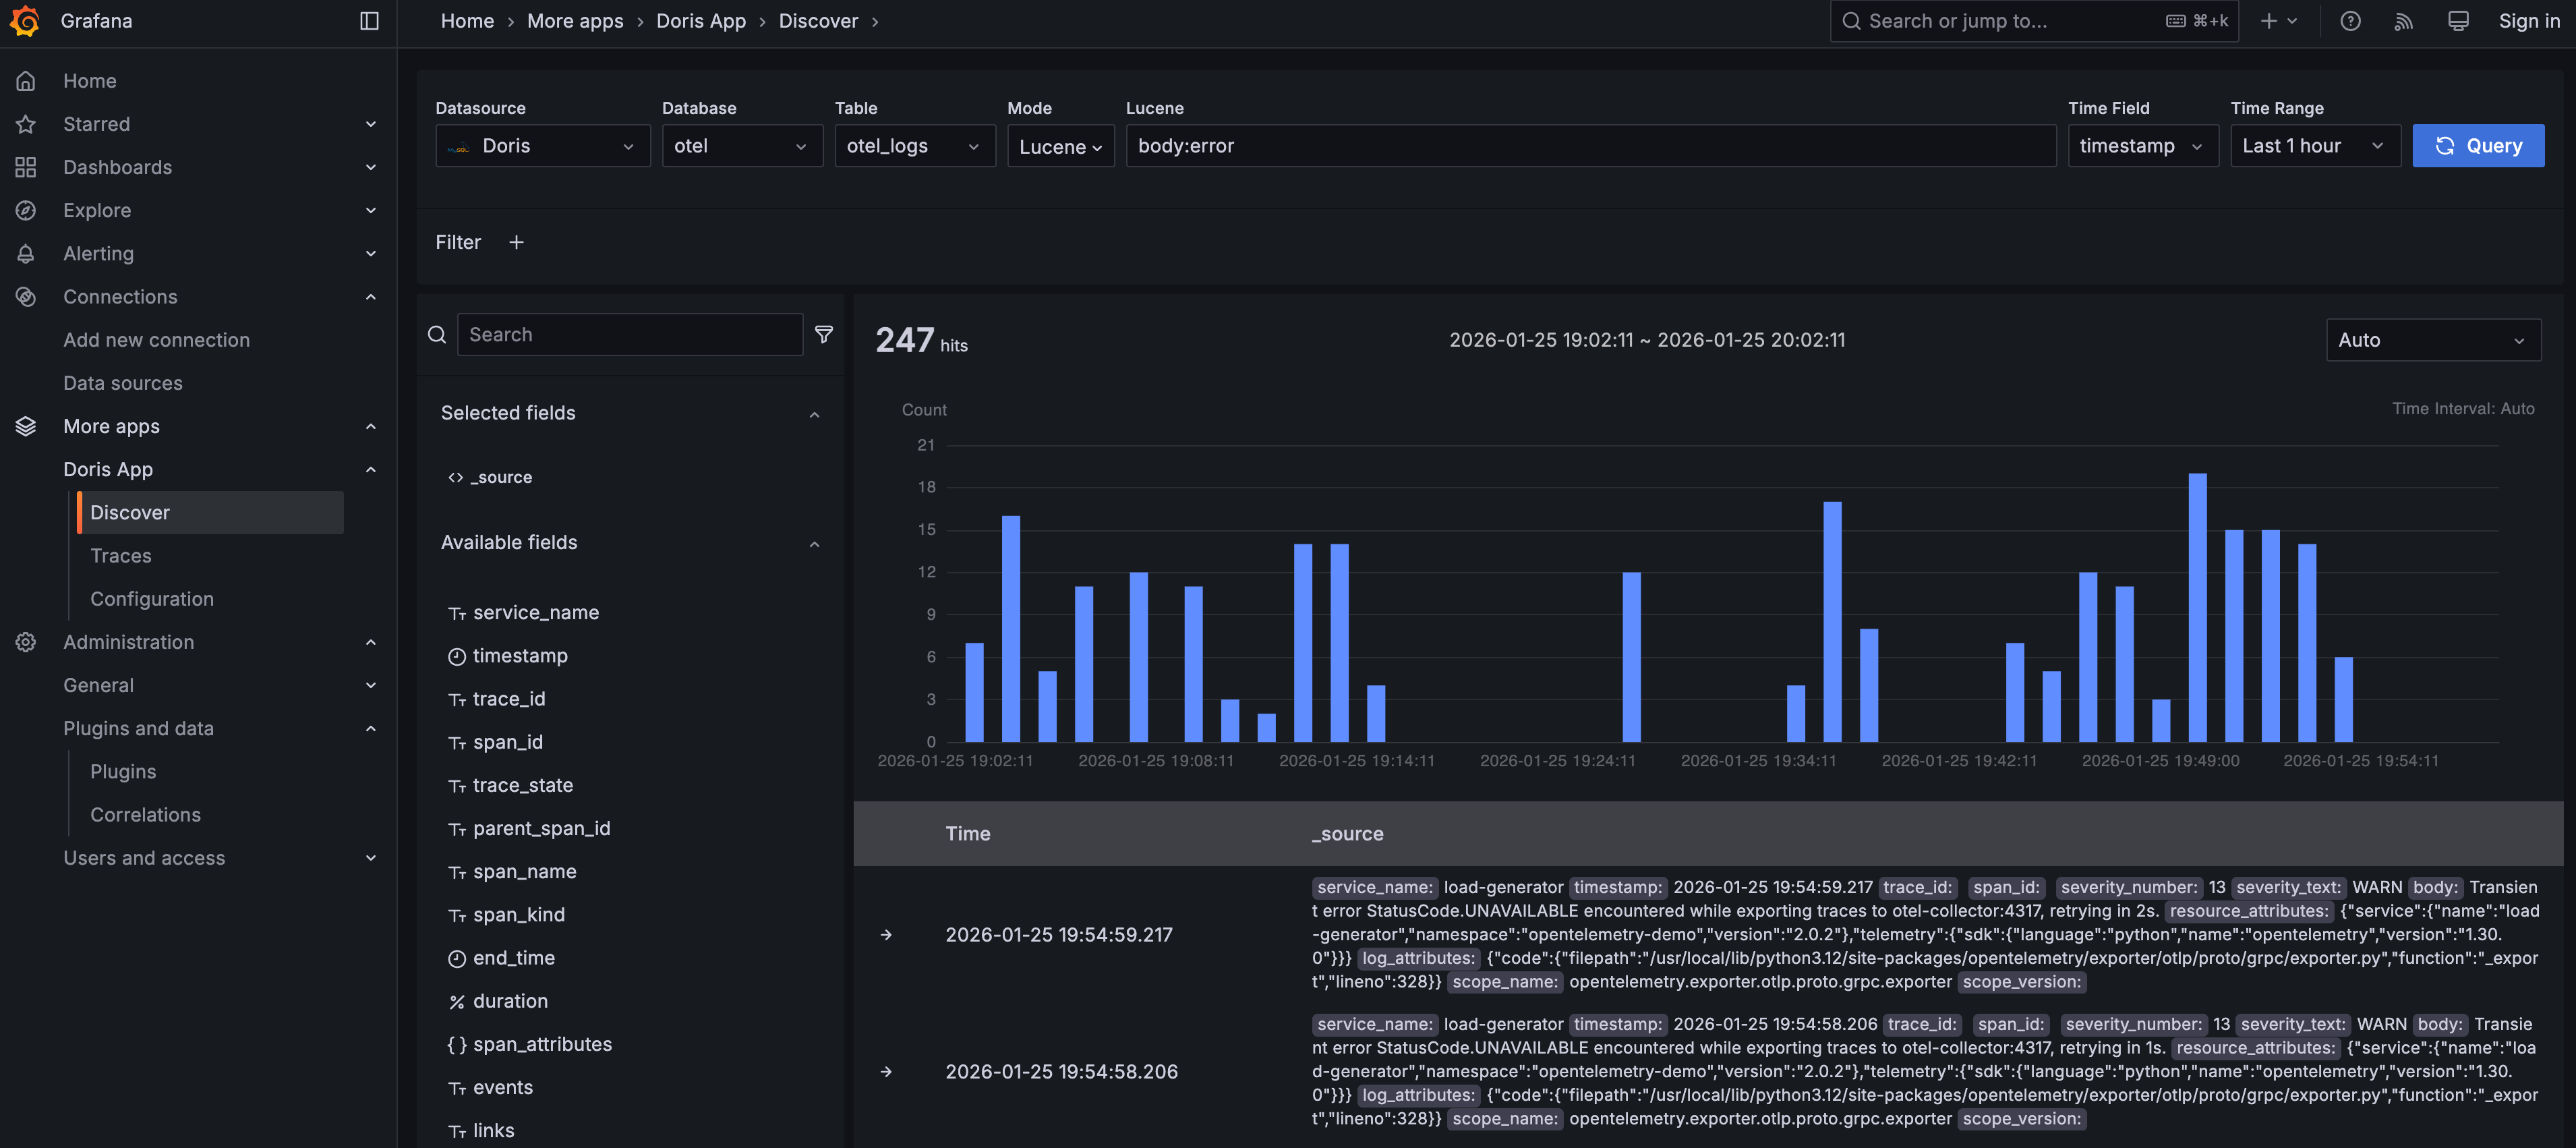
Try entering body:error in the search box to find logs whose body field contains the word error.
Traces
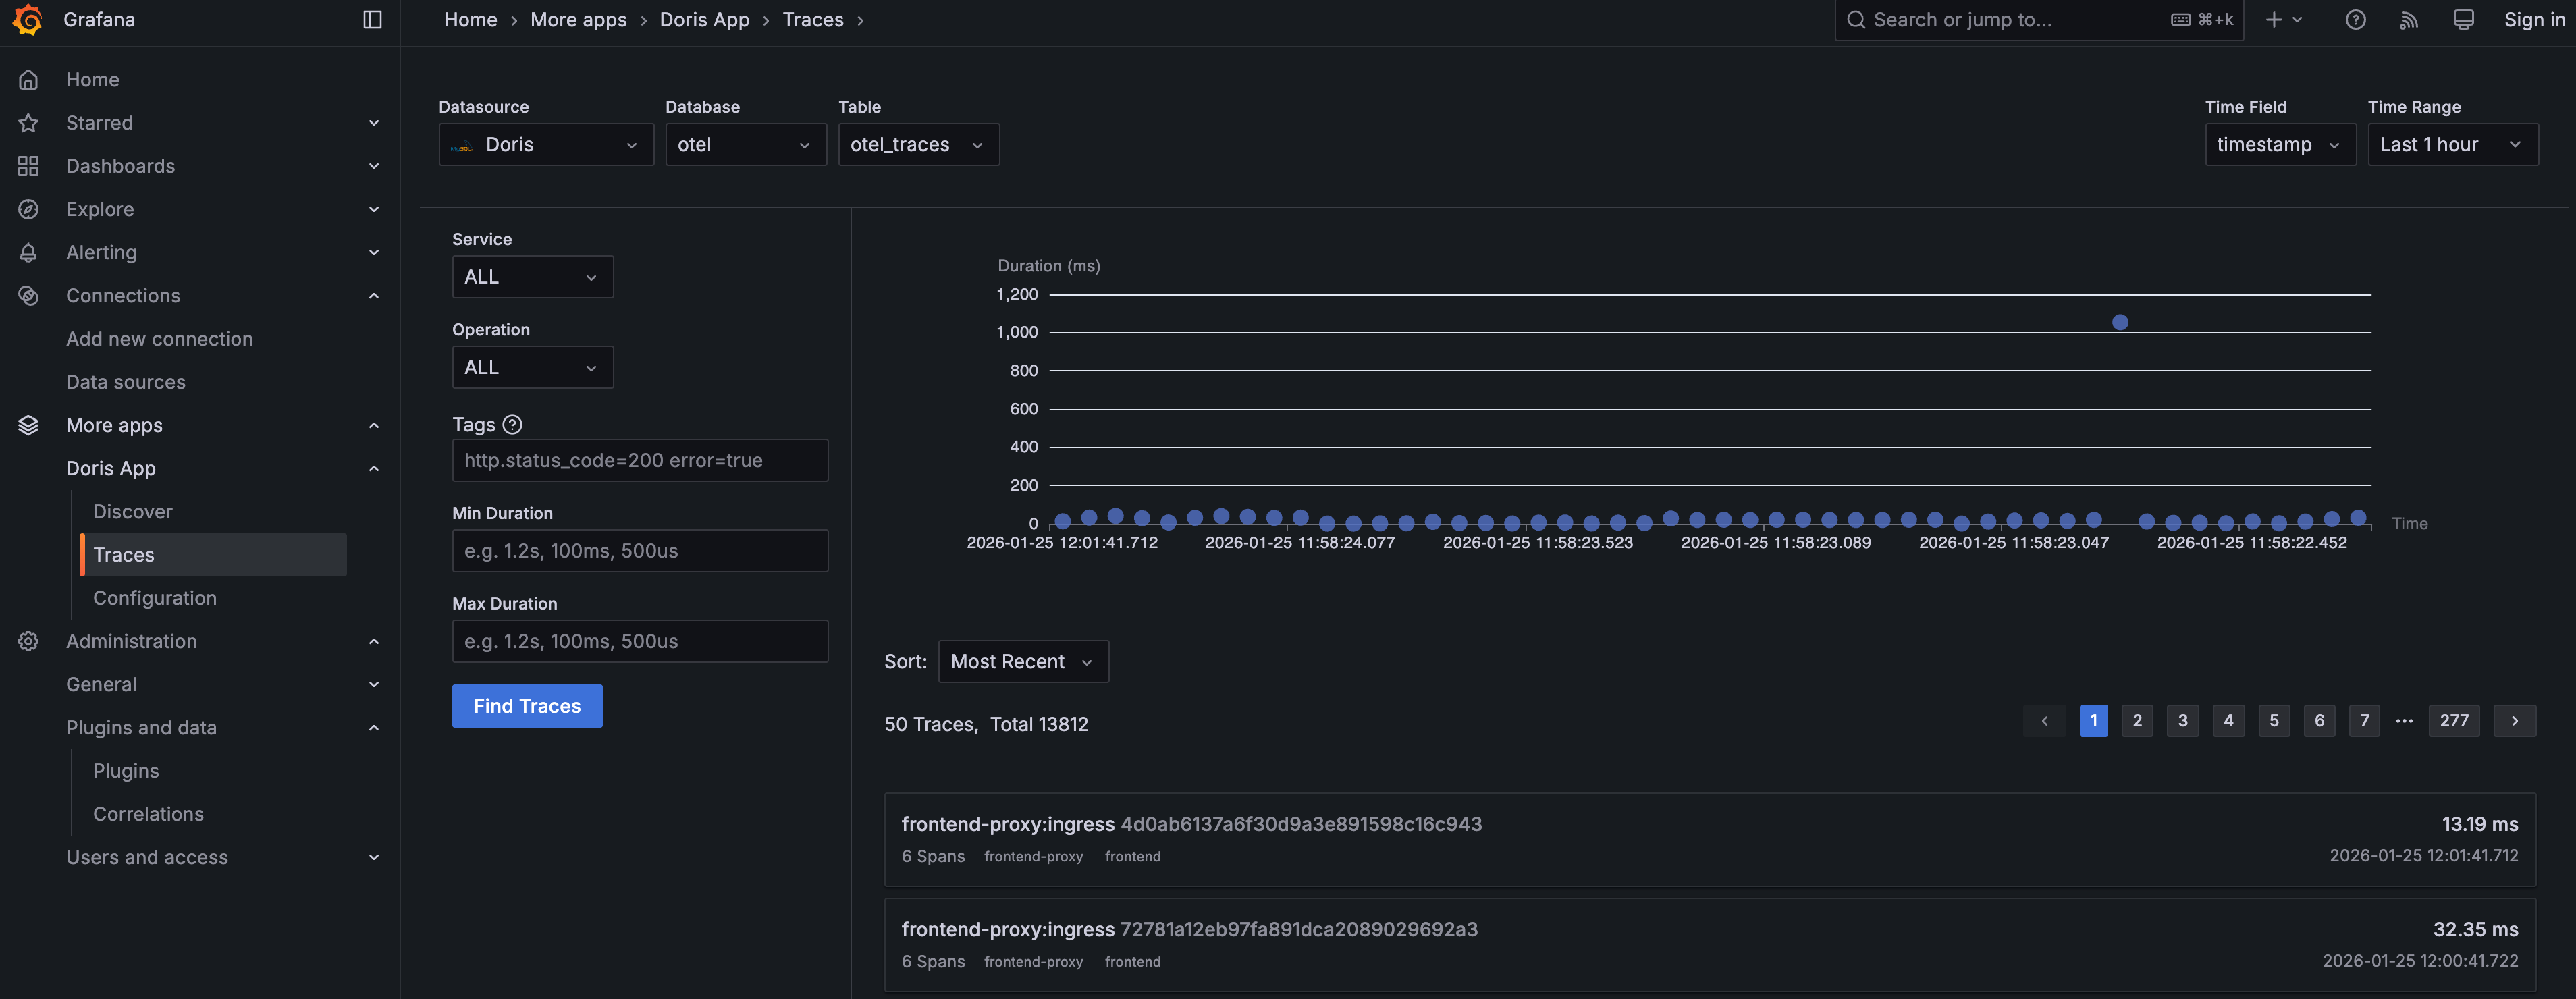
Click Traces under the Doris App menu to explore and analyze traces.
Choose Doris as the data source, otel as the database, and otel_traces as the table. Click the Find Traces button to fetch the most recent 50 trace records — they will be displayed as a chart at the top and a list below. You can experiment with the Service, Operation, Tags, and Duration filters on the left, and try different sort options below the trace chart.
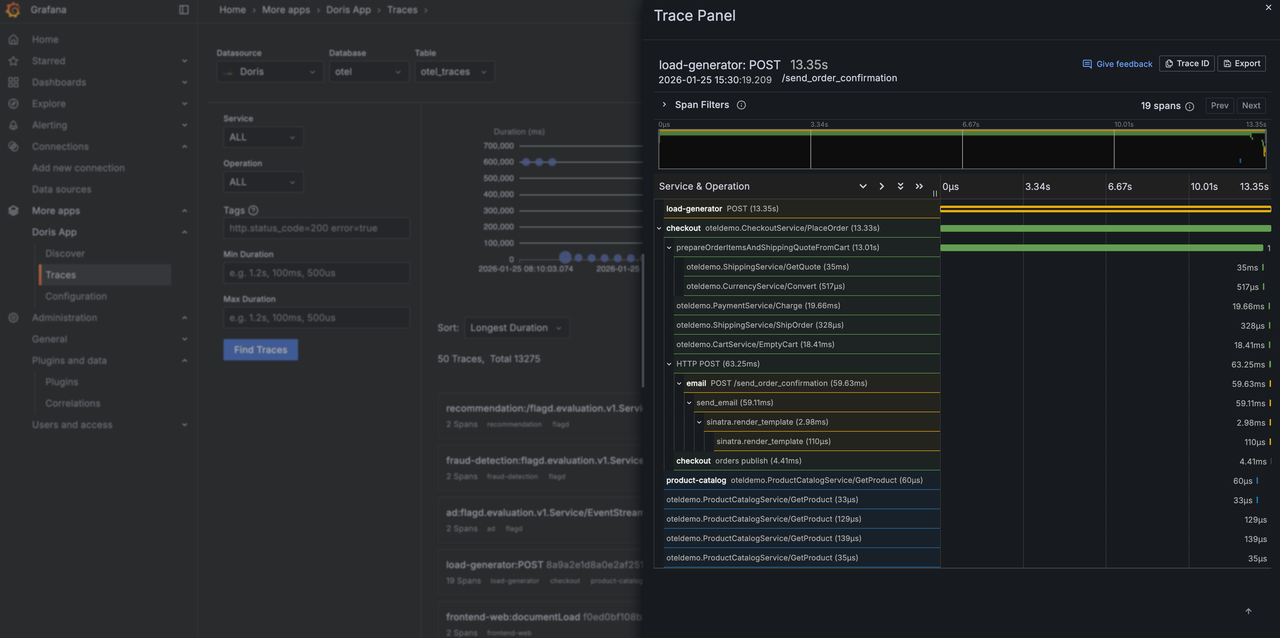
Click a specific trace to view its waterfall visualization. Inside the waterfall view, use the Span Filter to further filter spans within the trace.
Dashboards
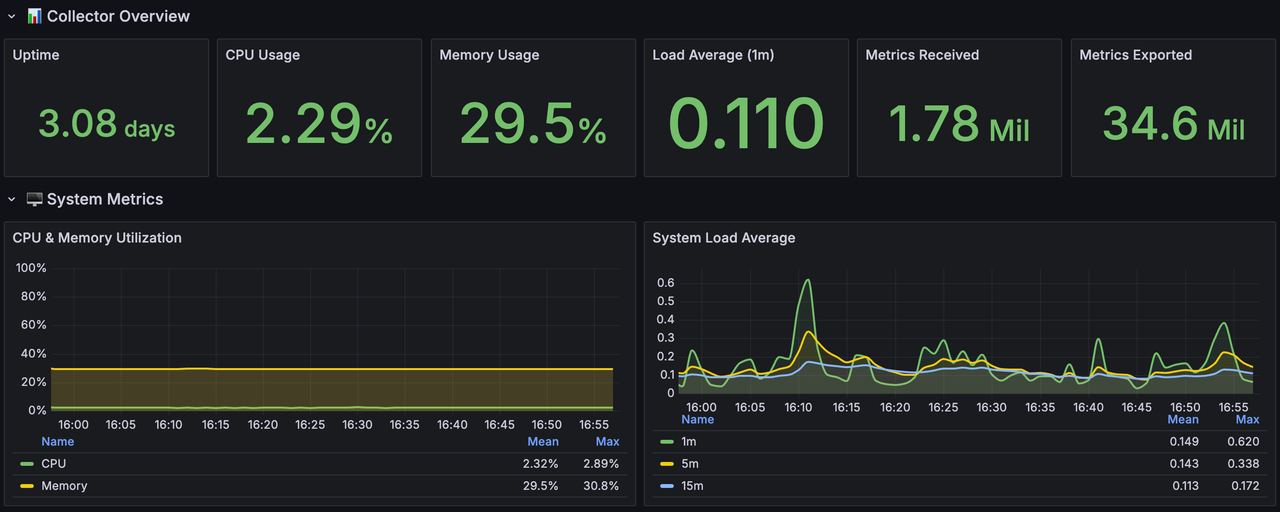
Click Dashboards in the left-side menu, then click Doris Demo, and finally click Collector Self-Monitoring. You will see the demo dashboard below, which shows host metrics of the OpenTelemetry Collector itself.
Alerting
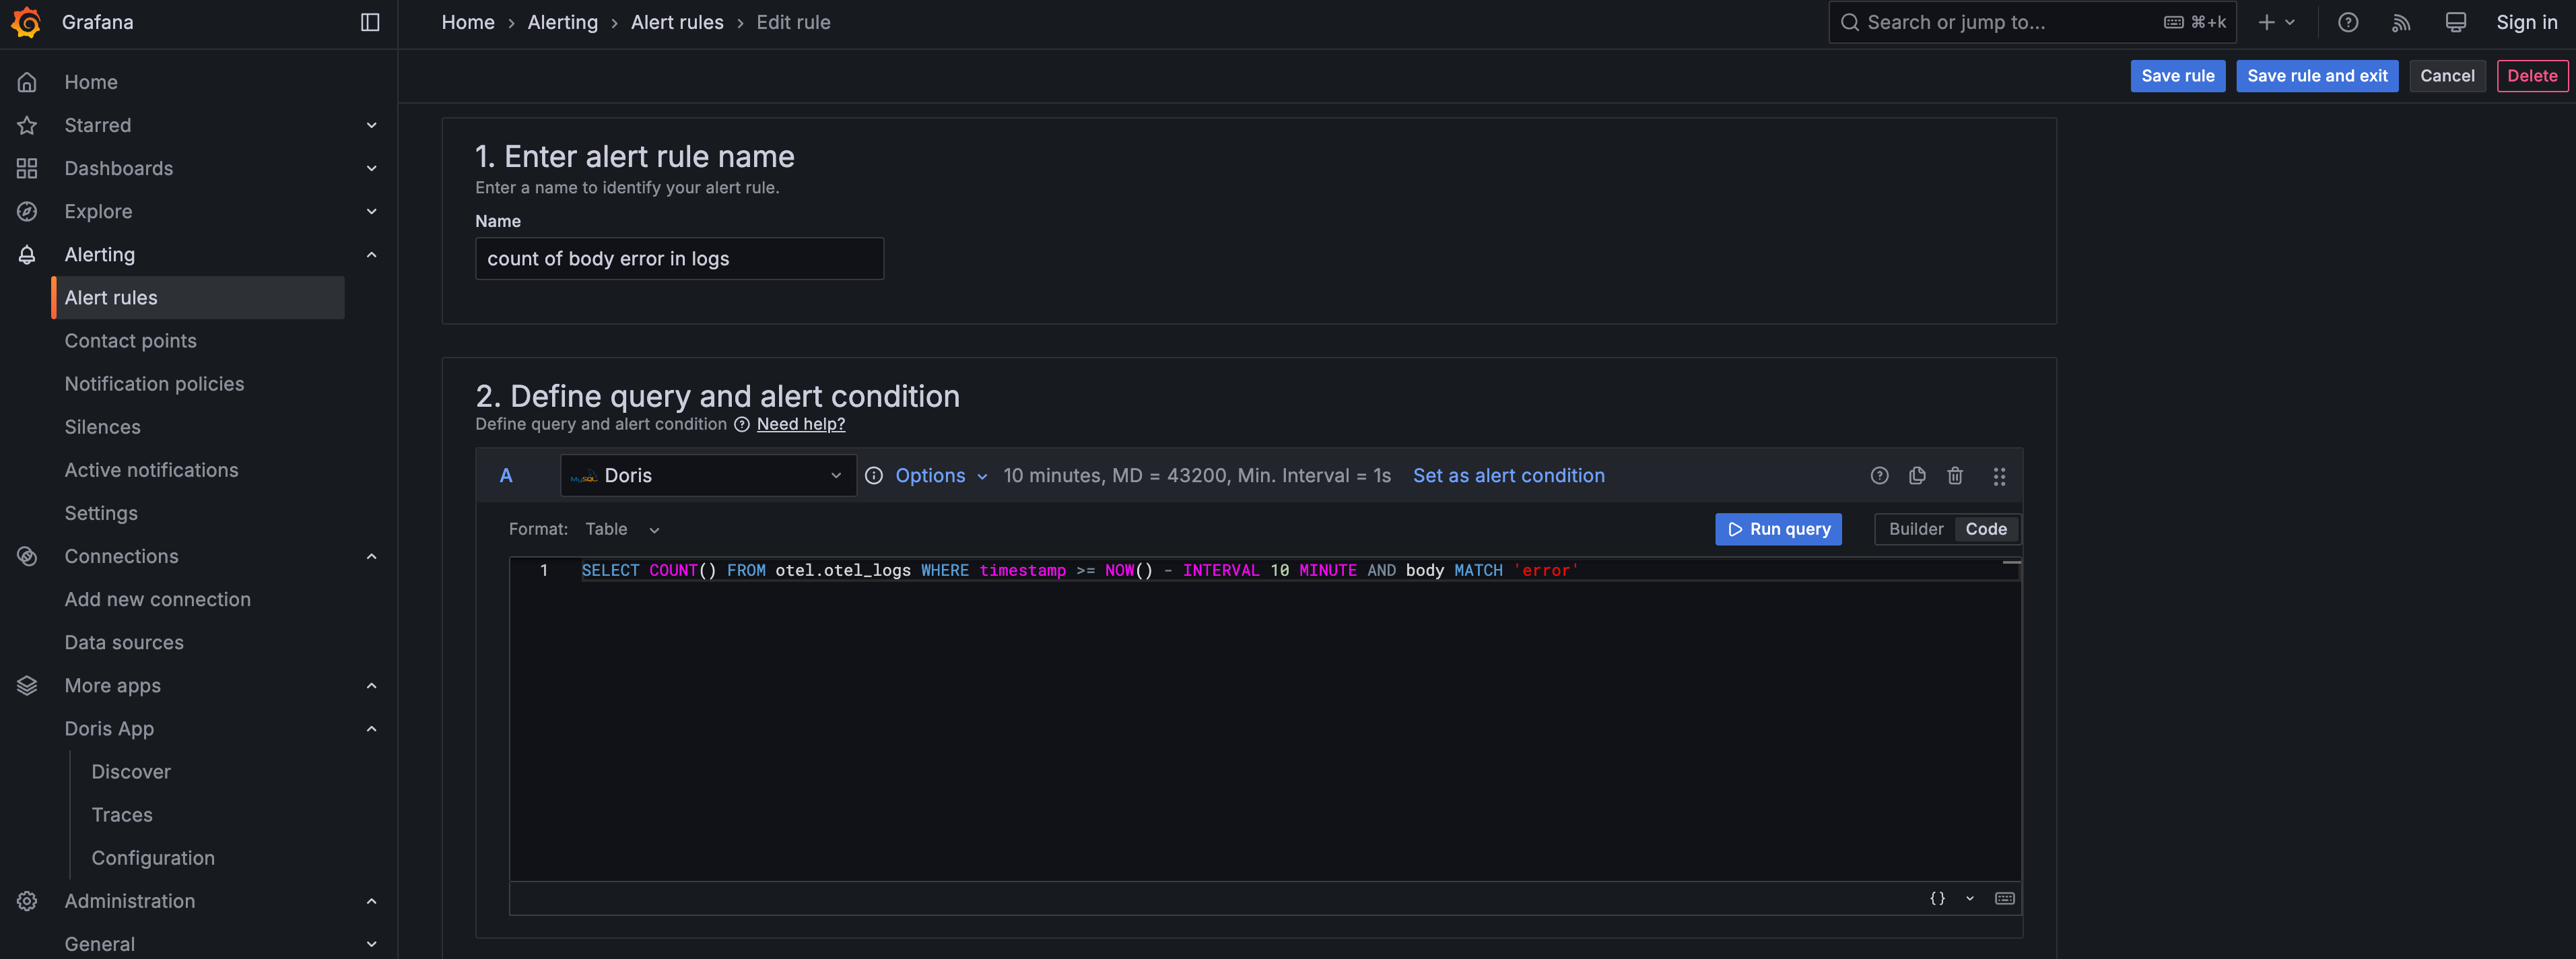
You can create alert rules based on SQL queries against Doris. Specify the alert condition parameters such as the Reduce function and the Threshold.