| # opentelemetry Plugin Example |
| |
| This plugin |
| embraces [OpenTelemetry Autoconfiguration](https://github.com/open-telemetry/opentelemetry-java/tree/main/sdk-extensions/autoconfigure) |
| using environment-based properties to configure OpenTelemetry SDK. |
| |
| ## Run OpenTelemetry Plugin Example |
| |
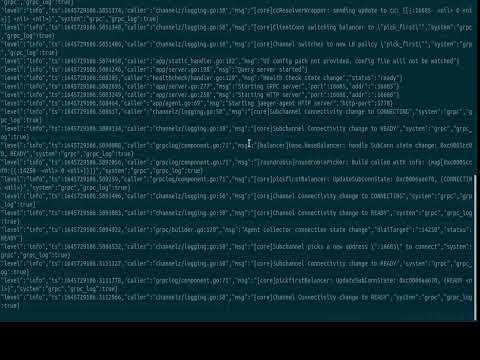
| [](https://www.youtube.com/watch?v=MVGx7QrztZQ) |
| |
| If you have not already done so, [prepare the broker distribution](../../../../README.md#getting-started) before running the example. |
| |
| To run the example, simply type **mvn verify** from this directory, or **mvn -PnoServer verify** if you want to start |
| and create the broker manually. |
| > **_NOTE:_** You must have [jeager](https://github.com/open-telemetry/opentelemetry-java/tree/main/sdk-extensions/autoconfigure#jaeger-exporter) running at `http://localhost:16686`. You can learn more about Jeager [here](https://www.jaegertracing.io/) |
| |
| > command to start your jeager instance `docker run -p 16686:16686 -p 14250:14250 jaegertracing/all-in-one:<your_version>` |
| |
| After seeing a **`Build Success`**, open the browser, connect to your Jeager running instance and check for spans. |
| |
| ## Customise OpenTelemetry Plugin Example |
| |
| The [`tracing.properties`](./src/main/resources/tracing.properties) has configuration properties that |
| autoconfigure [Opentelemetry Exporter](https://github.com/open-telemetry/opentelemetry-java/tree/main/sdk-extensions/autoconfigure#exporters) |
| . We reconfigured it and used Jeager as the default exporter, sending data through at `http://localhost:14250` |
| You can change this by choosing to use: |
| |
| - [otlp exporter](https://github.com/open-telemetry/opentelemetry-java/tree/1e073fcff20697fd5f2eb39bd6246d06a1231089/sdk-extensions/autoconfigure#otlp-exporter-both-span-and-metric-exporters) |
| , by uncommenting (removing `#`) the following |
| - otlp enabler: `otel.traces.exporter=otlp` |
| - otlp endpoint: `otel.exporter.otlp.endpoint=http://localhost:4317` Change port and host to match your running |
| instance. |
| - otlp traces-endpoint: `otel.exporter.otlp.traces.endpoint=http://localhost:4317` Change port and host to match |
| your running instance. |
| |
| |
| - [Zipkin Exporter](https://github.com/open-telemetry/opentelemetry-java/tree/main/sdk-extensions/autoconfigure#zipkin-exporter) |
| , by uncommenting (removing `#`) the following |
| - Zipkin enabler: `otel.traces.exporter=zipkin` |
| - Zipkin endpoint: `otel.exporter.zipkin.endpoint=http://localhost:9411/api/v2/spans`. Change port and host to match your |
| running instance. |
| > **Note:** command to start Zipkin instance `docker run -p 9411:9411 openzipkin/zipkin` |
| |
| |
| You can also change the default service name from `opentelemetry_plugin` to any string by changing the value |
| of `otel.service.name` |
| |
| ## How to start exporters |
| - [Zipkin](https://zipkin.io/pages/quickstart): The quickest way is by use of docker. |
| - Open the terminal, copy, paste and run the command `docker run -d -p 9411:9411 openzipkin/zipkin` |
| - open the browser, enter the url `http://localhost:9411` and on the page that appears, click the **Run Queries** button. |
| |
| |
| - [Jeager](https://www.jaegertracing.io/docs/1.30/getting-started/): The quickest way is by use of docker. |
| - open the terminal and paste the command below |
| ``` |
| docker run -d --name jaeger \ |
| e COLLECTOR_ZIPKIN_HOST_PORT=:9411 \ |
| p 5775:5775/udp \ |
| p 6831:6831/udp \ |
| p 6832:6832/udp \ |
| p 5778:5778 \ |
| p 16686:16686 \ |
| p 14250:14250 \ |
| p 14268:14268 \ |
| p 14269:14269 \ |
| p 9411:9411 \ |
| jaegertracing/all-in-one:1.30 |
| ``` |
| - open the browser, enter the url `http://localhost:16686/search`, click **Search**, select your service-name from the dropdown below the service name and finally click **Find Traces** Button. |