UI Introduction
SkyWalking official UI provides the default and powerful visualization capabilities for SkyWalking observing distributed cluster.
The latest introduction video could be found on the Youtube
SkyWalking dashboard includes the following part.
- Feature Tab Selector Zone. The key features are list there. The more details will be introduced below.
- Reload Zone. Control the reload mechanism, including reload periodically or manually.
- Time Selector Zone. Control the timezone and time range. And a Chinese/English switch button here, default, the UI uses the browser language setting. We also welcome to contribute more languages.
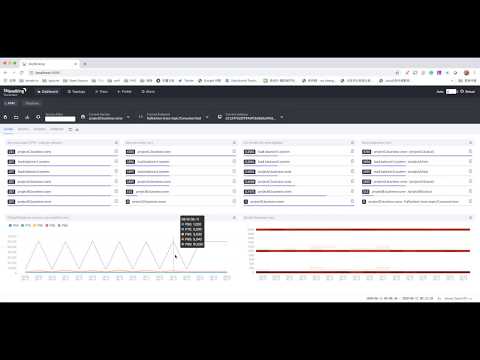
Dashboard
Dashboard provide metrics of service, service instance and endpoint. There are a few metrics terms you need to understand
- Throughput CPM , represents calls per minute.
- Apdex score, Read Apdex in WIKI
- Response Time Percentile, including
p99,p95,p90,p75,p50. Read percentile in WIKI - SLA, represents the successful rate. For HTTP, it means the rate of 200 response code.
Service, Instance and Dashboard selector could reload manually rather than reload the whole page. NOTICE, the Reload Zone wouldn't reload these selectors.
Two default dashboards are provided to visualize the metrics of service and database.
User could click the lock button left aside the Service/Instance/Endpoint Reload button to custom your own dashboard.
Custom Dashboard
Users could customize the dashboard. The default dashboards are provided through the default templates located in /ui-initialized-templates folders.
The template file follows this format.
templates:
  - name: template name # The unique name
    # The type includes DASHBOARD, TOPOLOGY_INSTANCE, TOPOLOGY_ENDPOINT.
    # DASHBOARD type templates could have multiple definitions, by using different names.
    # TOPOLOGY_INSTANCE, TOPOLOGY_ENDPOINT type templates should be defined once,
    # as they are used in the topology page only.
    type: "DASHBOARD"
    # Custom the dashboard or create a new one on the UI, set the metrics as you like in the edit mode.
    # Then, you could export this configuration through the page and add it here.
    configuration: |-
      [
        {
          "name":"Spring Sleuth",
          "type":"service",
          "children":[
            {
              "name":"Sleuth",
              "children": [{
                "width": "3",
                "title": "HTTP Request",
                "height": "200",
                "entityType": "ServiceInstance",
                "independentSelector": false,
                "metricType": "REGULAR_VALUE",
                "metricName": "meter_http_server_requests_count",
                "queryMetricType": "readMetricsValues",
                "chartType": "ChartLine",
                "unit": "Count"
              }
              ...
              ]
            }
          ]
      }
      ]
    # Activated means this templates added into the UI page automatically.
    # False means providing a basic template, user needs to add it manually on the page.
    activated: false
    # True means wouldn't show up on the dashboard. Only keeps the definition in the storage.
    disabled: false
NOTE, UI initialized templates would only be initialized if there is no template in the storage has the same name. Check the entity named as ui_template in your storage.
Topology
Topology map shows the relationship among the services and instances with metrics.
- Topology shows the default global topology including all services.
- Service Selector provides 2 level selectors, service group list and service name list. The group name is separated from the service name if it follows
<group name>::<logic name>format. Topology map is available for single group, single service, or global(include all services). - Custom Group provides the any sub topology capability of service group.
- Service Deep Dive opens when you click any service. The honeycomb could do metrics, trace and alarm query of the selected service.
- Service Relationship Metrics gives the metrics of service RPC interactions and instances of these two services.
Trace Query
Trace query is a typical feature as SkyWalking provided distributed agents.
- Trace Segment List is not the trace list. Every trace has several segments belonging to different services. If
query by all services or by trace id, different segments with same trace id could be list there. - Span is clickable, the detail of each span will pop up on the left side.
- Trace Views provides 3 typical and different usage views to visualize the trace.
Profile
Profile is an interaction feature. It provides the method level performance diagnosis.
To start the profile analysis, user need to create the profile task
- Select the specific service.
- Set the endpoint name. This endpoint name typically is the operation name of the first span. Find this on the trace segment list view.
- Monitor time could start right now or from any given future time.
- Monitor duration defines the observation time window to find the suitable request to do performance analysis. Even the profile add a very limited performance impact to the target system, but it is still an additional load. This duration make the impact controllable.
- Min duration threshold provides a filter mechanism, if a request of the given endpoint response quickly, it wouldn't be profiled. This could make sure, the profiled data is the expected one.
- Max sampling count gives the max dataset of agent will collect. It helps to reduce the memory and network load.
- One implicit condition, in any moment, SkyWalking only accept one profile task for each service.
- Agent could have different settings to control or limit this feature, read document setup for more details.
- Not all SkyWalking ecosystem agent supports this feature, java agent from 7.0.0 supports this in default.
Once the profile done, the profiled trace segments would show up. And you could request for analysis for any span. Typically, we analysis spans having long self duration, if the span and its children both have long duration, you could choose include children or exclude childrend to set the analysis boundaries.
After choose the right span, and click the analysis button, you will see the stack based analysis result. The slowest methods have been highlighted.
Advanced features
- Since 7.1.0, the profiled trace collects the HTTP request parameters for Tomcat and SpringMVC Controller automatically.
Log
Since 8.3.0, SkyWalking provides log query for the browser monitoring. Use Apache SkyWalking Client JS agent would collect metrics and error logs.
Alarm
Alarm page lists all triggered alarm. Read the backend setup documentation to know how to set up the alarm rule or integrate with 3rd party system.