sidebar_position: 9 title: Monitor Plugin keywords: [“monitor”] description: monitor plugin
Explanation
- Monitor plugin is used to monitor its own running status(JVM-related) by gateway, include request response delay, QPS, TPS, and other related metrics.
Technical Solutions
Flow Diagram
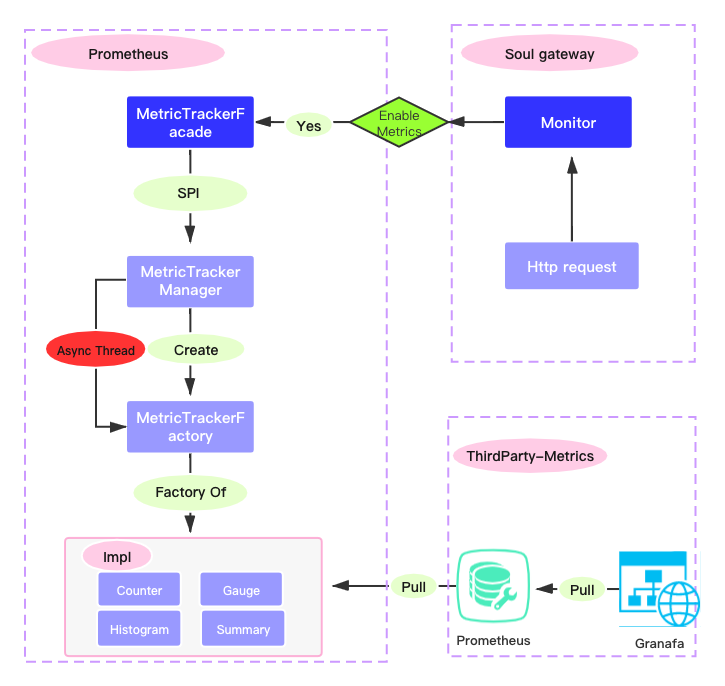
Make even tracking in soul gateway by asynchronous or synchronous mode.
The
prometheusserver pulls metrics' through http request, and then displays it byGrafana.
Plugin Setting
- In
soul-admin--> plugin management-> monitor, set to enable. - Add the following configuration in the monitor plugin.
{"metricsName":"prometheus","host":"localhost","port":"9191","async":"true"}

# port : Pulled ports for exposing to prometheus service.
# host : If not filled in, it is the host of soul Gateway.
# async :"true" is asynchronous event tracking, false is synchronous event tracking.
- If the user don't use, please disable the plugin in the background.
- Introduce
monitordependency in the pom.xml file of the gateway.
  <!-- soul monitor plugin start-->
  <dependency>
      <groupId>org.dromara</groupId>
      <artifactId>soul-spring-boot-starter-plugin-monitor</artifactId>
      <version>${last.version}</version>
  </dependency>
  <!-- soul monitor plugin end-->
- Selectors and rules, please refer to: selector.
- Only when the url is matched, the url will request event tracking.
Metrics Detail
All JVM,thread,memory,and other related infomation will be made event tracking,you can add a JVM module in the Granfana' panel, and it will be fully displayed, please refer to: https://github.com/prometheus/jmx_exporter
There are also the following custom
metrics
| Name | type | target | description |
|---|---|---|---|
| request_total | Counter | none | collecting all requests of Soul Gateway |
| http_request_total | Counter | path,type | collecting all matched requests of monitor |
Collect metrics
Users need to install Prometheus service to collect
- Choose the corresponding environment download address to install
- Modify configuration file:
prometheus.yml
scrape_configs:
  # The job name is added as a label `job=<job_name>` to any timeseries scraped from this config.
  - job_name: 'prometheus'
    # metrics_path defaults to '/metrics'
    # scheme defaults to 'http'.
    static_configs:
    - targets: ['localhost:9190']
Note: The job_name corresponds to the metricsName of the monitor plug-in configuration
- After the configuration is completed, you can directly double-click
prometheus.exein the window to start. The default boot port is9090, Success can be verified at http://localhost:9090/
Panel Display
It is recommended to use Grafana, Users can customize the query to personalize the display panel.
Here's how to install and deploy Grafana for Windows
- Install Grafana
download Unzip it and enter the bin directory and double-click grafana-server.exe to run it. Go to http://localhost:3000/?orgId=1 admin/admin to verify the success
- Config Prometheus DataSource

- Config JVM Dashboard
Click Create - Import and enter the dashboards ID (8563 recommended).
The final JVM monitor panel looks like this:
- Config Custom Metric Dashboard
request_total、http_request_total
Click Create - Import and enter the panel config json
The final custom HTTP request monitoring panel looks like this: