OpenWhisk User Events
This service connects to events topic and publishes the events to various services like Prometheus, Datadog etc via Kamon. Refer to user specific metrics on how to enable them.
Local Run
First configure and run
openwhisk docker-composethat can be found in the openwhisk-tools project.
- Start service inside the cluster (on the same docker-compose network:
openwhisk_default) - The service will be available on port
9095 - The endpoint for exposing the metrics for Prometheus can be found on
/metrics.
Usage
The service needs the following env variables to be set
KAFKA_HOSTS- For local env it can be set to172.17.0.1:9093. When using OpenWhisk Devtools based setup usekafka- Namespaces can be removed from reports by listing them inside the
reference.confusing thewhisk.user-events.ignored-namespacesconfiguration. e.g:
whisk {
  user-events {
    ignored-namespaces = ["canary","testing"]
  }
}
- To rename metrics tags, use the below configuration. Currently, this configuration only applies to the Prometheus Metrics. For example, here
namespacetag name will be replaced byow_namespacein all metrics.
whisk {
  user-events {
    rename-tags {
      # rename/relabel prometheus metrics tags
      "namespace" = "ow_namespae"
     }
  }
}
Integrations
Prometheus
The docker container would run the service and expose the metrics in format required by Prometheus at 9095 port
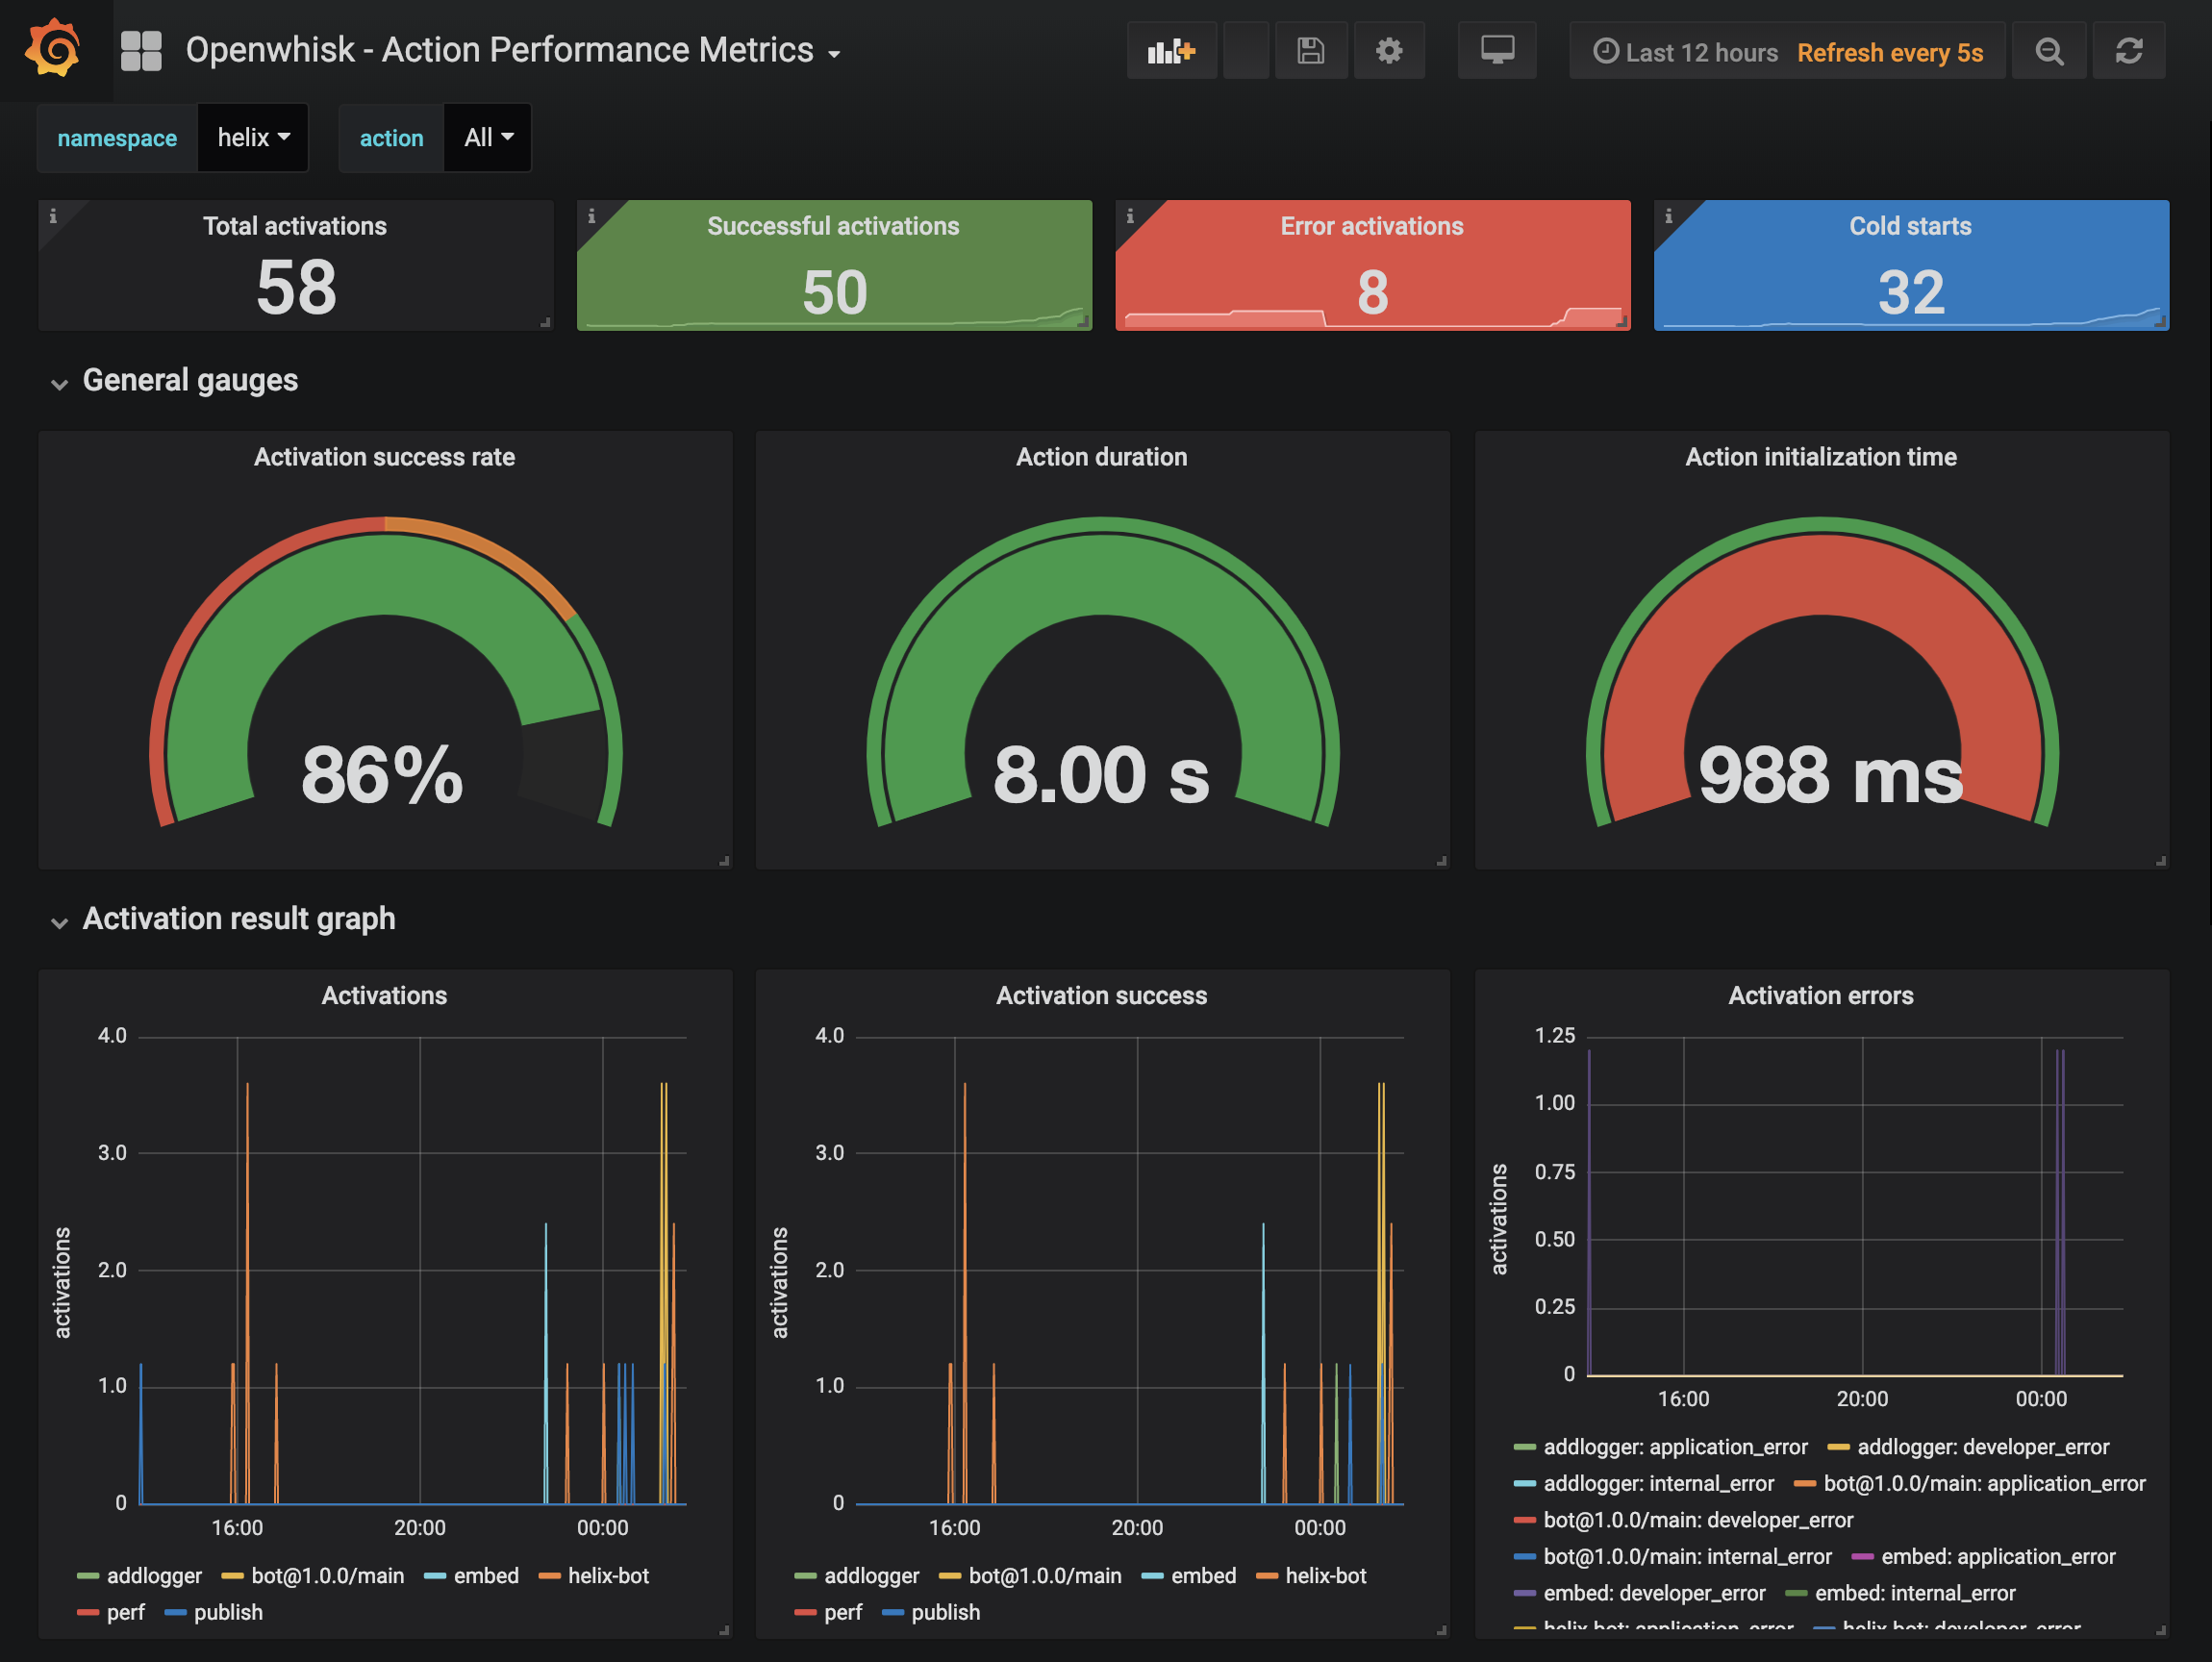
Grafana
The Openwhisk - Action Performance Metrics Grafana4 dashboard is available on localhost port 3000 at this address: http://localhost:3000/d/Oew1lvymk/openwhisk-action-performance-metrics
The latest version of the dashboard can be found in the “compose/dashboard/openwhisk_events.json”