title: How to step into source in the Visual Studio debugger uid: source-stepping summary: *content
Debuggers can step into the source code, set breakpoints, watch variables, etc. It‘s easy to drop into Lucene.NET code any time you want to understand what’s going on.
If you‘re getting ready to report a bug in Lucene.NET, figuring out how to create a minimal repro is much easier since you aren’t dealing with a black box!
[!NOTE] This feature is enabled using Source Link, which also has support for source stepping in Visual Studio Code.
As Source Link downloads files from the internet, Visual Studio has it disabled by default. Enabling it requires changing a few of the Visual Studio settings:
Go to Tools > Options > Debugging > Symbols and ensure that the
NuGet.org Symbol Serveroption is checked. It may also be a good idea to specify a cache directory once you have Source Link set up so Visual Studio won't need to repeatedly download the same source files each time you step into them.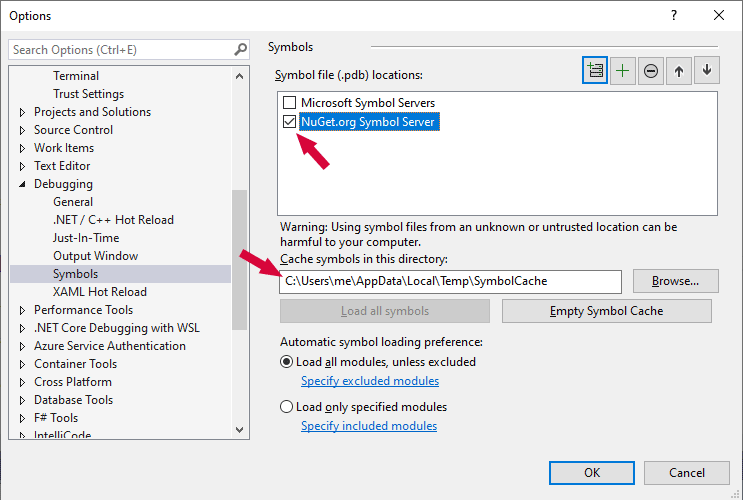
[!NOTE] If you are on .NET Framework, you'll also need to check the
Microsoft Symbol Serversoption.Disable
Just My Codein Tools > Options > Debugging > General to allow Visual Studio to debug code outside of your solution. Also, verify thatEnable Source Link supportis enabled.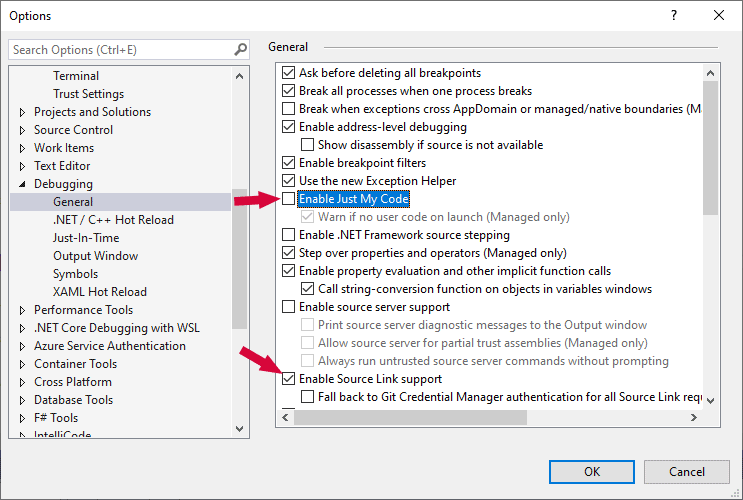
[!NOTE] If you are on .NET Framework, you'll also need to check
Enable .NET Framework source stepping.
Verifying Source Link
To confirm Source Link is working, set a breakpoint before or on a line of code that calls a Lucene.NET type and start debugging the application.
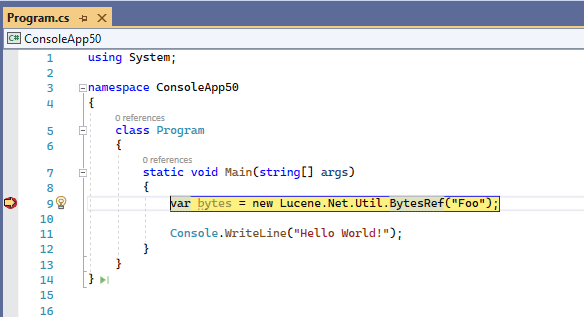
Step into the code, just as you would for any local method (F11 is the default keyboard shortcut). If all is configured correctly, you will be prompted to download the source code file for the type you are stepping into. Click on either
Download Source and Continue Debuggingoption to continue.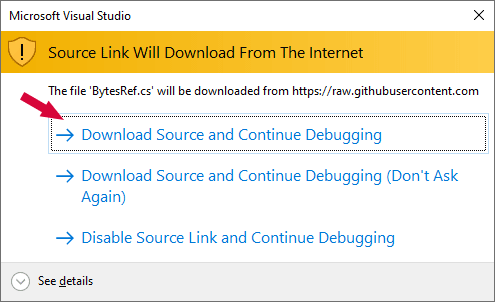
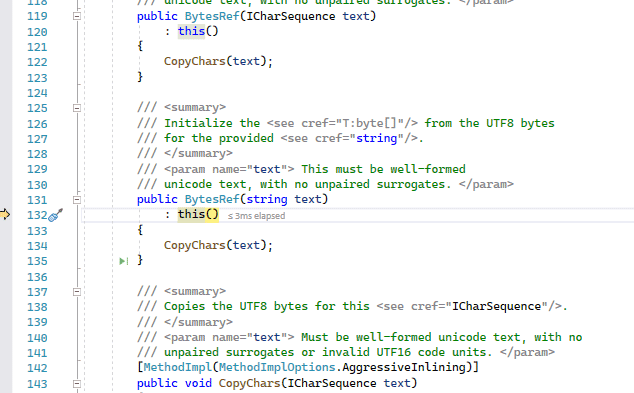
After a short pause, The debugger will step into the next line after your breakpoint inside the Lucene.NET source code.
Congratulations! You can now step into Lucene.NET code to figure stuff out and to help put together a thorough bug report or PR.