| <!-- |
| |
| Licensed to the Apache Software Foundation (ASF) under one |
| or more contributor license agreements. See the NOTICE file |
| distributed with this work for additional information |
| regarding copyright ownership. The ASF licenses this file |
| to you under the Apache License, Version 2.0 (the |
| "License"); you may not use this file except in compliance |
| with the License. You may obtain a copy of the License at |
| |
| http://www.apache.org/licenses/LICENSE-2.0 |
| |
| Unless required by applicable law or agreed to in writing, |
| software distributed under the License is distributed on an |
| "AS IS" BASIS, WITHOUT WARRANTIES OR CONDITIONS OF ANY |
| KIND, either express or implied. See the License for the |
| specific language governing permissions and limitations |
| under the License. |
| |
| --> |
| |
| |
| # Prometheus |
| |
| ## 监控指标的 Prometheus 映射关系 |
| |
| > 对于 Metric Name 为 name, Tags 为 K1=V1, ..., Kn=Vn 的监控指标有如下映射,其中 value 为具体值 |
| |
| | 监控指标类型 | 映射关系 | |
| | ---------------- |-------------------------------------------------------------------------------------------------------------------------------------------------------------------------------------------------------------------------------------------------------------------------------------------------------------------------------------------------------------------------------------------------------------------------------------------------------------------------------------------------------------------------------------------------------------------------------------------------------------| |
| | Counter | name_total{cluster="clusterName", nodeType="nodeType", nodeId="nodeId",k1="V1" , ..., Kn="Vn"} value | |
| | AutoGauge、Gauge | name{cluster="clusterName", nodeType="nodeType", nodeId="nodeId",k1="V1" , ..., Kn="Vn"} value | |
| | Histogram | name_max{cluster="clusterName", nodeType="nodeType", nodeId="nodeId",k1="V1" , ..., Kn="Vn"} value <br> name_sum{cluster="clusterName", nodeType="nodeType", nodeId="nodeId",k1="V1" , ..., Kn="Vn"} value <br> name_count{cluster="clusterName", nodeType="nodeType", nodeId="nodeId",k1="V1" , ..., Kn="Vn"} value <br> name{cluster="clusterName", nodeType="nodeType", nodeId="nodeId",k1="V1" , ..., Kn="Vn", quantile="0.5"} value <br> name{cluster="clusterName", nodeType="nodeType", nodeId="nodeId",k1="V1" , ..., Kn="Vn", quantile="0.99"} value | |
| | Rate | name_total{cluster="clusterName", nodeType="nodeType", nodeId="nodeId",k1="V1" , ..., Kn="Vn"} value <br> name_total{cluster="clusterName", nodeType="nodeType", nodeId="nodeId",k1="V1" , ..., Kn="Vn", rate="m1"} value <br> name_total{cluster="clusterName", nodeType="nodeType", nodeId="nodeId",k1="V1" , ..., Kn="Vn", rate="m5"} value <br> name_total{cluster="clusterName", nodeType="nodeType", nodeId="nodeId",k1="V1" , ..., Kn="Vn", rate="m15"} value <br> name_total{cluster="clusterName", nodeType="nodeType", nodeId="nodeId",k1="V1" , ..., Kn="Vn", rate="mean"} value | |
| | Timer | name_seconds_max{cluster="clusterName", nodeType="nodeType", nodeId="nodeId",k1="V1" , ..., Kn="Vn"} value <br> name_seconds_sum{cluster="clusterName", nodeType="nodeType", nodeId="nodeId",k1="V1" , ..., Kn="Vn"} value <br> name_seconds_count{cluster="clusterName", nodeType="nodeType", nodeId="nodeId",k1="V1" , ..., Kn="Vn"} value <br> name_seconds{cluster="clusterName", nodeType="nodeType", nodeId="nodeId",k1="V1" , ..., Kn="Vn", quantile="0.5"} value value <br> name_seconds{cluster="clusterName", nodeType="nodeType", nodeId="nodeId",k1="V1" , ..., Kn="Vn", quantile="0.99"} value | |
| |
| ## 修改配置文件 |
| |
| 1) 以 DataNode 为例,修改 iotdb-datanode.properties 配置文件如下: |
| |
| ```properties |
| dn_metric_reporter_list=PROMETHEUS |
| dn_metric_level=CORE |
| dn_metric_prometheus_reporter_port=9091 |
| ``` |
| |
| 2) 启动 IoTDB DataNode |
| |
| 3) 打开浏览器或者用```curl``` 访问 ```http://servier_ip:9091/metrics```, 就能得到如下 metric 数据: |
| |
| ``` |
| ... |
| # HELP file_count |
| # TYPE file_count gauge |
| file_count{name="wal",} 0.0 |
| file_count{name="unseq",} 0.0 |
| file_count{name="seq",} 2.0 |
| ... |
| ``` |
| |
| ## Prometheus + Grafana |
| |
| 如上所示,IoTDB 对外暴露出标准的 Prometheus 格式的监控指标数据,可以使用 Prometheus 采集并存储监控指标,使用 Grafana |
| 可视化监控指标。 |
| |
| IoTDB、Prometheus、Grafana三者的关系如下图所示: |
| |
| 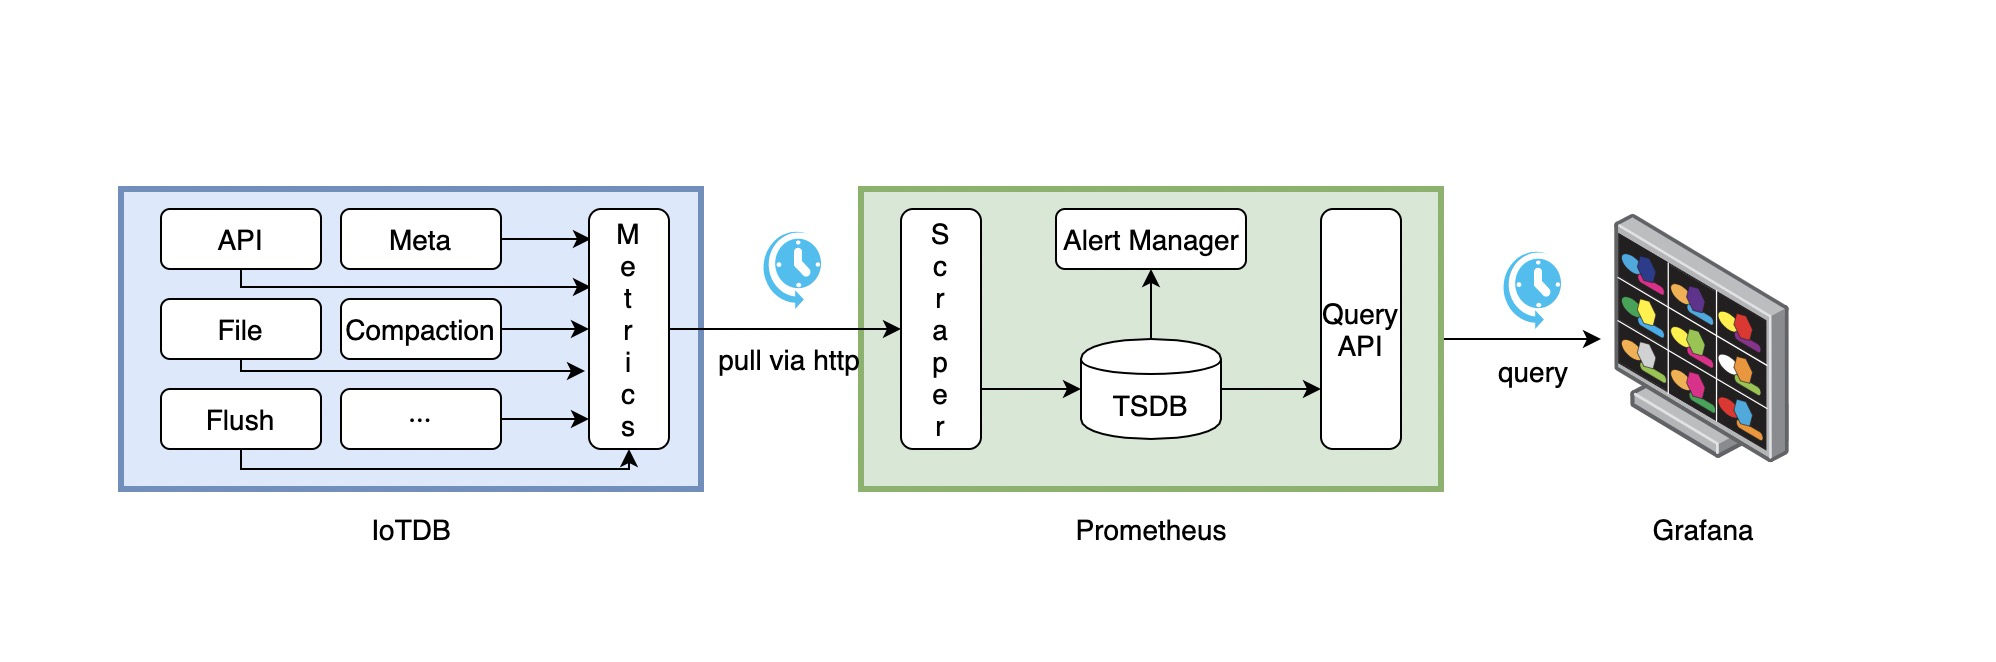 |
| |
| 1. IoTDB在运行过程中持续收集监控指标数据。 |
| 2. Prometheus以固定的间隔(可配置)从IoTDB的HTTP接口拉取监控指标数据。 |
| 3. Prometheus将拉取到的监控指标数据存储到自己的TSDB中。 |
| 4. Grafana以固定的间隔(可配置)从Prometheus查询监控指标数据并绘图展示。 |
| |
| 从交互流程可以看出,我们需要做一些额外的工作来部署和配置Prometheus和Grafana。 |
| |
| 比如,你可以对Prometheus进行如下的配置(部分参数可以自行调整)来从IoTDB获取监控数据 |
| |
| ```yaml |
| job_name: pull-metrics |
| honor_labels: true |
| honor_timestamps: true |
| scrape_interval: 15s |
| scrape_timeout: 10s |
| metrics_path: /metrics |
| scheme: http |
| follow_redirects: true |
| static_configs: |
| - targets: |
| - localhost:9091 |
| ``` |
| |
| 更多细节可以参考下面的文档: |
| |
| [Prometheus安装使用文档](https://prometheus.io/docs/prometheus/latest/getting_started/) |
| |
| [Prometheus从HTTP接口拉取metrics数据的配置说明](https://prometheus.io/docs/prometheus/latest/configuration/configuration/#scrape_config) |
| |
| [Grafana安装使用文档](https://grafana.com/docs/grafana/latest/getting-started/getting-started/) |
| |
| [Grafana从Prometheus查询数据并绘图的文档](https://prometheus.io/docs/visualization/grafana/#grafana-support-for-prometheus) |
| |
| ## Apache IoTDB Dashboard |
| |
| 我们提供了Apache IoTDB Dashboard,在Grafana中显示的效果图如下所示: |
| |
|  |
| |
| 你可以在企业版中获取到 Dashboard 的 Json文件。 |