| <!-- |
| |
| Licensed to the Apache Software Foundation (ASF) under one |
| or more contributor license agreements. See the NOTICE file |
| distributed with this work for additional information |
| regarding copyright ownership. The ASF licenses this file |
| to you under the Apache License, Version 2.0 (the |
| "License"); you may not use this file except in compliance |
| with the License. You may obtain a copy of the License at |
| |
| http://www.apache.org/licenses/LICENSE-2.0 |
| |
| Unless required by applicable law or agreed to in writing, |
| software distributed under the License is distributed on an |
| "AS IS" BASIS, WITHOUT WARRANTIES OR CONDITIONS OF ANY |
| KIND, either express or implied. See the License for the |
| specific language governing permissions and limitations |
| under the License. |
| |
| --> |
| |
| Along with IoTDB running, we hope to observe the status of IoTDB, so as to troubleshoot system problems or discover |
| potential system risks in time. A series of metrics that can **reflect the operating status of the system** are system |
| monitoring metrics. |
| |
| ## 1. When to use metric framework? |
| |
| Belows are some typical application scenarios |
| |
| 1. System is running slowly |
| |
| When system is running slowly, we always hope to have information about system's running status as detail as |
| possible, such as: |
| |
| - JVM:Is there FGC? How long does it cost? How much does the memory usage decreased after GC? Are there lots of |
| threads? |
| - System:Is the CPU usage too hi?Are there many disk IOs? |
| - Connections:How many connections are there in the current time? |
| - Interface:What is the TPS and latency of every interface? |
| - Thread Pool:Are there many pending tasks? |
| - Cache Hit Ratio |
| |
| 2. No space left on device |
| |
| When meet a "no space left on device" error, we really want to know which kind of data file had a rapid rise in the |
| past hours. |
| |
| 3. Is the system running in abnormal status |
| |
| We could use the count of error logs、the alive status of nodes in cluster, etc, to determine whether the system is |
| running abnormally. |
| |
| ## 2. Who will use metric framework? |
| |
| Any person cares about the system's status, including but not limited to RD, QA, SRE, DBA, can use the metrics to work |
| more efficiently. |
| |
| ## 3. What is metrics? |
| |
| ### 3.1. Key Concept |
| |
| In IoTDB's metric module, each metrics is uniquely identified by `Metric Name` and `Tags`. |
| |
| - `Metric Name`: Metric type name, such as `logback_events` means log events. |
| - `Tags`: indicator classification, in the form of Key-Value pairs, each indicator can have 0 or more categories, common |
| Key-Value pairs: |
| - `name = xxx`: The name of the monitored object, which is the description of **business logic**. For example, for a |
| monitoring item of type `Metric Name = entry_seconds_count`, the meaning of name refers to the monitored business |
| interface. |
| - `type = xxx`: Monitoring indicator type subdivision, which is a description of **monitoring indicator** itself. |
| For example, for monitoring items of type `Metric Name = point`, the meaning of type refers to the specific type |
| of monitoring points. |
| - `status = xxx`: The status of the monitored object is a description of **business logic**. For example, for |
| monitoring items of type `Metric Name = Task`, this parameter can be used to distinguish the status of the |
| monitored object. |
| - `user = xxx`: The relevant user of the monitored object is a description of **business logic**. For example, count |
| the total points written by the `root` user. |
| - Customize according to the specific situation: For example, there is a level classification under |
| logback_events_total, which is used to indicate the number of logs under a specific level. |
| - `Metric Level`: The level of metric managing level, The default startup level is `Core` level, the recommended startup |
| level is `Important level`, and the audit strictness is `Core > Important > Normal > All` |
| - `Core`: Core metrics of the system, used by the **operation and maintenance personnel**, which is related to the * |
| *performance, stability, and security** of the system, such as the status of the instance, the load of the system, |
| etc. |
| - `Important`: Important metrics of the module, which is used by **operation and maintenance and testers**, and is |
| directly related to **the running status of each module**, such as the number of merged files, execution status, |
| etc. |
| - `Normal`: Normal metrics of the module, used by **developers** to facilitate **locating the module** when problems |
| occur, such as specific key operation situations in the merger. |
| - `All`: All metrics of the module, used by **module developers**, often used when the problem is reproduced, so as |
| to solve the problem quickly. |
| |
| ### 3.2. External data format for metrics |
| |
| - IoTDB provides metrics in JMX, Prometheus and IoTDB formats: |
| - For JMX, metrics can be obtained through ```org.apache.iotdb.metrics```. |
| - For Prometheus, the value of the metrics can be obtained through the externally exposed port |
| - External exposure in IoTDB mode: metrics can be obtained by executing IoTDB queries |
| |
| ## 4. The detail of metrics |
| |
| Currently, IoTDB provides metrics for some main modules externally, and with the development of new functions and system |
| optimization or refactoring, metrics will be added and updated synchronously. |
| |
| If you want to add your own metrics data in IoTDB, please see |
| the [IoTDB Metric Framework] (https://github.com/apache/iotdb/tree/master/metrics) document. |
| |
| ### 4.1. Core level metrics |
| |
| Core-level metrics are enabled by default during system operation. The addition of each Core-level metrics needs to be |
| carefully evaluated. The current Core-level metrics are as follows: |
| |
| #### 4.1.1. Cluster |
| |
| | Metric | Tags | Type | Description | |
| | ------------------------- | ----------------------------------------------- | --------- | --------------------------------------------------- | |
| | config_node | name="total",status="Registered/Online/Unknown" | AutoGauge | The number of registered/online/unknown confignodes | |
| | data_node | name="total",status="Registered/Online/Unknown" | AutoGauge | The number of registered/online/unknown datanodes | |
| | cluster_node_leader_count | name="{ip}:{port}" | Gauge | The count of consensus group leader on each node | |
| | cluster_node_status | name="{ip}:{port}",type="ConfigNode/DataNode" | Gauge | The current node status, 0=Unkonwn 1=online | |
| | entry | name="{interface}" | Timer | The time consumed of thrift operations | |
| | mem | name="IoTConsensus" | AutoGauge | The memory usage of IoTConsensus, Unit: byte | |
| |
| #### 4.1.2. Interface |
| |
| | Metric | Tags | Type | Description | |
| | --------------------- | ---------------------------------- | --------- | -------------------------------------------------------------- | |
| | thrift_connections | name="ConfigNodeRPC" | AutoGauge | The number of thrift internal connections in ConfigNode | |
| | thrift_connections | name="InternalRPC" | AutoGauge | The number of thrift internal connections in DataNode | |
| | thrift_connections | name="MPPDataExchangeRPC" | AutoGauge | The number of thrift internal connections in MPP | |
| | thrift_connections | name="ClientRPC" | AutoGauge | The number of thrift connections of Client | |
| | thrift_active_threads | name="ConfigNodeRPC-Service" | AutoGauge | The number of thrift active internal connections in ConfigNode | |
| | thrift_active_threads | name="DataNodeInternalRPC-Service" | AutoGauge | The number of thrift active internal connections in DataNode | |
| | thrift_active_threads | name="MPPDataExchangeRPC-Service" | AutoGauge | The number of thrift active internal connections in MPP | |
| | thrift_active_threads | name="ClientRPC-Service" | AutoGauge | The number of thrift active connections of client | |
| | session_idle_time | name = "sessionId" | Histogram | The distribution of idle time of different sessions | |
| |
| #### 4.1.2. Node Statistics |
| | Metric | Tags | Type | Description | |
| | -------- | ----------------------------------- | --------- | ----------------------------------------- | |
| | quantity | name="database" | AutoGauge | The number of database | |
| | quantity | name="timeSeries" | AutoGauge | The number of timeseries | |
| | quantity | name="pointsIn" | Counter | The number of write points | |
| | points | database="{database}", type="flush" | Gauge | The point number of last flushed memtable | |
| |
| #### 4.1.3. Cluster Tracing |
| | Metric | Tags | Type | Description | |
| | ------------------------------------ | ------------------------------------------------ | ----- | ------------------------------------------------ | |
| | performance_overview | interface="{interface}", type="{statement_type}" | Timer | The time consumed of operations in client | |
| | performance_overview_detail | stage="authority" | Timer | The time consumed on authority authentication | |
| | performance_overview_detail | stage="parser" | Timer | The time consumed on parsing statement | |
| | performance_overview_detail | stage="analyzer" | Timer | The time consumed on analyzing statement | |
| | performance_overview_detail | stage="planner" | Timer | The time consumed on planning | |
| | performance_overview_detail | stage="scheduler" | Timer | The time consumed on scheduling | |
| | performance_overview_schedule_detail | stage="local_scheduler" | Timer | The time consumed on local scheduler | |
| | performance_overview_schedule_detail | stage="remote_scheduler" | Timer | The time consumed on remote scheduler | |
| | performance_overview_local_detail | stage="schema_validate" | Timer | The time consumed on schema validation | |
| | performance_overview_local_detail | stage="trigger" | Timer | The time consumed on trigger | |
| | performance_overview_local_detail | stage="storage" | Timer | The time consumed on consensus | |
| | performance_overview_storage_detail | stage="engine" | Timer | The time consumed on write stateMachine | |
| | performance_overview_engine_detail | stage="lock" | Timer | The time consumed on grabbing lock in DataRegion | |
| | performance_overview_engine_detail | stage="create_memtable_block" | Timer | The time consumed on creating new memtable | |
| | performance_overview_engine_detail | stage="memory_block" | Timer | The time consumed on insert memory control | |
| | performance_overview_engine_detail | stage="wal" | Timer | The time consumed on writing wal | |
| | performance_overview_engine_detail | stage="memtable" | Timer | The time consumed on writing memtable | |
| | performance_overview_engine_detail | stage="last_cache" | Timer | The time consumed on updating last cache | |
| |
| #### 4.1.5. Task Statistics |
| |
| | Metric | Tags | Type | Description | |
| | --------- | ------------------------------------------------- | --------- | ------------------------------------- | |
| | queue | name="compaction_inner", status="running/waiting" | Gauge | The number of inner compaction tasks | |
| | queue | name="compaction_cross", status="running/waiting" | Gauge | The number of cross compatcion tasks | |
| | queue | name="flush",status="running/waiting" | AutoGauge | The number of flush tasks | |
| | cost_task | name="inner_compaction/cross_compaction/flush" | Gauge | The time consumed of compaction tasks | |
| |
| #### 4.1.6. IoTDB process |
| |
| | Metric | Tags | Type | Description | |
| | ----------------- | -------------- | --------- | ------------------------------------------------------ | |
| | process_cpu_load | name="process" | AutoGauge | The current CPU usage of IoTDB process, Unit: % | |
| | process_cpu_time | name="process" | AutoGauge | The total CPU time occupied of IoTDB process, Unit: ns | |
| | process_max_mem | name="memory" | AutoGauge | The maximum available memory of IoTDB process | |
| | process_total_mem | name="memory" | AutoGauge | The current requested memory for IoTDB process | |
| | process_free_mem | name="memory" | AutoGauge | The free available memory of IoTDB process | |
| |
| #### 4.1.7. System |
| |
| | Metric | Tags | Type | Description | |
| | ------------------------------ | ------------- | --------- | ---------------------------------------------------------- | |
| | sys_cpu_load | name="system" | AutoGauge | The current CPU usage of system, Unit: % | |
| | sys_cpu_cores | name="system" | Gauge | The available number of CPU cores | |
| | sys_total_physical_memory_size | name="memory" | Gauge | The maximum physical memory of system | |
| | sys_free_physical_memory_size | name="memory" | AutoGauge | The current available memory of system | |
| | sys_total_swap_space_size | name="memory" | AutoGauge | The maximum swap space of system | |
| | sys_free_swap_space_size | name="memory" | AutoGauge | The available swap space of system | |
| | sys_committed_vm_size | name="memory" | AutoGauge | The space of virtual memory available to running processes | |
| | sys_disk_total_space | name="disk" | AutoGauge | The total disk space | |
| | sys_disk_free_space | name="disk" | AutoGauge | The available disk space | |
| |
| #### 4.1.8. Log |
| |
| | Metric | Tags | Type | Description | |
| | -------------- | ----------------------------------- | ------- | ------------------------ | |
| | logback_events | level="trace/debug/info/warn/error" | Counter | The number of log events | |
| |
| #### 4.1.9. File |
| |
| | Metric | Tags | Type | Description | |
| | ---------- | ------------------------- | --------- | --------------------------------------------------------------------------- | |
| | file_size | name="wal" | AutoGauge | The size of WAL file, Unit: byte | |
| | file_size | name="seq" | AutoGauge | The size of sequence TsFile, Unit: byte | |
| | file_size | name="unseq" | AutoGauge | The size of unsequence TsFile, Unit: byte | |
| | file_size | name="inner-seq-temp" | AutoGauge | The size of inner sequence space compaction temporal file | |
| | file_size | name="inner-unseq-temp" | AutoGauge | The size of inner unsequence space compaction temporal file | |
| | file_size | name="cross-temp" | AutoGauge | The size of cross space compaction temoporal file | |
| | file_size | name="mods | AutoGauge | The size of modification files | |
| | file_count | name="wal" | AutoGauge | The count of WAL file | |
| | file_count | name="seq" | AutoGauge | The count of sequence TsFile | |
| | file_count | name="unseq" | AutoGauge | The count of unsequence TsFile | |
| | file_count | name="inner-seq-temp" | AutoGauge | The count of inner sequence space compaction temporal file | |
| | file_count | name="inner-unseq-temp" | AutoGauge | The count of inner unsequence space compaction temporal file | |
| | file_count | name="cross-temp" | AutoGauge | The count of cross space compaction temporal file | |
| | file_count | name="open_file_handlers" | AutoGauge | The count of open files of the IoTDB process, only supports Linux and MacOS | |
| | file_count | name="mods | AutoGauge | The count of modification file | |
| |
| #### 4.1.10. JVM Memory |
| |
| | Metric | Tags | Type | Description | |
| | ------------------------------- | ------------------------------- | --------- | --------------------------- | |
| | jvm_buffer_memory_used_bytes | id="direct/mapped" | AutoGauge | The used size of buffer | |
| | jvm_buffer_total_capacity_bytes | id="direct/mapped" | AutoGauge | The max size of buffer | |
| | jvm_buffer_count_buffers | id="direct/mapped" | AutoGauge | The number of buffer | |
| | jvm_memory_committed_bytes | {area="heap/nonheap",id="xxx",} | AutoGauge | The committed memory of JVM | |
| | jvm_memory_max_bytes | {area="heap/nonheap",id="xxx",} | AutoGauge | The max memory of JVM | |
| | jvm_memory_used_bytes | {area="heap/nonheap",id="xxx",} | AutoGauge | The used memory of JVM | |
| |
| #### 4.1.11. JVM Thread |
| |
| | Metric | Tags | Type | Description | |
| | -------------------------- | ------------------------------------------------------------- | --------- | ---------------------------------------- | |
| | jvm_threads_live_threads | | AutoGauge | The number of live thread | |
| | jvm_threads_daemon_threads | | AutoGauge | The number of daemon thread | |
| | jvm_threads_peak_threads | | AutoGauge | The number of peak thread | |
| | jvm_threads_states_threads | state="runnable/blocked/waiting/timed-waiting/new/terminated" | AutoGauge | The number of thread in different states | |
| |
| #### 4.1.12. JVM GC |
| |
| | Metric | Tags | Type | Description | |
| | ----------------------------- | ----------------------------------------------------- | --------- | --------------------------------------------------------------------------- | |
| | jvm_gc_pause | action="end of major GC/end of minor GC",cause="xxxx" | Timer | The number and time consumed of Young GC/Full Gc caused by different reason | |
| | | |
| | jvm_gc_concurrent_phase_time | action="{action}",cause="{cause}" | Timer | The number and time consumed of Young GC/Full Gc caused by different | |
| | | |
| | jvm_gc_max_data_size_bytes | | AutoGauge | The historical maximum value of old memory | |
| | jvm_gc_live_data_size_bytes | | AutoGauge | The usage of old memory | |
| | jvm_gc_memory_promoted_bytes | | Counter | The accumulative value of positive memory growth of old memory | |
| | jvm_gc_memory_allocated_bytes | | Counter | The accumulative value of positive memory growth of allocated memory | |
| |
| |
| ### 4.2. Important level metrics |
| |
| #### 4.2.1. Node |
| |
| | Metric | Tags | Type | Description | |
| | ------ | -------------------------------------- | --------- | ------------------------------------------------------------- | |
| | region | name="total",type="SchemaRegion" | AutoGauge | The total number of SchemaRegion in PartitionTable | |
| | region | name="total",type="DataRegion" | AutoGauge | The total number of DataRegion in PartitionTable | |
| | region | name="{ip}:{port}",type="SchemaRegion" | Gauge | The number of SchemaRegion in PartitionTable of specific node | |
| | region | name="{ip}:{port}",type="DataRegion" | Gauge | The number of DataRegion in PartitionTable of specific node | |
| |
| #### 4.2.2. RatisConsensus |
| |
| | Metric | Tags | Type | Description | |
| | --------------------- | -------------------------- | ----- | ------------------------------------------------------------ | |
| | ratis_consensus_write | stage="writeLocally" | Timer | The time cost of writing locally stage | |
| | ratis_consensus_write | stage="writeRemotely" | Timer | The time cost of writing remotely stage | |
| | ratis_consensus_write | stage="writeStateMachine" | Timer | The time cost of writing state machine stage | |
| | ratis_server | clientWriteRequest | Timer | Time taken to process write requests from client | |
| | ratis_server | followerAppendEntryLatency | Timer | Time taken for followers to append log entries | |
| | ratis_log_worker | appendEntryLatency | Timer | Total time taken to append a raft log entry | |
| | ratis_log_worker | queueingDelay | Timer | Time taken for a Raft log operation to get into the queue after being requested, waiting queue to be non-full | |
| | ratis_log_worker | enqueuedTime | Timer | Time spent by a Raft log operation in the queue | |
| | ratis_log_worker | writelogExecutionTime | Timer | Time taken for a Raft log write operation to complete execution | |
| | ratis_log_worker | flushTime | Timer | Time taken to flush log | |
| | ratis_log_worker | closedSegmentsSizeInBytes | Gauge | Size of closed raft log segments in bytes | |
| | ratis_log_worker | openSegmentSizeInBytes | Gauge | Size of open raft log segment in bytes | |
| |
| #### 4.2.3. IoTConsensus |
| |
| | Metric | Tags | Type | Description | |
| | ------------ | ------------------------------------------------------------ | --------- | ------------------------------------------------------------ | |
| | mutli_leader | name="logDispatcher-{IP}:{Port}", region="{region}", type="currentSyncIndex" | AutoGauge | The sync index of synchronization thread in replica group | |
| | mutli_leader | name="logDispatcher-{IP}:{Port}", region="{region}", type="cachedRequestInMemoryQueue" | AutoGauge | The size of cache requests of synchronization thread in replica group | |
| | mutli_leader | name="IoTConsensusServerImpl", region="{region}", type="searchIndex" | AutoGauge | The write process of main process in replica group | |
| | mutli_leader | name="IoTConsensusServerImpl", region="{region}", type="safeIndex" | AutoGauge | The sync index of replica group | |
| | mutli_leader | name="IoTConsensusServerImpl", region="{region}", type="syncLag" | AutoGauge | The sync lag of replica group | |
| | mutli_leader | name="IoTConsensusServerImpl", region="{region}", type="LogEntriesFromWAL" | AutoGauge | The number of logEntries from wal in Batch | |
| | mutli_leader | name="IoTConsensusServerImpl", region="{region}", type="LogEntriesFromQueue" | AutoGauge | The number of logEntries from queue in Batch | |
| | stage | name="iot_consensus", region="{region}", type="getStateMachineLock" | Histogram | The time consumed to get statemachine lock in main process | |
| | stage | name="iot_consensus", region="{region}", type="checkingBeforeWrite" | Histogram | The time consumed to precheck before write in main process | |
| | stage | name="iot_consensus", region="{region}", type="writeStateMachine" | Histogram | The time consumed to write statemachine in main process | |
| | stage | name="iot_consensus", region="{region}", type="offerRequestToQueue" | Histogram | The time consumed to try to offer request to queue in main process | |
| | stage | name="iot_consensus", region="{region}", type="consensusWrite" | Histogram | The time consumed to the whole write in main process | |
| | stage | name="iot_consensus", region="{region}", type="constructBatch" | Histogram | The time consumed to construct batch in synchronization thread | |
| | stage | name="iot_consensus", region="{region}", type="syncLogTimePerRequest" | Histogram | The time consumed to sync log in asynchronous callback process | |
| |
| #### 4.2.4. Cache |
| |
| | Metric | Tags | Type | Description | |
| | --------- | ---------------------------------- | --------- | ------------------------------------------------------------------------ | |
| | cache_hit | name="chunk" | AutoGauge | The cache hit ratio of ChunkCache, Unit: % | |
| | cache_hit | name="schema" | AutoGauge | The cache hit ratio of SchemaCache, Unit: % | |
| | cache_hit | name="timeSeriesMeta" | AutoGauge | The cache hit ratio of TimeseriesMetadataCache, Unit: % | |
| | cache_hit | name="bloomFilter" | AutoGauge | The interception rate of bloomFilter in TimeseriesMetadataCache, Unit: % | |
| | cache | name="Database", type="hit" | Counter | The hit number of Database Cache | |
| | cache | name="Database", type="all" | Counter | The access number of Database Cache | |
| | cache | name="SchemaPartition", type="hit" | Counter | The hit number of SchemaPartition Cache | |
| | cache | name="SchemaPartition", type="all" | Counter | The access number of SSchemaPartition Cache | |
| | cache | name="DataPartition", type="hit" | Counter | The hit number of DataPartition Cache | |
| | cache | name="DataPartition", type="all" | Counter | The access number of SDataPartition Cache | |
| |
| #### 4.2.5. Memory |
| |
| | Metric | Tags | Type | Description | |
| | ------ | -------------------------------- | --------- | ------------------------------------------------------------------ | |
| | mem | name="database_{name}" | AutoGauge | The memory usage of DataRegion in DataNode, Unit: byte | |
| | mem | name="chunkMetaData_{name}" | AutoGauge | The memory usage of chunkMetaData when writting TsFile, Unit: byte | |
| | mem | name="IoTConsensus" | AutoGauge | The memory usage of IoTConsensus, Unit: byte | |
| | mem | name="IoTConsensusQueue" | AutoGauge | The memory usage of IoTConsensus Queue, Unit: byte | |
| | mem | name="IoTConsensusSync" | AutoGauge | The memory usage of IoTConsensus SyncStatus, Unit: byte | |
| | mem | name="schema_region_total_usage" | AutoGauge | The memory usage of all SchemaRegion, Unit: byte | |
| |
| #### 4.2.6. Compaction |
| |
| | Metric | Tags | Type | Description | |
| | --------------------- | --------------------------------------------------- | ------- | -------------------------------------- | |
| | data_written | name="compaction", type="aligned/not-aligned/total" | Counter | The written size of compaction | |
| | data_read | name="compaction" | Counter | The read size of compaction | |
| | compaction_task_count | name = "inner_compaction", type="sequence" | Counter | The number of inner sequence compction | |
| | compaction_task_count | name = "inner_compaction", type="unsequence" | Counter | The number of inner sequence compction | |
| | compaction_task_count | name = "cross_compaction", type="cross" | Counter | The number of corss compction | |
| |
| #### 4.2.7. IoTDB Process |
| |
| | Metric | Tags | Type | Description | |
| | --------------------- | -------------- | --------- | ------------------------------------------- | |
| | process_used_mem | name="memory" | AutoGauge | The used memory of IoTDB process | |
| | process_mem_ratio | name="memory" | AutoGauge | The used memory ratio of IoTDB process | |
| | process_threads_count | name="process" | AutoGauge | The number of thread of IoTDB process | |
| | process_status | name="process" | AutoGauge | The status of IoTDB process, 1=live, 0=dead | |
| |
| #### 4.2.8. JVM Class |
| |
| | Metric | Tags | Type | Description | |
| | ---------------------------- | ---- | --------- | ---------------------------- | |
| | jvm_classes_unloaded_classes | | AutoGauge | The number of unloaded class | |
| | jvm_classes_loaded_classes | | AutoGauge | The number of loaded class | |
| |
| #### 4.2.9. JVM Compilation |
| |
| | Metric | Tags | Type | Description | |
| | ----------------------- | --------------------------------------------- | --------- | -------------------------------- | |
| | jvm_compilation_time_ms | {compiler="HotSpot 64-Bit Tiered Compilers",} | AutoGauge | The time consumed in compilation | |
| |
| #### 4.2.10. Query Planning |
| |
| | Metric | Tags | Type | Description | |
| | --------------- | ---------------------------- | ----- | --------------------------------------------------- | |
| | query_plan_cost | stage="analyzer" | Timer | The query statement analysis time-consuming | |
| | query_plan_cost | stage="logical_planner" | Timer | The query logical plan planning time-consuming | |
| | query_plan_cost | stage="distribution_planner" | Timer | The query distribution plan planning time-consuming | |
| | query_plan_cost | stage="partition_fetcher" | Timer | The partition information fetching time-consuming | |
| | query_plan_cost | stage="schema_fetcher" | Timer | The schema information fetching time-consuming | |
| |
| #### 4.2.11. Plan Dispatcher |
| |
| | Metric | Tags | Type | Description | |
| | ---------- | ------------------------- | ----- | ------------------------------------------------------------ | |
| | dispatcher | stage="wait_for_dispatch" | Timer | The distribution plan dispatcher time-consuming | |
| | dispatcher | stage="dispatch_read" | Timer | The distribution plan dispatcher time-consuming (only query) | |
| |
| #### 4.2.12. Query Resource |
| |
| | Metric | Tags | Type | Description | |
| | -------------- | ------------------------ | ---- | ------------------------------------------ | |
| | query_resource | type="sequence_tsfile" | Rate | The access frequency of sequence tsfiles | |
| | query_resource | type="unsequence_tsfile" | Rate | The access frequency of unsequence tsfiles | |
| | query_resource | type="flushing_memtable" | Rate | The access frequency of flushing memtables | |
| | query_resource | type="working_memtable" | Rate | The access frequency of working memtables | |
| |
| #### 4.2.13. Data Exchange |
| |
| | Metric | Tags | Type | Description | |
| | ------------------- | ---------------------------------------------------------------------- | --------- | --------------------------------------------------------------- | |
| | data_exchange_cost | operation="source_handle_get_tsblock", type="local/remote" | Timer | The time-consuming that source handles receive TsBlock | |
| | data_exchange_cost | operation="source_handle_deserialize_tsblock", type="local/remote" | Timer | The time-consuming that source handles deserialize TsBlock | |
| | data_exchange_cost | operation="sink_handle_send_tsblock", type="local/remote" | Timer | The time-consuming that sink handles send TsBlock | |
| | data_exchange_cost | operation="send_new_data_block_event_task", type="server/caller" | Timer | The RPC time-consuming that sink handles send TsBlock | |
| | data_exchange_cost | operation="get_data_block_task", type="server/caller" | Timer | The RPC time-consuming that source handles receive TsBlock | |
| | data_exchange_cost | operation="on_acknowledge_data_block_event_task", type="server/caller" | Timer | The RPC time-consuming that source handles ack received TsBlock | |
| | data_exchange_count | name="send_new_data_block_num", type="server/caller" | Histogram | The number of sent TsBlocks by sink handles | |
| | data_exchange_count | name="get_data_block_num", type="server/caller" | Histogram | The number of received TsBlocks by source handles | |
| | data_exchange_count | name="on_acknowledge_data_block_num", type="server/caller" | Histogram | The number of acknowledged TsBlocks by source handles | |
| |
| #### 4.2.14. Query Task Schedule |
| |
| | Metric | Tags | Type | Description | |
| | ---------------- | ------------------------------ | --------- | ------------------------------------------------ | |
| | driver_scheduler | name="ready_queued_time" | Timer | The queuing time of ready queue | |
| | driver_scheduler | name="block_queued_time" | Timer | The queuing time of blocking queue | |
| | driver_scheduler | name="ready_queue_task_count" | AutoGauge | The number of tasks queued in the ready queue | |
| | driver_scheduler | name="block_queued_task_count" | AutoGauge | The number of tasks queued in the blocking queue | |
| |
| #### 4.2.15. Query Execution |
| |
| | Metric | Tags | Type | Description | |
| | ------------------------ | ----------------------------------------------------------------------------------- | ------- | --------------------------------------------------------------------------------------- | |
| | query_execution | stage="local_execution_planner" | Timer | The time-consuming of operator tree construction | |
| | query_execution | stage="query_resource_init" | Timer | The time-consuming of query resource initialization | |
| | query_execution | stage="get_query_resource_from_mem" | Timer | The time-consuming of query resource memory query and construction | |
| | query_execution | stage="driver_internal_process" | Timer | The time-consuming of driver execution | |
| | query_execution | stage="wait_for_result" | Timer | The time-consuming of getting query result from result handle | |
| | operator_execution_cost | name="{operator_name}" | Timer | The operator execution time | |
| | operator_execution_count | name="{operator_name}" | Counter | The number of operator calls (counted by the number of next method calls) | |
| | aggregation | from="raw_data" | Timer | The time-consuming of performing an aggregation calculation from a batch of raw data | |
| | aggregation | from="statistics" | Timer | The time-consuming of updating an aggregated value with statistics | |
| | series_scan_cost | stage="load_timeseries_metadata", type="aligned/non_aligned", from="mem/disk" | Timer | The time-consuming of loading TimeseriesMetadata | |
| | series_scan_cost | stage="read_timeseries_metadata", type="", from="cache/file" | Timer | The time-consuming of reading TimeseriesMetadata of a tsfile | |
| | series_scan_cost | stage="timeseries_metadata_modification", type="aligned/non_aligned", from="null" | Timer | The time-consuming of filtering TimeseriesMetadata by mods | |
| | series_scan_cost | stage="load_chunk_metadata_list", type="aligned/non_aligned", from="mem/disk" | Timer | The time-consuming of loading ChunkMetadata list | |
| | series_scan_cost | stage="chunk_metadata_modification", type="aligned/non_aligned", from="mem/disk" | Timer | The time-consuming of filtering ChunkMetadata by mods | |
| | series_scan_cost | stage="chunk_metadata_filter", type="aligned/non_aligned", from="mem/disk" | Timer | The time-consuming of filtering ChunkMetadata by query filter | |
| | series_scan_cost | stage="construct_chunk_reader", type="aligned/non_aligned", from="mem/disk" | Timer | The time-consuming of constructing ChunkReader | |
| | series_scan_cost | stage="read_chunk", type="", from="cache/file" | Timer | The time-consuming of reading Chunk | |
| | series_scan_cost | stage="init_chunk_reader", type="aligned/non_aligned", from="mem/disk" | Timer | The time-consuming of initializing ChunkReader (constructing PageReader) | |
| | series_scan_cost | stage="build_tsblock_from_page_reader", type="aligned/non_aligned", from="mem/disk" | Timer | The time-consuming of constructing Tsblock from PageReader | |
| | series_scan_cost | stage="build_tsblock_from_merge_reader", type="aligned/non_aligned", from="null" | Timer | The time-consuming of constructing Tsblock from MergeReader (handling overlapping data) | |
| |
| #### 4.2.16 Schema Engine |
| |
| | Metric | Tags | Type | Description | |
| | ------------- | ------------------------------------------------------------ | --------- | -------------------------------------------------- | |
| | schema_engine | name="schema_region_total_mem_usage" | AutoGauge | Memory usgae for all SchemaRegion | |
| | schema_engine | name="schema_region_mem_capacity" | AutoGauge | Memory capacity for all SchemaRegion | |
| | schema_engine | name="schema_engine_mode" | Gauge | Mode of SchemaEngine | |
| | schema_engine | name="schema_region_consensus" | Gauge | Consensus protocol of SchemaRegion | |
| | schema_engine | name="schema_region_number" | AutoGauge | Number of SchemaRegion | |
| | quantity | name="template_series_cnt" | AutoGauge | Number of template series | |
| | schema_region | name="schema_region_mem_usage", region="SchemaRegion[{regionId}]" | AutoGauge | Memory usgae for each SchemaRegion | |
| | schema_region | name="schema_region_series_cnt", region="SchemaRegion[{regionId}]" | AutoGauge | Number of total timeseries for each SchemaRegion | |
| | schema_region | name="activated_template_cnt", region="SchemaRegion[{regionId}]" | AutoGauge | Number of Activated template for each SchemaRegion | |
| | schema_region | name="template_series_cnt", region="SchemaRegion[{regionId}]" | AutoGauge | Number of template series for each SchemaRegion | |
| |
| #### 4.2.17 Write Performance |
| |
| | Metric | Tags | Type | Description | |
| | ------------------------- | :-------------------------------------------------------------------- | --------- | ------------------------------------------------------ | |
| | wal_node_num | name="wal_nodes_num" | AutoGauge | Num of WALNode | |
| | wal_cost | stage="make_checkpoint" type="<checkpoint_type>" | Timer | Time cost of make checkpoints for all checkpoint type | |
| | wal_cost | type="serialize_one_wal_info_entry" | Timer | Time cost of serialize one WALInfoEntry | |
| | wal_cost | stage="sync_wal_buffer" type="<force_flag>" | Timer | Time cost of sync WALBuffer | |
| | wal_buffer | name="used_ratio" | Histogram | Used ratio of WALBuffer | |
| | wal_buffer | name="entries_count" | Histogram | Entries Count of WALBuffer | |
| | wal_cost | stage="serialize_wal_entry" type="serialize_wal_entry_total" | Timer | Time cost of WALBuffer serialize task | |
| | wal_node_info | name="effective_info_ratio" type="<wal_node_id>" | Histogram | Effective info ratio of WALNode | |
| | wal_node_info | name="oldest_mem_table_ram_when_cause_snapshot" type="<wal_node_id>" | Histogram | Ram of oldest memTable when cause snapshot | |
| | wal_node_info | name="oldest_mem_table_ram_when_cause_flush" type="<wal_node_id>" | Histogram | Ram of oldest memTable when cause flush | |
| | flush_sub_task_cost | type="sort_task" | Timer | Time cost of sort series in flush sort stage | |
| | flush_sub_task_cost | type="encoding_task" | Timer | Time cost of sub encoding task in flush encoding stage | |
| | flush_sub_task_cost | type="io_task" | Timer | Time cost of sub io task in flush io stage | |
| | flush_cost | stage="write_plan_indices" | Timer | Time cost of write plan indices | |
| | flush_cost | stage="sort" | Timer | Time cost of flush sort stage | |
| | flush_cost | stage="encoding" | Timer | Time cost of flush encoding stage | |
| | flush_cost | stage="io" | Timer | Time cost of flush io stage | |
| | pending_flush_task | type="pending_task_num" | AutoGauge | Num of pending flush task num | |
| | pending_flush_task | type="pending_sub_task_num" | AutoGauge | Num of pending flush sub task num | |
| | flushing_mem_table_status | name="mem_table_size" region="DataRegion[<data_region_id>]" | Histogram | Size of flushing memTable | |
| | flushing_mem_table_status | name="total_point_num" region="DataRegion[<data_region_id>]" | Histogram | Point num of flushing memTable | |
| | flushing_mem_table_status | name="series_num" region="DataRegion[<data_region_id>]" | Histogram | Series num of flushing memTable | |
| | flushing_mem_table_status | name="avg_series_points_num" region="DataRegion[<data_region_id>]" | Histogram | Point num of flushing memChunk | |
| | flushing_mem_table_status | name="tsfile_compression_ratio" region="DataRegion[<data_region_id>]" | Histogram | TsFile Compression ratio of flushing memTable | |
| | flushing_mem_table_status | name="flush_tsfile_size" region="DataRegion[<data_region_id>]" | Histogram | TsFile size of flushing memTable | |
| | data_region_mem_cost | name="data_region_mem_cost" | AutoGauge | Mem cost of data regions | |
| |
| ### 4.3. Normal level Metrics |
| |
| #### 4.3.1. Cluster |
| |
| | Metric | Tags | Type | Description | |
| | ------ | ------------------------------------------------------------ | --------- | ------------------------------------------------------------------ | |
| | region | name="{DatabaseName}",type="SchemaRegion/DataRegion" | AutoGauge | The number of DataRegion/SchemaRegion of database in specific node | |
| | slot | name="{DatabaseName}",type="schemaSlotNumber/dataSlotNumber" | AutoGauge | The number of DataSlot/SchemaSlot of database in specific node | |
| |
| ### 4.4. All Metric |
| |
| Currently there is no All level metrics, and it will continue to be added in the future. |
| |
| ## 5. How to get these metrics? |
| |
| The relevant configuration of the metric module is in `conf/iotdb-{datanode/confignode}.properties`, and all |
| configuration items support hot loading through the `load configuration` command. |
| |
| ### 5.1. JMX |
| |
| For metrics exposed externally using JMX, you can view them through Jconsole. After entering the Jconsole monitoring |
| page, you will first see an overview of various running conditions of IoTDB. Here you can see heap memory information, |
| thread information, class information, and the server's CPU usage. |
| |
| #### 5.1.1. Obtain metric data |
| |
| After connecting to JMX, you can find the "MBean" named "org.apache.iotdb.metrics" through the "MBeans" tab, and you can |
| view the specific values of all monitoring metrics in the sidebar. |
| |
| <img style="width:100%; max-width:800px; max-height:600px; margin-left:auto; margin-right:auto; display:block;" alt="metric-jmx" src="https://alioss.timecho.com/docs/img/github/204018765-6fda9391-ebcf-4c80-98c5-26f34bd74df0.png"> |
| |
| #### 5.1.2. Get other relevant data |
| |
| After connecting to JMX, you can find the "MBean" named "org.apache.iotdb.service" through the "MBeans" tab, as shown in |
| the image below, to understand the basic status of the service |
| |
| <img style="width:100%; max-width:800px; max-height:600px; margin-left:auto; margin-right:auto; display:block;" src="https://alioss.timecho.com/docs/img/github/149951720-707f1ee8-32ee-4fde-9252-048caebd232e.png"> <br> |
| |
| In order to improve query performance, IOTDB caches ChunkMetaData and TsFileMetaData. Users can use MXBean and expand |
| the sidebar `org.apache.iotdb.db.service` to view the cache hit ratio: |
| |
| <img style="width:100%; max-width:800px; max-height:600px; margin-left:auto; margin-right:auto; display:block;" src="https://alioss.timecho.com/docs/img/github/112426760-73e3da80-8d73-11eb-9a8f-9232d1f2033b.png"> |
| |
| ### 5.2. Prometheus |
| |
| #### 5.2.1. The mapping from metric type to prometheus format |
| |
| > For metrics whose Metric Name is name and Tags are K1=V1, ..., Kn=Vn, the mapping is as follows, where value is a |
| > specific value |
| |
| | Metric Type | Mapping | |
| | ---------------- | --------------------------------------------------------------------------------------------------------------------------------------------------------------------------------------------------------------------------------------------------------------------------------------------------------------------------------------------------------------------------------------------------------------------------------------------------------------------------------------------------------------------------------------------------------------------------------------------------------------------------------------------------------------------------------------------------------------------------------------------------------------------------------------------------------------------------------------------------------------- | |
| | Counter | name_total{cluster="clusterName", nodeType="nodeType", nodeId="nodeId", k1="V1", ..., Kn="Vn"} value | |
| | AutoGauge、Gauge | name{cluster="clusterName", nodeType="nodeType", nodeId="nodeId", k1="V1", ..., Kn="Vn"} value | |
| | Histogram | name_max{cluster="clusterName", nodeType="nodeType", nodeId="nodeId", k1="V1", ..., Kn="Vn"} value <br> name_sum{cluster="clusterName", nodeType="nodeType", nodeId="nodeId", k1="V1", ..., Kn="Vn"} value <br> name_count{cluster="clusterName", nodeType="nodeType", nodeId="nodeId", k1="V1", ..., Kn="Vn"} value <br> name{cluster="clusterName", nodeType="nodeType", nodeId="nodeId", k1="V1", ..., Kn="Vn", quantile="0.0"} value <br> name{cluster="clusterName", nodeType="nodeType", nodeId="nodeId", k1="V1", ..., Kn="Vn", quantile="0.5"} value <br> name{cluster="clusterName", nodeType="nodeType", nodeId="nodeId", k1="V1", ..., Kn="Vn", quantile="0.99"} value <br> name{cluster="clusterName", nodeType="nodeType", nodeId="nodeId", k1="V1", ..., Kn="Vn", quantile="0.999"} value | |
| | Rate | name_total{cluster="clusterName", nodeType="nodeType", nodeId="nodeId", k1="V1", ..., Kn="Vn"} value <br> name_total{cluster="clusterName", nodeType="nodeType", nodeId="nodeId", k1="V1", ..., Kn="Vn", rate="m1"} value <br> name_total{cluster="clusterName", nodeType="nodeType", nodeId="nodeId", k1="V1", ..., Kn="Vn", rate="m5"} value <br> name_total{cluster="clusterName", nodeType="nodeType", nodeId="nodeId", k1="V1", ..., Kn="Vn", rate="m15"} value <br> name_total{cluster="clusterName", nodeType="nodeType", nodeId="nodeId", k1="V1", ..., Kn="Vn", rate="mean"} value | |
| | Timer | name_seconds_max{cluster="clusterName", nodeType="nodeType", nodeId="nodeId", k1="V1", ..., Kn="Vn"} value <br> name_seconds_sum{cluster="clusterName", nodeType="nodeType", nodeId="nodeId", k1="V1", ..., Kn="Vn"} value <br> name_seconds_count{cluster="clusterName", nodeType="nodeType", nodeId="nodeId", k1="V1", ..., Kn="Vn"} value <br> name_seconds{cluster="clusterName", nodeType="nodeType", nodeId="nodeId", k1="V1", ..., Kn="Vn", quantile="0.0"} value <br> name_seconds{cluster="clusterName", nodeType="nodeType", nodeId="nodeId", k1="V1", ..., Kn="Vn", quantile="0.5"} value <br> name_seconds{cluster="clusterName", nodeType="nodeType", nodeId="nodeId", k1="V1", ..., Kn="Vn", quantile="0.99"} value <br> name_seconds{cluster="clusterName", nodeType="nodeType", nodeId="nodeId", k1="V1", ..., Kn="Vn", quantile="0.999"} value | |
| |
| #### 5.2.2. Config File |
| |
| 1) Taking DataNode as an example, modify the iotdb-datanode.properties configuration file as follows: |
| |
| ```properties |
| dn_metric_reporter_list=PROMETHEUS |
| dn_metric_level=CORE |
| dn_metric_prometheus_reporter_port=9091 |
| ``` |
| |
| Then you can get metrics data as follows |
| |
| 2) Start IoTDB DataNodes |
| 3) Open a browser or use ```curl``` to visit ```http://servier_ip:9091/metrics```, you can get the following metric |
| data: |
| |
| ``` |
| ... |
| # HELP file_count |
| # TYPE file_count gauge |
| file_count{name="wal",} 0.0 |
| file_count{name="unseq",} 0.0 |
| file_count{name="seq",} 2.0 |
| ... |
| ``` |
| |
| #### 5.2.3. Prometheus + Grafana |
| |
| As shown above, IoTDB exposes monitoring metrics data in the standard Prometheus format to the outside world. Prometheus |
| can be used to collect and store monitoring indicators, and Grafana can be used to visualize monitoring indicators. |
| |
| The following picture describes the relationships among IoTDB, Prometheus and Grafana |
| |
| 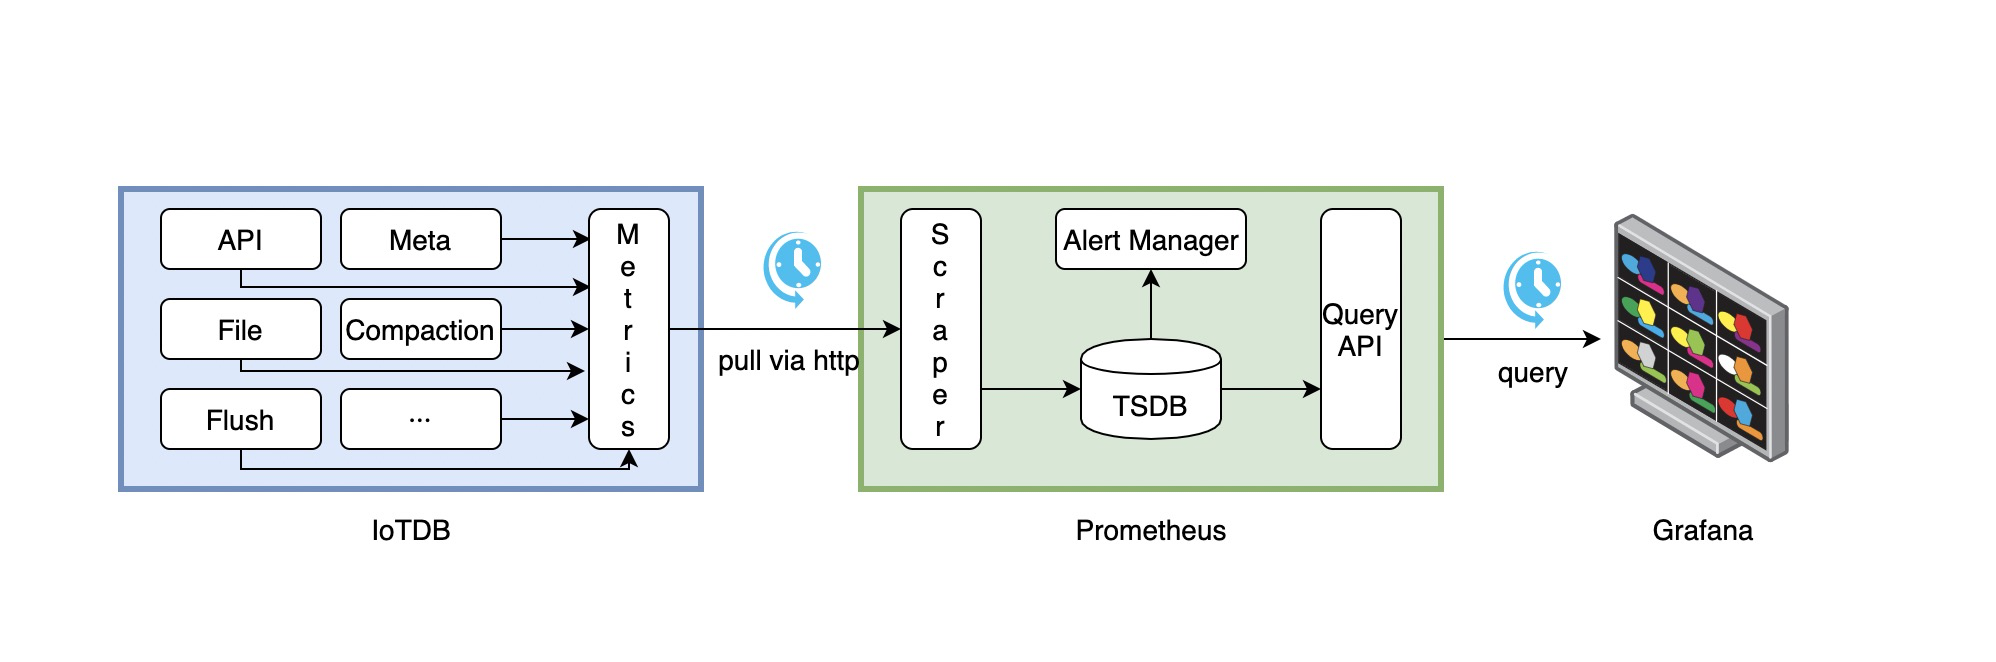 |
| |
| 1. Along with running, IoTDB will collect its metrics continuously. |
| 2. Prometheus scrapes metrics from IoTDB at a constant interval (can be configured). |
| 3. Prometheus saves these metrics to its inner TSDB. |
| 4. Grafana queries metrics from Prometheus at a constant interval (can be configured) and then presents them on the |
| graph. |
| |
| So, we need to do some additional works to configure and deploy Prometheus and Grafana. |
| |
| For instance, you can config your Prometheus as follows to get metrics data from IoTDB: |
| |
| ```yaml |
| job_name: pull-metrics |
| honor_labels: true |
| honor_timestamps: true |
| scrape_interval: 15s |
| scrape_timeout: 10s |
| metrics_path: /metrics |
| scheme: http |
| follow_redirects: true |
| static_configs: |
| - targets: |
| - localhost:9091 |
| ``` |
| |
| The following documents may help you have a good journey with Prometheus and Grafana. |
| |
| [Prometheus getting_started](https://prometheus.io/docs/prometheus/latest/getting_started/) |
| |
| [Prometheus scrape metrics](https://prometheus.io/docs/prometheus/latest/configuration/configuration/#scrape_config) |
| |
| [Grafana getting_started](https://grafana.com/docs/grafana/latest/getting-started/getting-started/) |
| |
| [Grafana query metrics from Prometheus](https://prometheus.io/docs/visualization/grafana/#grafana-support-for-prometheus) |
| |
| #### 5.2.4. Apache IoTDB Dashboard |
| |
| We provide the Apache IoTDB Dashboard, and the rendering shown in Grafana is as follows: |
| |
| 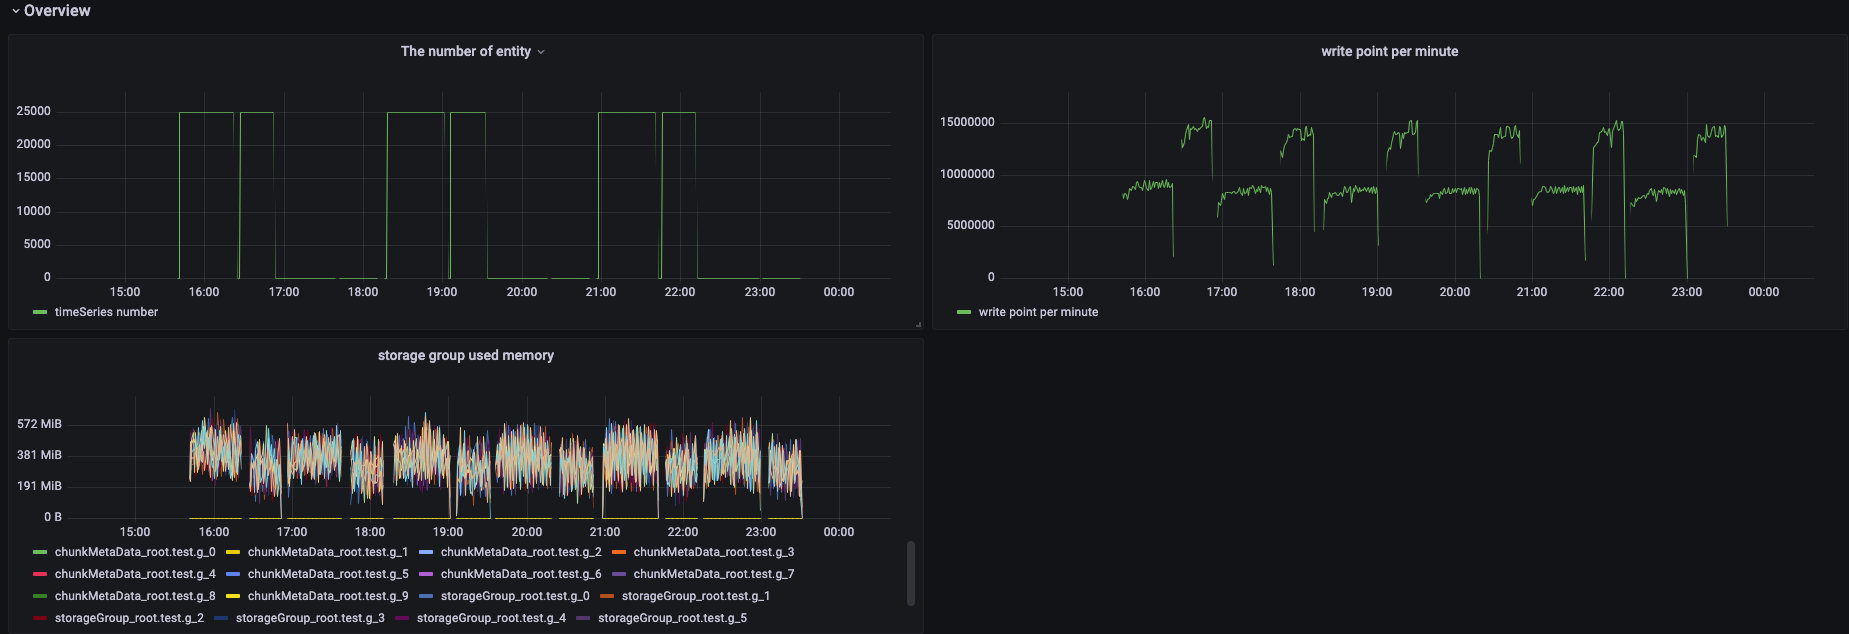 |
| |
| You can obtain the json files of Dashboards in enterprise version. |
| |
| ### 5.3. IoTDB |
| |
| #### 5.3.1. IoTDB mapping relationship of metrics |
| |
| > For metrics whose Metric Name is name and Tags are K1=V1, ..., Kn=Vn, the mapping is as follows, taking root.__ |
| > system.metric.`clusterName`.`nodeType`.`nodeId` as an example by default |
| |
| | Metric Type | Mapping | |
| | ---------------- | --------------------------------------------------------------------------------------------------------------------------------------------------------------------------------------------------------------------------------------------------------------------------------------------------------------------------------------------------------------------------------------------------------------------------------------------------------------------------------------------------------------------------------------------------------------------------------------------------------------------------------------------------------------------------------------------------------------------------------------------------------------------------------------------------------------------------------------------------------------------------------------------------------------------------------------------------------------------------------------------------------------------------------------------------------------------------------- | |
| | Counter | root.__system.metric.`clusterName`.`nodeType`.`nodeId`.name.`K1=V1`...`Kn=Vn`.value | |
| | AutoGauge、Gauge | root.__system.metric.`clusterName`.`nodeType`.`nodeId`.name.`K1=V1`...`Kn=Vn`.value | |
| | Histogram | root.__system.metric.`clusterName`.`nodeType`.`nodeId`.name.`K1=V1`...`Kn=Vn`.count <br> root.__system.metric.`clusterName`.`nodeType`.`nodeId`.name.`K1=V1`...`Kn=Vn`.max <br> root.__system.metric.`clusterName`.`nodeType`.`nodeId`.name.`K1=V1`...`Kn=Vn`.sum <br> root.__system.metric.`clusterName`.`nodeType`.`nodeId`.name.`K1=V1`...`Kn=Vn`.p0 <br> root.__system.metric.`clusterName`.`nodeType`.`nodeId`.name.`K1=V1`...`Kn=Vn`.p50 <br> root.__system.metric.`clusterName`.`nodeType`.`nodeId`.name.`K1=V1`...`Kn=Vn`.p75 <br> root.__system.metric.`clusterName`.`nodeType`.`nodeId`.name.`K1=V1`...`Kn=Vn`.p99 <br> root.__system.metric.`clusterName`.`nodeType`.`nodeId`.name.`K1=V1`...`Kn=Vn`.p999 | |
| | Rate | root.__system.metric.`clusterName`.`nodeType`.`nodeId`.name.`K1=V1`...`Kn=Vn`.count <br> root.__system.metric.`clusterName`.`nodeType`.`nodeId`.name.`K1=V1`...`Kn=Vn`.mean <br> root.__system.metric.`clusterName`.`nodeType`.`nodeId`.name.`K1=V1`...`Kn=Vn`.m1 <br> root.__system.metric.`clusterName`.`nodeType`.`nodeId`.name.`K1=V1`...`Kn=Vn`.m5 <br> root.__system.metric.`clusterName`.`nodeType`.`nodeId`.name.`K1=V1`...`Kn=Vn`.m15 | |
| | Timer | root.__system.metric.`clusterName`.`nodeType`.`nodeId`.name.`K1=V1`...`Kn=Vn`.count <br> root.__system.metric.`clusterName`.`nodeType`.`nodeId`.name.`K1=V1`...`Kn=Vn`.max <br> root.__system.metric.`clusterName`.`nodeType`.`nodeId`.name.`K1=V1`...`Kn=Vn`.mean <br> root.__system.metric.`clusterName`.`nodeType`.`nodeId`.name.`K1=V1`...`Kn=Vn`.sum <br> root.__system.metric.`clusterName`.`nodeType`.`nodeId`.name.`K1=V1`...`Kn=Vn`.p0 <br> root.__system.metric.`clusterName`.`nodeType`.`nodeId`.name.`K1=V1`...`Kn=Vn`.p50 <br> root.__system.metric.`clusterName`.`nodeType`.`nodeId`.name.`K1=V1`...`Kn=Vn`.p75 <br> root.__system.metric.`clusterName`.`nodeType`.`nodeId`.name.`K1=V1`...`Kn=Vn`.p99 <br> root.__system.metric.`clusterName`.`nodeType`.`nodeId`.name.`K1=V1`...`Kn=Vn`.p999 <br> root.__system.metric.`clusterName`.`nodeType`.`nodeId`.name.`K1=V1`...`Kn=Vn`.m1 <br> root.__system.metric.`clusterName`.`nodeType`.`nodeId`.name.`K1=V1`...`Kn=Vn`.m5 <br> root.__system.metric.`clusterName`.`nodeType`.`nodeId`.name.`K1=V1`...`Kn=Vn`.m15 | |
| |
| #### 5.3.2. Obtain metrics |
| |
| According to the above mapping relationship, related IoTDB query statements can be formed to obtain metrics |