What is metrics?
Along with IoTDB running, some metrics reflecting current system's status will be collected continuously, which will provide some useful information helping us resolving system problems and detecting potential system risks.
When to use metrics?
Belows are some typical application scenarios
System is running slowly
When system is running slowly, we always hope to have information about system's running status as detail as possible, such as
- JVM:Is there FGC?How long does it cost?How much does the memory usage decreased after GC?Are there lots of threads?
- System:Is the CPU usage too hi?Are there many disk IOs?
- Connections:How many connections are there in the current time?
- Interface:What is the TPS and latency of every interface?
- ThreadPool:Are there many pending tasks?
- Cache Hit Ratio
No space left on device
When meet a “no space left on device” error, we really want to know which kind of data file had a rapid rise in the past hours.
Is the system running in abnormal status
We could use the count of error logs、the alive status of nodes in cluster, etc, to determine whether the system is running abnormally.
Who will use metrics?
Any person cares about the system's status, including but not limited to RD, QA, SRE, DBA, can use the metrics to work more efficiently.
What metrics does IoTDB have?
For now, we have provided some metrics for several core modules of IoTDB, and more metrics will be added or updated along with the development of new features and optimization or refactoring of architecture.
Key Concept
Before step into next, we'd better stop to have a look into some key concepts about metrics.
Every metric data has two properties
Metric Name
The name of this metric,for example,
logback_events_totalindicates the total count of log events。Tag
Each metric could have 0 or several sub classes (Tag), for the same example, the
logback_events_totalmetric has a sub class namedlevel, which meansthe total count of log events at the specific level
Data Format
IoTDB provides metrics data both in JMX and Prometheus format. For JMX, you can get these metrics via org.apache.iotdb.metrics.
Next, we will choose Prometheus format data as samples to describe each kind of metric.
IoTDB Metrics
API
| Metric | Tag | Description | Sample |
|---|---|---|---|
| entry_seconds_count | name=“interface name” | The total request count of the interface | entry_seconds_count{name=“openSession”,} 1.0 |
| entry_seconds_sum | name=“interface name” | The total cost seconds of the interface | entry_seconds_sum{name=“openSession”,} 0.024 |
| entry_seconds_max | name=“interface name” | The max latency of the interface | entry_seconds_max{name=“openSession”,} 0.024 |
| quantity_total | name=“pointsIn” | The total points inserted into IoTDB | quantity_total{name=“pointsIn”,} 1.0 |
File
| Metric | Tag | Description | Sample |
|---|---|---|---|
| file_size | name=“wal/seq/unseq” | The current file size of wal/seq/unseq in bytes | file_size{name=“wal”,} 67.0 |
| file_count | name=“wal/seq/unseq” | The current count of wal/seq/unseq files | file_count{name=“seq”,} 1.0 |
Flush
| Metric | Tag | Description | Sample |
|---|---|---|---|
| queue | name=“flush”, status=“running/waiting” | The count of current flushing tasks in running and waiting status | queue{name=“flush”,status=“waiting”,} 0.0 queue{name=“flush”,status=“running”,} 0.0 |
| cost_task_seconds_count | name=“flush” | The total count of flushing occurs till now | cost_task_seconds_count{name=“flush”,} 1.0 |
| cost_task_seconds_max | name=“flush” | The seconds of the longest flushing task takes till now | cost_task_seconds_max{name=“flush”,} 0.363 |
| cost_task_seconds_sum | name=“flush” | The total cost seconds of all flushing tasks till now | cost_task_seconds_sum{name=“flush”,} 0.363 |
Compaction
| Metric | Tag | Description | Sample |
|---|---|---|---|
| queue | name=“compaction_inner/compaction_cross”, status=“running/waiting” | The count of current compaction tasks in running and waiting status | queue{name=“compaction_inner”,status=“waiting”,} 0.0 |
| cost_task_seconds_count | name=“compaction” | The total count of compaction occurs till now | cost_task_seconds_count{name=“compaction”,} 1.0 |
| cost_task_seconds_max | name=“compaction” | The seconds of the longest compaction task takes till now | cost_task_seconds_max{name=“compaction”,} 0.363 |
| cost_task_seconds_sum | name=“compaction” | The total cost seconds of all compaction tasks till now | cost_task_seconds_sum{name=“compaction”,} 0.363 |
Memory Usage
| Metric | Tag | Description | Sample |
|---|---|---|---|
| mem | name=“chunkMetaData/storageGroup/mtree” | Current memory size of chunkMetaData/storageGroup/mtree data in bytes | mem{name=“chunkMetaData”,} 2050.0 |
Cache Hit Ratio
| Metric | Tag | Description | Sample |
|---|---|---|---|
| cache_hit | name=“chunk/timeSeriesMeta/bloomFilter” | Cache hit ratio of chunk/timeSeriesMeta and prevention ratio of bloom filter | cache_hit{name=“chunk”,} 80 |
Business Data
| Metric | Tag | Description | Sample |
|---|---|---|---|
| quantity | name=“timeSeries/storageGroup/device” | The current count of timeSeries/storageGroup/devices in IoTDB | quantity{name=“timeSeries”,} 1.0 |
Cluster
| Metric | Tag | Description | Sample |
|---|---|---|---|
| cluster_node_leader_count | name=“{{ip}}” | The count of dataGroupLeader on each node, which reflects the distribution of leaders | cluster_node_leader_count{name=“127.0.0.1”,} 2.0 |
| cluster_uncommitted_log | name=“{{ip_datagroupHeader}}” | The count of uncommitted_log on each node in data groups it belongs to | cluster_uncommitted_log{name=“127.0.0.1_Data-127.0.0.1-40010-raftId-0”,} 0.0 |
| cluster_node_status | name=“{{ip}}” | The current node status, 1=online 2=offline | cluster_node_status{name=“127.0.0.1”,} 1.0 |
| cluster_elect_total | name=“{{ip}}”,status=“fail/win” | The count and result (won or failed) of elections the node participated in. | cluster_elect_total{name=“127.0.0.1”,status=“win”,} 1.0 |
Log Events
| Metric | Tag | Description | Sample |
|---|---|---|---|
| logback_events_total | {level=“trace/debug/info/warn/error”,} | The count of trace/debug/info/warn/error log events till now | logback_events_total{level=“warn”,} 0.0 |
JVM
Threads
| Metric | Tag | Description | Sample |
|---|---|---|---|
| jvm_threads_live_threads | None | The current count of threads | jvm_threads_live_threads 25.0 |
| jvm_threads_daemon_threads | None | The current count of daemon threads | jvm_threads_daemon_threads 12.0 |
| jvm_threads_peak_threads | None | The max count of threads till now | jvm_threads_peak_threads 28.0 |
| jvm_threads_states_threads | state=“runnable/blocked/waiting/timed-waiting/new/terminated” | The count of threads in each status | jvm_threads_states_threads{state=“runnable”,} 10.0 |
GC
| Metric | Tag | Description | Sample |
|---|---|---|---|
| jvm_gc_pause_seconds_count | action=“end of major GC/end of minor GC”,cause=“xxxx” | The total count of YGC/FGC events and its cause | jvm_gc_pause_seconds_count{action=“end of major GC”,cause=“Metadata GC Threshold”,} 1.0 |
| jvm_gc_pause_seconds_sum | action=“end of major GC/end of minor GC”,cause=“xxxx” | The total cost seconds of YGC/FGC and its cause | jvm_gc_pause_seconds_sum{action=“end of major GC”,cause=“Metadata GC Threshold”,} 0.03 |
| jvm_gc_pause_seconds_max | action=“end of major GC”,cause=“Metadata GC Threshold” | The max cost seconds of YGC/FGC till now and its cause | jvm_gc_pause_seconds_max{action=“end of major GC”,cause=“Metadata GC Threshold”,} 0.0 |
| jvm_gc_overhead_percent | None | An approximation of the percent of CPU time used by GC activities over the last lookback period or since monitoring began, whichever is shorter, in the range [0..1] | jvm_gc_overhead_percent 0.0 |
| jvm_gc_memory_promoted_bytes_total | None | Count of positive increases in the size of the old generation memory pool before GC to after GC | jvm_gc_memory_promoted_bytes_total 8425512.0 |
| jvm_gc_max_data_size_bytes | None | Max size of long-lived heap memory pool | jvm_gc_max_data_size_bytes 2.863661056E9 |
| jvm_gc_live_data_size_bytes | 无 | Size of long-lived heap memory pool after reclamation | jvm_gc_live_data_size_bytes 8450088.0 |
| jvm_gc_memory_allocated_bytes_total | None | Incremented for an increase in the size of the (young) heap memory pool after one GC to before the next | jvm_gc_memory_allocated_bytes_total 4.2979144E7 |
Memory
| Metric | Tag | Description | Sample |
|---|---|---|---|
| jvm_buffer_memory_used_bytes | id=“direct/mapped” | An estimate of the memory that the Java virtual machine is using for this buffer pool | jvm_buffer_memory_used_bytes{id=“direct”,} 3.46728099E8 |
| jvm_buffer_total_capacity_bytes | id=“direct/mapped” | An estimate of the total capacity of the buffers in this pool | jvm_buffer_total_capacity_bytes{id=“mapped”,} 0.0 |
| jvm_buffer_count_buffers | id=“direct/mapped” | An estimate of the number of buffers in the pool | jvm_buffer_count_buffers{id=“direct”,} 183.0 |
| jvm_memory_committed_bytes | {area=“heap/nonheap”,id=“xxx”,} | The amount of memory in bytes that is committed for the Java virtual machine to use | jvm_memory_committed_bytes{area=“heap”,id=“Par Survivor Space”,} 2.44252672E8 jvm_memory_committed_bytes{area=“nonheap”,id=“Metaspace”,} 3.9051264E7 |
| jvm_memory_max_bytes | {area=“heap/nonheap”,id=“xxx”,} | The maximum amount of memory in bytes that can be used for memory management | jvm_memory_max_bytes{area=“heap”,id=“Par Survivor Space”,} 2.44252672E8 jvm_memory_max_bytes{area=“nonheap”,id=“Compressed Class Space”,} 1.073741824E9 |
| jvm_memory_used_bytes | {area=“heap/nonheap”,id=“xxx”,} | The amount of used memory | jvm_memory_used_bytes{area=“heap”,id=“Par Eden Space”,} 1.000128376E9 jvm_memory_used_bytes{area=“nonheap”,id=“Code Cache”,} 2.9783808E7 |
Classes
| Metric | Tag | Description | Sample |
|---|---|---|---|
| jvm_classes_unloaded_classes_total | 无 | The total number of classes unloaded since the Java virtual machine has started execution | jvm_classes_unloaded_classes_total 680.0 |
| jvm_classes_loaded_classes | 无 | The number of classes that are currently loaded in the Java virtual machine | jvm_classes_loaded_classes 5975.0 |
| jvm_compilation_time_ms_total | {compiler=“HotSpot 64-Bit Tiered Compilers”,} | The approximate accumulated elapsed time spent in compilation | jvm_compilation_time_ms_total{compiler=“HotSpot 64-Bit Tiered Compilers”,} 107092.0 |
If you want add your own metrics data in IoTDB, please see the [IoTDB Metric Framework] (https://github.com/apache/iotdb/tree/master/metrics) document.
How to get these metrics?
The metrics collection switch is disabled by default,you need to enable it from conf/iotdb-metric.yml
Iotdb-metric.yml
# The default value is false,change it to true and start/restart you IoTDB server, then you will get the metrics data.
enableMetric: false

# IoTDB provides metrics data both in JMX and Prometheus format.
metricReporterList:
  - jmx
  - prometheus

# You can choose the underlying inplementation of the framework, dropwizard or micrometer, the latter is recommended.
monitorType: micrometer

# you can set the period time of push.
# This param works only when monitorType=dropwizard
pushPeriodInSecond: 5
########################################################
#                                                      #
# if the reporter is prometheus,                       #
# then the following must be set                       #
#                                                      #
########################################################
prometheusReporterConfig:
  prometheusExporterUrl: http://localhost

  # From this port, you can get metrics data by http request
  prometheusExporterPort: 9091
Then you can get metrics data as follows
- Enable metrics switch in
iotdb-metric.yml - You can just stay other config params as default.
- Start/Restart your IoTDB server/cluster
- Open your browser or use the
curlcommand to requesthttp://servier_ip:9001/metrics,then you will get metrics data like follows:
# HELP file_count
# TYPE file_count gauge
file_count{name="wal",} 0.0
file_count{name="unseq",} 0.0
file_count{name="seq",} 2.0
# HELP file_size
# TYPE file_size gauge
file_size{name="wal",} 0.0
file_size{name="unseq",} 0.0
file_size{name="seq",} 560.0
# HELP queue
# TYPE queue gauge
queue{name="flush",status="waiting",} 0.0
queue{name="flush",status="running",} 0.0
# HELP quantity
# TYPE quantity gauge
quantity{name="timeSeries",} 1.0
quantity{name="storageGroup",} 1.0
quantity{name="device",} 1.0
# HELP logback_events_total Number of error level events that made it to the logs
# TYPE logback_events_total counter
logback_events_total{level="warn",} 0.0
logback_events_total{level="debug",} 2760.0
logback_events_total{level="error",} 0.0
logback_events_total{level="trace",} 0.0
logback_events_total{level="info",} 71.0
# HELP mem
# TYPE mem gauge
mem{name="storageGroup",} 0.0
mem{name="mtree",} 1328.0
Integrating with Prometheus and Grafana
As above descriptions,IoTDB provides metrics data in standard Prometheus format,so we can integrate with Prometheus and Grafana directly.
The following picture describes the relationships among IoTDB, Prometheus and Grafana
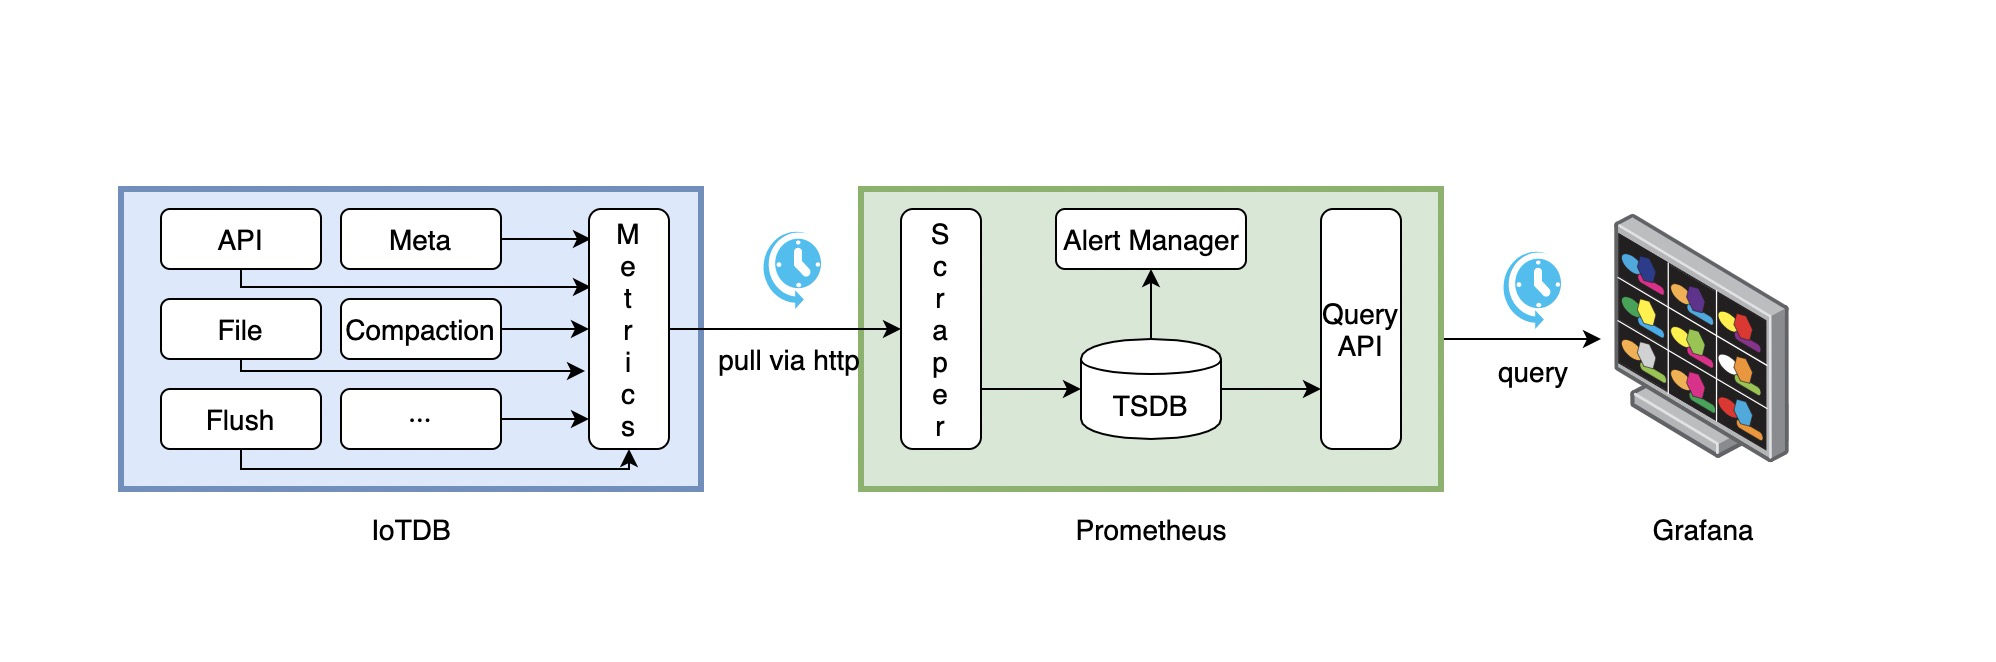
- Along with running, IoTDB will collect its metrics continuously.
- Prometheus scrapes metrics from IoTDB at a constant interval (can be configured).
- Prometheus saves these metrics to its inner TSDB.
- Grafana queries metrics from Prometheus at a constant interval (can be configured) and then presents them on the graph.
So, we need to do some additional works to configure and deploy Prometheus and Grafana.
For instance, you can config your Prometheus as follows to get metrics data from IoTDB:
job_name: pull-metrics
honor_labels: true
honor_timestamps: true
scrape_interval: 15s
scrape_timeout: 10s
metrics_path: /metrics
scheme: http
follow_redirects: true
static_configs:
- targets:
  - localhost:9091
The following documents may help you have a good journey with Prometheus and Grafana.
Grafana query metrics from Prometheus
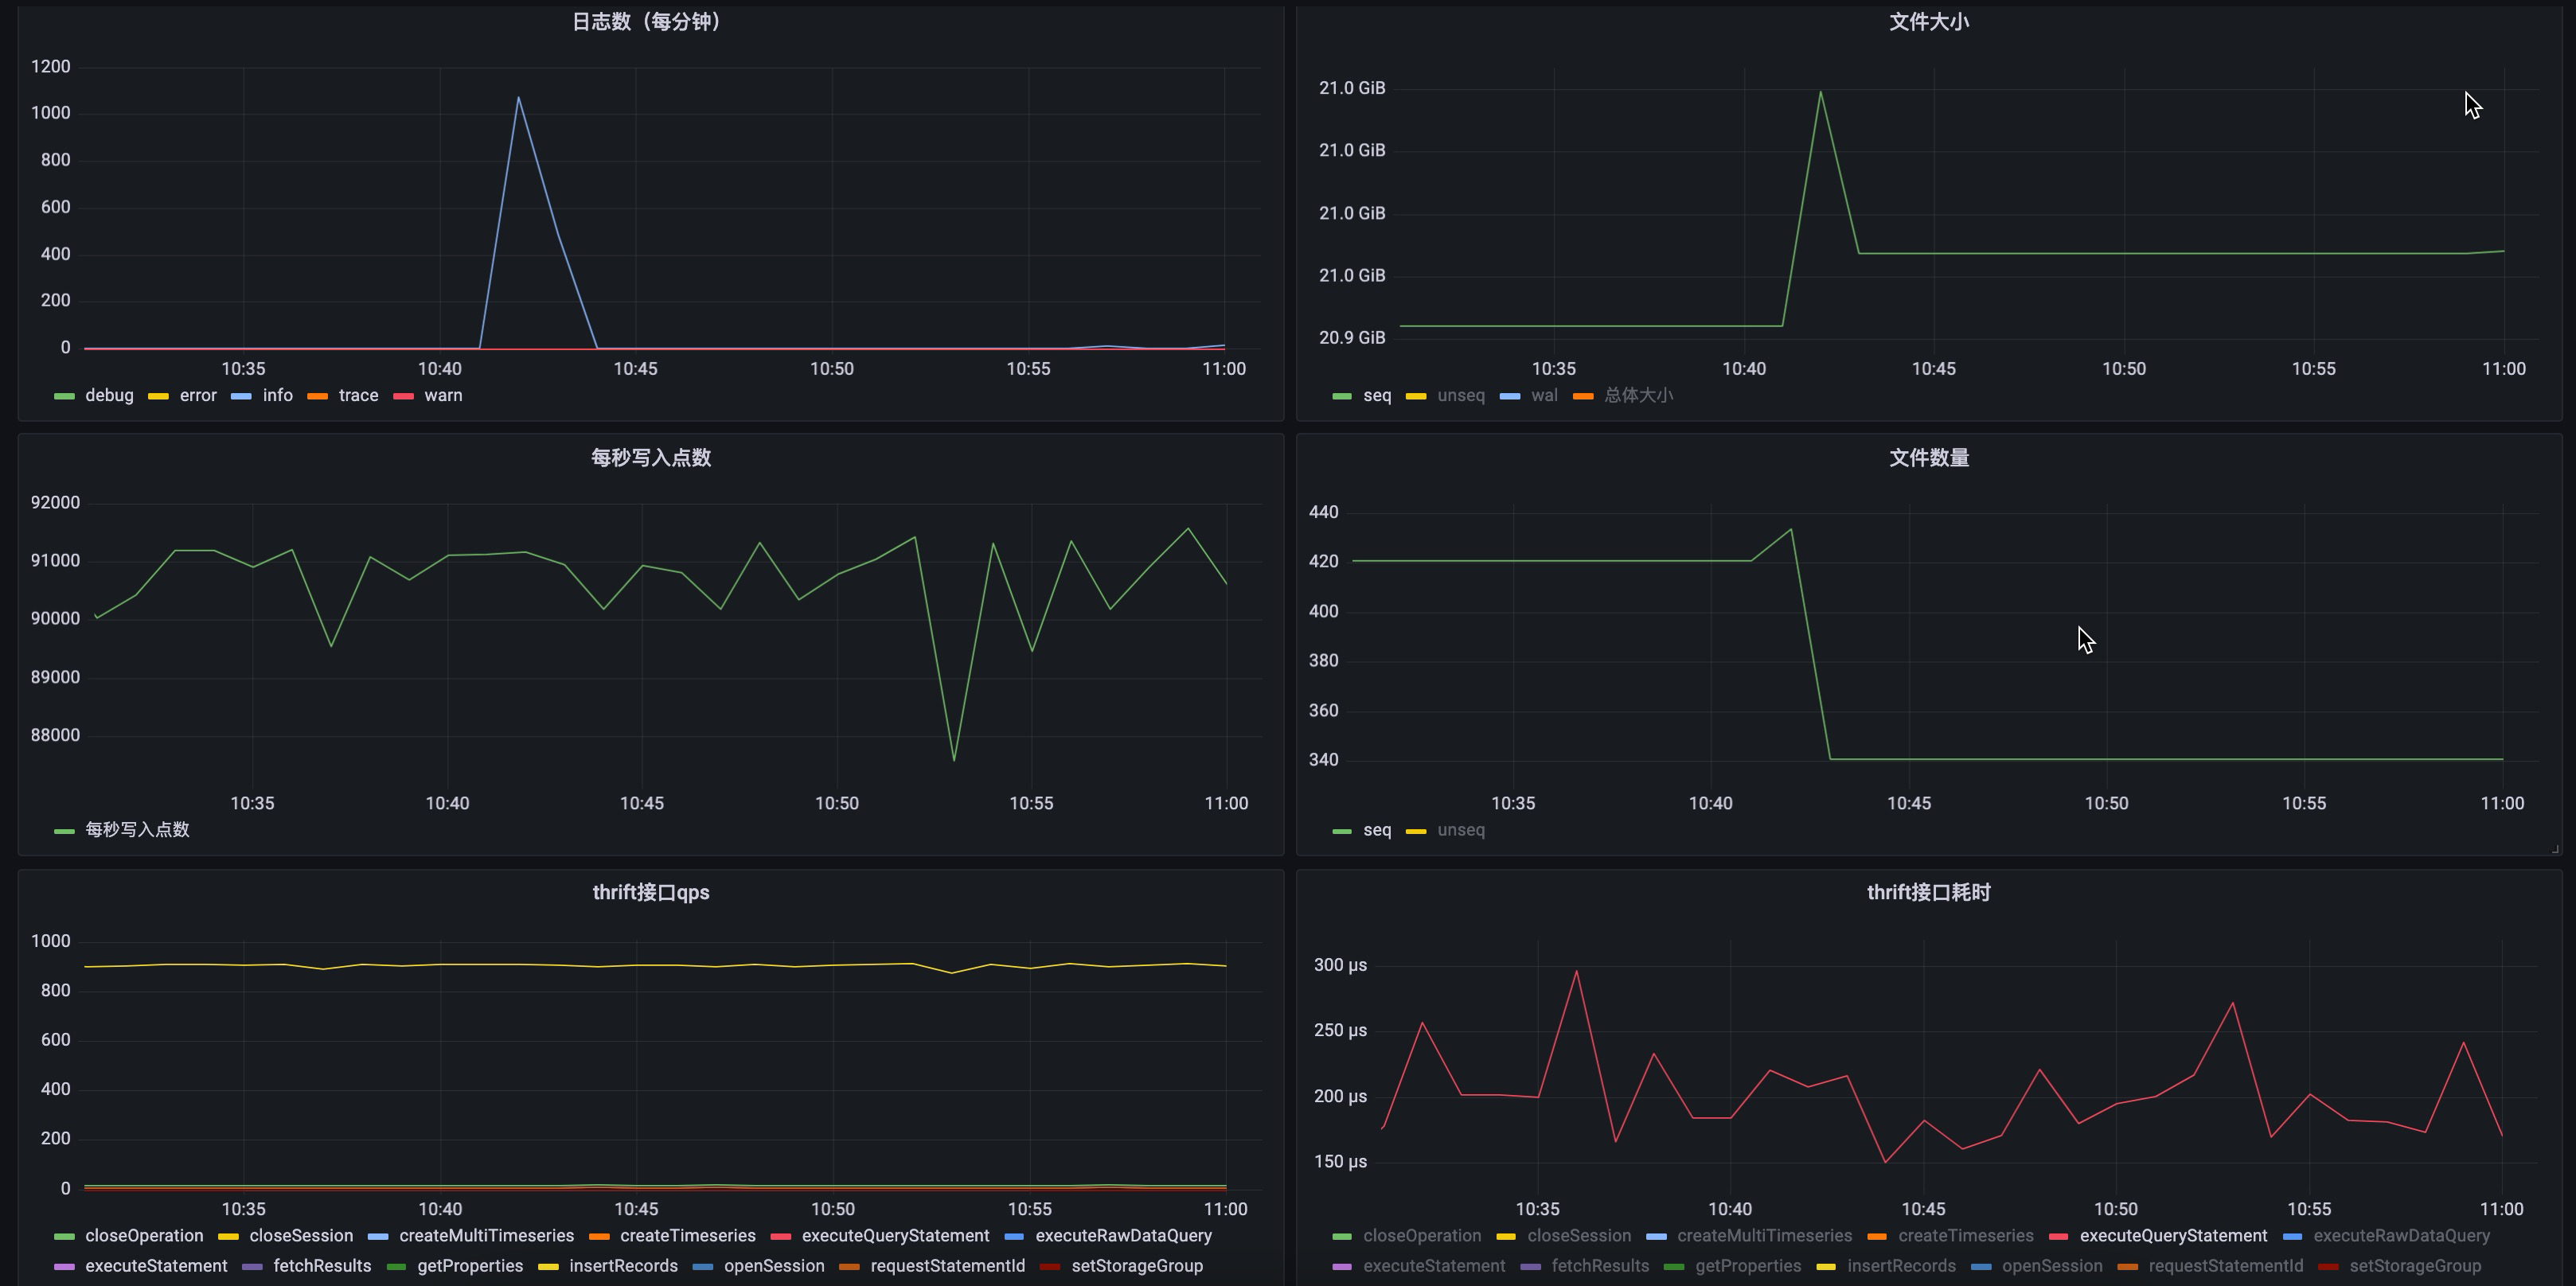
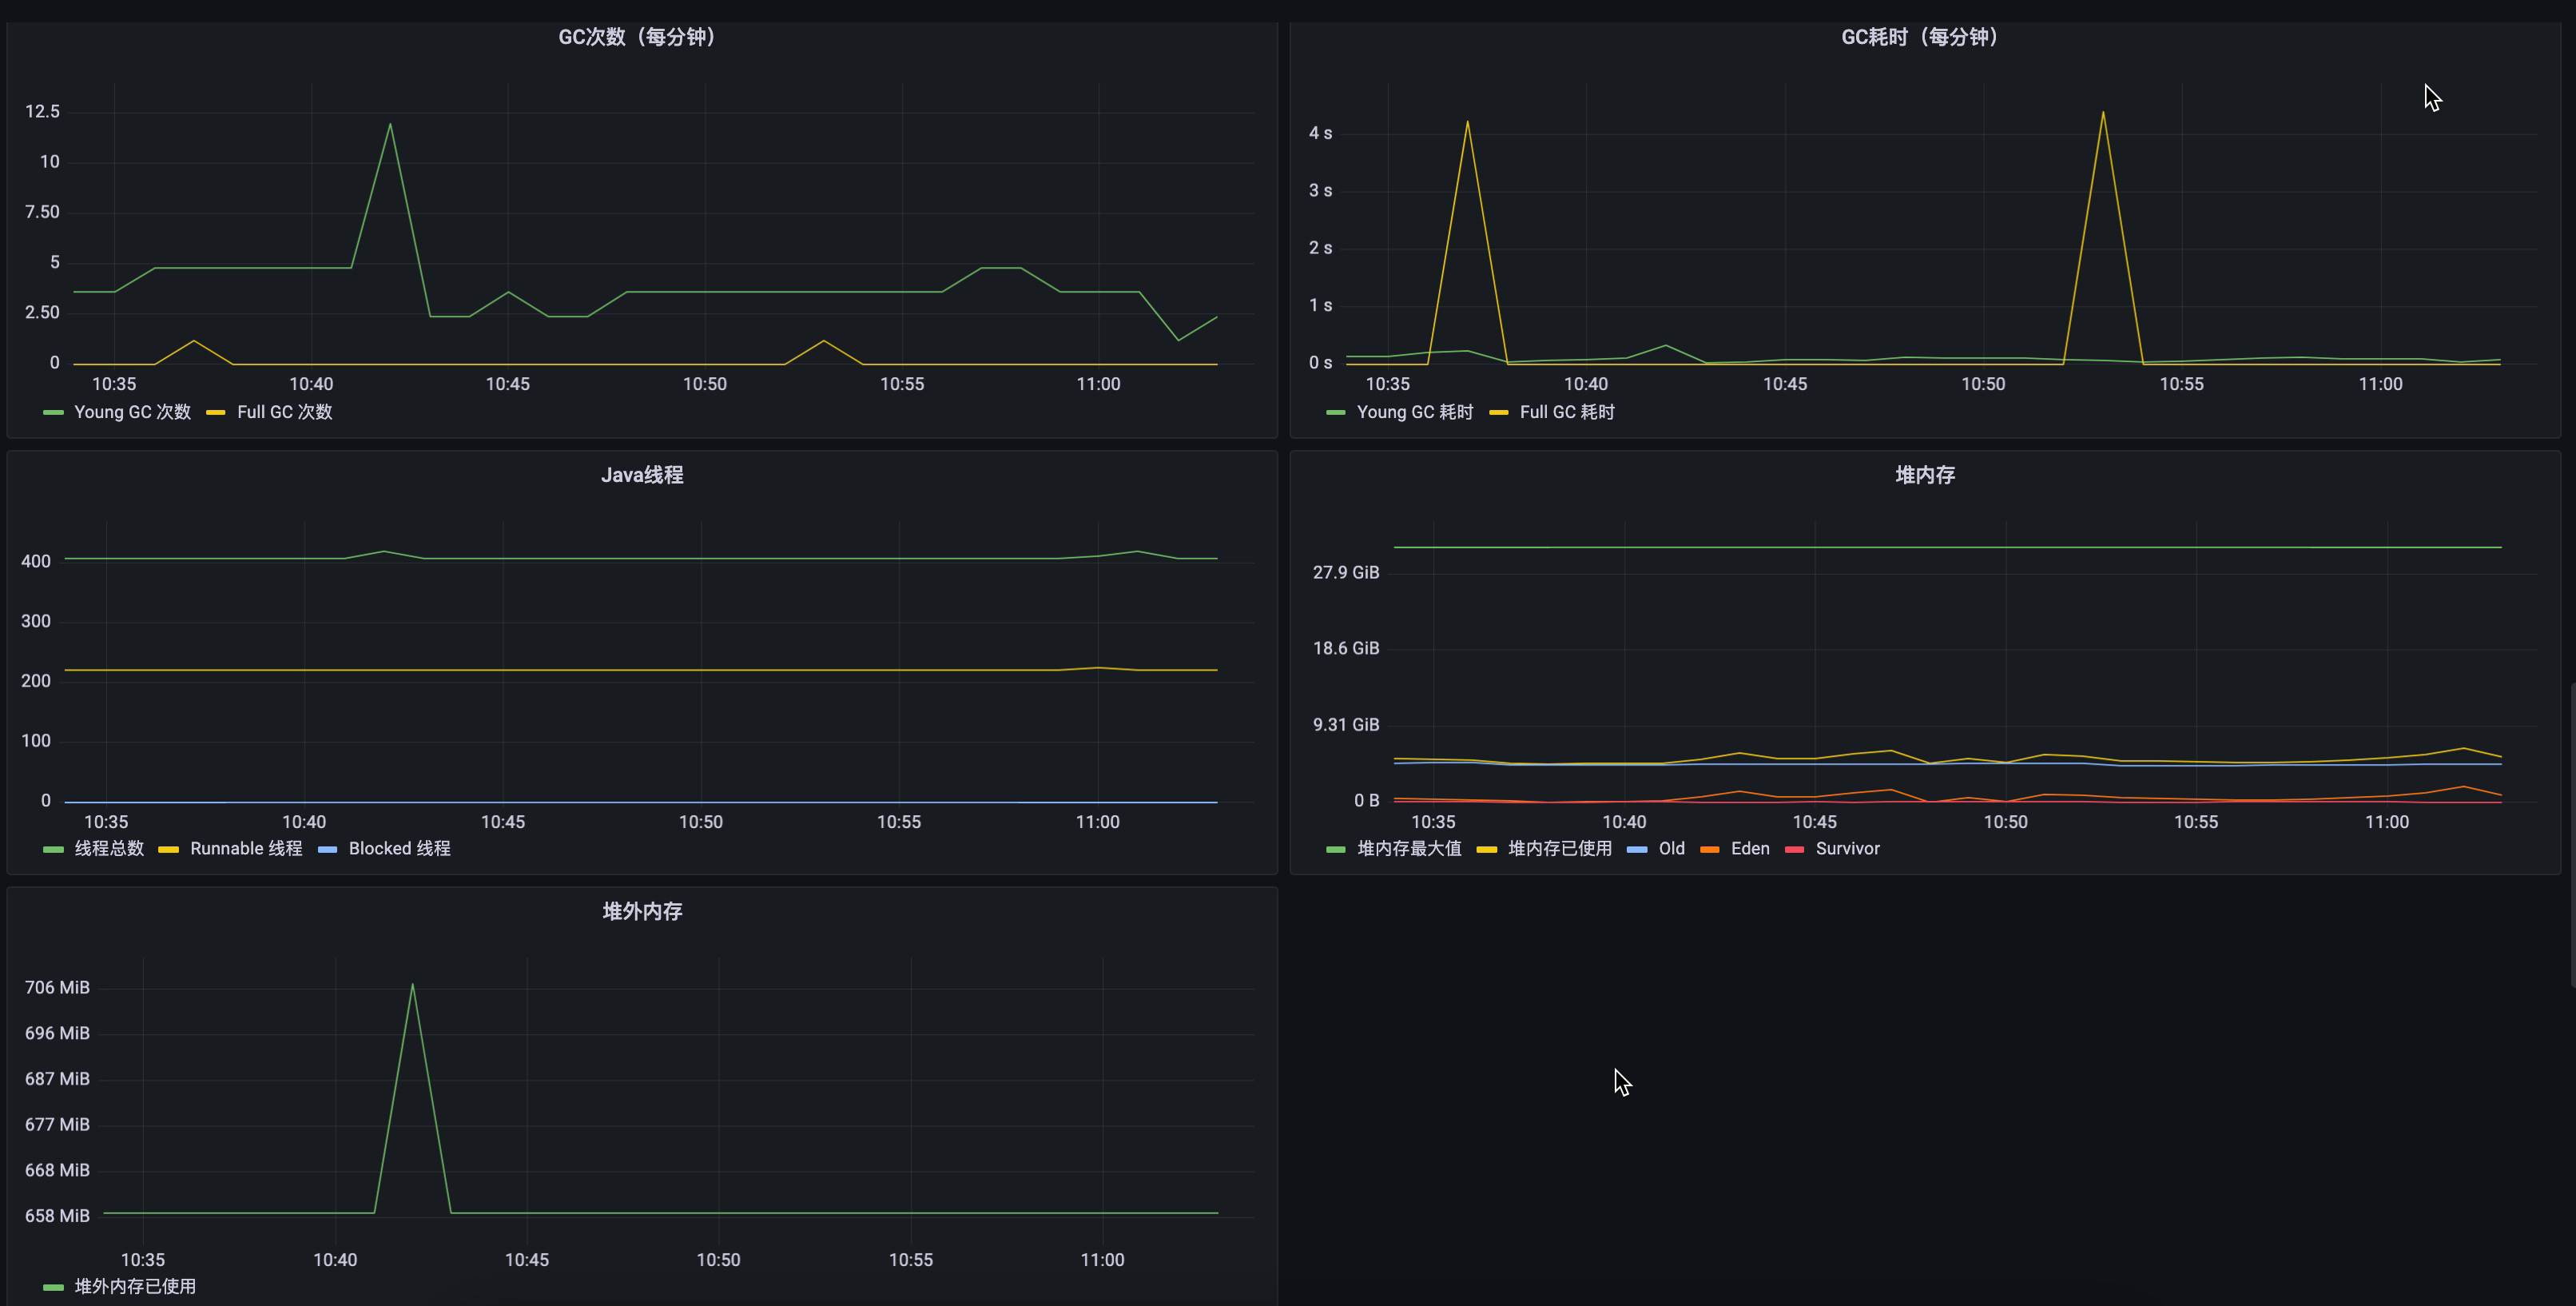
Here are two demo pictures of IoTDB's metrics data in Grafana.