在 IoTDB 的运行过程中,我们希望对 IoTDB 的状态进行观测,以便于排查系统问题或者及时发现系统潜在的风险,能够反映系统运行状态的一系列指标就是系统监控指标。
1. 什么场景下会使用到监控?
那么什么时候会用到监控框架呢?下面列举一些常见的场景。
系统变慢了
系统变慢几乎是最常见也最头疼的问题,这时候我们需要尽可能多的信息来帮助我们找到系统变慢的原因,比如:
- JVM信息:是不是有FGC?GC耗时多少?GC后内存有没有恢复?是不是有大量的线程?
- 系统信息:CPU使用率是不是太高了?磁盘IO是不是很频繁?
- 连接数:当前连接是不是太多?
- 接口:当前TPS是多少?各个接口耗时有没有变化?
- 线程池:系统中各种任务是否有积压?
- 缓存命中率
磁盘快满了
这时候我们迫切想知道最近一段时间数据文件的增长情况,看看是不是某种文件有突增。
系统运行是否正常
此时我们可能需要通过错误日志的数量、集群节点的状态等指标来判断系统是否在正常运行。
2. 什么人需要使用监控?
所有关注系统状态的人员都可以使用,包括但不限于研发、测试、运维、DBA等等
3. 什么是监控指标?
3.1. 监控指标名词解释
在 IoTDB 的监控模块,每个监控指标被 Metric Name 和 Tags 唯一标识。
Metric Name:指标类型名称,比如logback_events表示日志事件。Tags:指标分类,形式为Key-Value对,每个指标下面可以有0到多个分类,常见的Key-Value对:name = xxx:被监控对象的名称,是对业务逻辑的说明。比如对于Metric Name = entry_seconds_count类型的监控项,name的含义是指被监控的业务接口。type = xxx:监控指标类型细分,是对监控指标本身的说明。比如对于Metric Name = point类型的监控项,type的含义是指监控具体是什么类型的点数。status = xxx:被监控对象的状态,是对业务逻辑的说明。比如对于Metric Name = Task类型的监控项可以通过该参数,从而区分被监控对象的状态。user = xxx:被监控对象的相关用户,是对业务逻辑的说明。比如统计root用户的写入总点数。- 根据具体情况自定义:比如logback_events_total下有一个level的分类,用来表示特定级别下的日志数量。
Metric Level:指标管理级别,默认启动级别为Core级别,建议启动级别为Important级别,审核严格程度Core > Important > Normal > AllCore:系统的核心指标,供系统内核和运维人员使用,关乎系统的性能、稳定性、安全性,比如实例的状况,系统的负载等。Important:模块的重要指标,供运维和测试人员使用,直接关乎每个模块的运行状态,比如合并文件个数、执行情况等。Normal:模块的一般指标,供开发人员使用,方便在出现问题时定位模块,比如合并中的特定关键操作情况。All:模块的全部指标,供模块开发人员使用,往往在复现问题的时候使用,从而快速解决问题。
3.2. 监控指标对外获取数据格式
- IoTDB 对外提供 JMX、 Prometheus 和 IoTDB 格式的监控指标:
- 对于 JMX ,可以通过
org.apache.iotdb.metrics获取系统监控指标指标。 - 对于 Prometheus ,可以通过对外暴露的端口获取监控指标的值
- 对于 IoTDB 方式对外暴露:可以通过执行 IoTDB 的查询来获取监控指标
- 对于 JMX ,可以通过
4. 监控指标有哪些?
目前,IoTDB 对外提供一些主要模块的监控指标,并且随着新功能的开发以及系统优化或者重构,监控指标也会同步添加和更新。如果想自己在 IoTDB 中添加更多系统监控指标埋点,可以参考IoTDB Metrics Framework使用说明。
4.1. Core 级别监控指标
Core 级别的监控指标在系统运行中默认开启,每一个 Core 级别的监控指标的添加都需要经过谨慎的评估,目前 Core 级别的监控指标如下所述:
4.1.1. 集群运行状态
| Metric | Tags | Type | Description |
|---|---|---|---|
| config_node | name=“total”,status=“Registered/Online/Unknown” | AutoGauge | 已注册/在线/离线 confignode 的节点数量 |
| data_node | name=“total”,status=“Registered/Online/Unknown” | AutoGauge | 已注册/在线/离线 datanode 的节点数量 |
4.1.2. IoTDB 进程运行状态
| Metric | Tags | Type | Description |
|---|---|---|---|
| process_cpu_load | name=“process” | AutoGauge | IoTDB 进程的 CPU 占用率,单位为% |
| process_cpu_time | name=“process” | AutoGauge | IoTDB 进程占用的 CPU 时间,单位为ns |
| process_max_mem | name=“memory” | AutoGauge | IoTDB 进程最大可用内存 |
| process_total_mem | name=“memory” | AutoGauge | IoTDB 进程当前已申请内存 |
| process_free_mem | name=“memory” | AutoGauge | IoTDB 进程当前剩余可用内存 |
4.1.3. 系统运行状态
| Metric | Tags | Type | Description |
|---|---|---|---|
| sys_cpu_load | name=“system” | AutoGauge | 系统的 CPU 占用率,单位为% |
| sys_cpu_cores | name=“system” | Gauge | 系统的可用处理器数 |
| sys_total_physical_memory_size | name=“memory” | Gauge | 系统的最大物理内存 |
| sys_free_physical_memory_size | name=“memory” | AutoGauge | 系统的剩余可用内存 |
| sys_total_swap_space_size | name=“memory” | AutoGauge | 系统的交换区最大空间 |
| sys_free_swap_space_size | name=“memory” | AutoGauge | 系统的交换区剩余可用空间 |
| sys_committed_vm_size | name=“memory” | AutoGauge | 系统保证可用于正在运行的进程的虚拟内存量 |
| sys_disk_total_space | name=“disk” | AutoGauge | 系统磁盘总大小 |
| sys_disk_free_space | name=“disk” | AutoGauge | 系统磁盘可用大小 |
4.2. Important 级别监控指标
目前 Important 级别的监控指标如下所述:
4.2.1. 集群运行状态
| Metric | Tags | Type | Description |
|---|---|---|---|
| cluster_node_leader_count | name=“{{ip}}:{{port}}” | Gauge | 节点上共识组Leader的数量 |
| cluster_node_status | name=“{{ip}}:{{port}}”,type=“ConfigNode/DataNode” | Gauge | 节点的状态,0=Unkonwn 1=online |
4.2.2. 节点统计
| Metric | Tags | Type | Description |
|---|---|---|---|
| quantity | name=“database” | AutoGauge | 系统数据库数量 |
| quantity | name=“timeSeries” | AutoGauge | 系统时间序列数量 |
| quantity | name=“pointsIn” | Counter | 系统累计写入点数 |
| region | name=“total”,type=“SchemaRegion” | AutoGauge | 分区表中 SchemaRegion 总数量 |
| region | name=“total”,type=“DataRegion” | AutoGauge | 分区表中 DataRegion 总数量 |
| region | name=“{{ip}}:{{port}}”,type=“SchemaRegion” | Gauge | 分区表中对应节点上 DataRegion 总数量 |
| region | name=“{{ip}}:{{port}}”,type=“DataRegion” | Gauge | 分区表中对应节点上 DataRegion 总数量 |
4.2.3. IoT共识协议统计
| Metric | Tags | Type | Description |
|---|---|---|---|
| iot_consensus | name=“logDispatcher-{{IP}}:{{Port}}”, region=“{{region}}”, type=“currentSyncIndex” | AutoGauge | 副本组同步线程的当前同步进度 |
| iot_consensus | name=“logDispatcher-{{IP}}:{{Port}}”, region=“{{region}}”, type=“cachedRequestInMemoryQueue” | AutoGauge | 副本组同步线程缓存队列请求总大小 |
| iot_consensus | name=“IoTConsensusServerImpl”, region=“{{region}}”, type=“searchIndex” | AutoGauge | 副本组主流程写入进度 |
| iot_consensus | name=“IoTConsensusServerImpl”, region=“{{region}}”, type=“safeIndex” | AutoGauge | 副本组同步进度 |
| stage | name=“iot_consensus”, region=“{{region}}”, type=“getStateMachineLock” | Histogram | 主流程获取状态机锁耗时 |
| stage | name=“iot_consensus”, region=“{{region}}”, type=“checkingBeforeWrite” | Histogram | 主流程写入状态机检查耗时 |
| stage | name=“iot_consensus”, region=“{{region}}”, type=“writeStateMachine” | Histogram | 主流程写入状态机耗时 |
| stage | name=“iot_consensus”, region=“{{region}}”, type=“offerRequestToQueue” | Histogram | 主流程尝试添加队列耗时 |
| stage | name=“iot_consensus”, region=“{{region}}”, type=“consensusWrite” | Histogram | 主流程全写入耗时 |
| stage | name=“iot_consensus”, region=“{{region}}”, type=“constructBatch” | Histogram | 同步线程构造 Batch 耗时 |
| stage | name=“iot_consensus”, region=“{{region}}”, type=“syncLogTimePerRequest” | Histogram | 异步回调流程同步日志耗时 |
4.2.4. 缓存统计
| Metric | Tags | Type | Description |
|---|---|---|---|
| cache_hit | name=“chunk” | AutoGauge | ChunkCache的命中率,单位为% |
| cache_hit | name=“schema” | AutoGauge | SchemaCache的命中率,单位为% |
| cache_hit | name=“timeSeriesMeta” | AutoGauge | TimeseriesMetadataCache的命中率,单位为% |
| cache_hit | name=“bloomFilter” | AutoGauge | TimeseriesMetadataCache中的bloomFilter的拦截率,单位为% |
| cache | name=“Database”, type=“hit” | Counter | Database Cache 的命中次数 |
| cache | name=“Database”, type=“all” | Counter | Database Cache 的访问次数 |
| cache | name=“SchemaPartition”, type=“hit” | Counter | SchemaPartition Cache 的命中次数 |
| cache | name=“SchemaPartition”, type=“all” | Counter | SchemaPartition Cache 的访问次数 |
| cache | name=“DataPartition”, type=“hit” | Counter | DataPartition Cache 的命中次数 |
| cache | name=“DataPartition”, type=“all” | Counter | DataPartition Cache 的访问次数 |
4.2.5. 接口层统计
| Metric | Tags | Type | Description |
|---|---|---|---|
| operation | name = “{{name}}” | Histogram | 客户端执行的操作的耗时情况 |
| entry | name=“{{interface}}” | Timer | Client 建立的 Thrift 的耗时情况 |
| thrift_connections | name=“ConfigNodeRPC” | AutoGauge | ConfigNode 的内部 Thrift 连接数 |
| thrift_connections | name=“Internal” | AutoGauge | DataNode 的内部 Thrift 连接数 |
| thrift_connections | name=“MPPDataExchange” | AutoGauge | MPP 框架的内部 Thrift 连接数 |
| thrift_connections | name=“RPC” | AutoGauge | Client 建立的 Thrift 连接数 |
| thrift_active_threads | name=“ConfigNodeRPC-Service” | AutoGauge | ConfigNode 的内部活跃 Thrift 连接数 |
| thrift_active_threads | name=“DataNodeInternalRPC-Service” | AutoGauge | DataNode 的内部活跃 Thrift 连接数 |
| thrift_active_threads | name=“MPPDataExchangeRPC-Service” | AutoGauge | MPP 框架的内部活跃 Thrift 连接数 |
| thrift_active_threads | name=“ClientRPC-Service” | AutoGauge | Client 建立的活跃 Thrift 连接数 |
4.2.6. 内存统计
| Metric | Tags | Type | Description |
|---|---|---|---|
| mem | name=“database_{{name}}” | AutoGauge | DataNode内对应DataRegion的内存占用,单位为byte |
| mem | name=“chunkMetaData_{{name}}” | AutoGauge | 写入TsFile时的ChunkMetaData的内存占用,单位为byte |
| mem | name=“IoTConsensus” | AutoGauge | IoT共识协议的内存占用,单位为byte |
4.2.7. 任务统计
| Metric | Tags | Type | Description |
|---|---|---|---|
| queue | name=“compaction_inner”, status=“running/waiting” | Gauge | 空间内合并任务数 |
| queue | name=“compaction_cross”, status=“running/waiting” | Gauge | 跨空间合并任务数 |
| cost_task | name=“inner_compaction/cross_compaction/flush” | Gauge | 任务耗时情况 |
| queue | name=“flush”,status=“running/waiting” | AutoGauge | 刷盘任务数 |
| queue | name=“Sub_RawQuery”,status=“running/waiting” | AutoGauge | Sub_RawQuery任务数 |
4.2.8. 合并统计
| Metric | Tags | Type | Description |
|---|---|---|---|
| data_written | name=“compaction”, type=“aligned/not-aligned/total” | Counter | 合并时写入量 |
| data_read | name=“compaction” | Counter | 合并时的读取量 |
| compaction_task_count | name = “inner_compaction”, type=“sequence” | Counter | 顺序空间内合并次数 |
| compaction_task_count | name = “inner_compaction”, type=“unsequence” | Counter | 乱序空间内合并次数 |
| compaction_task_count | name = “cross_compaction”, type=“cross” | Counter | 跨空间合并次数 |
4.2.9. 文件统计信息
| Metric | Tags | Type | Description |
|---|---|---|---|
| file_size | name=“wal” | AutoGauge | 写前日志总大小,单位为byte |
| file_size | name=“seq” | AutoGauge | 顺序TsFile总大小,单位为byte |
| file_size | name=“unseq” | AutoGauge | 乱序TsFile总大小,单位为byte |
| file_count | name=“wal” | AutoGauge | 写前日志文件个数 |
| file_count | name=“seq” | AutoGauge | 顺序TsFile文件个数 |
| file_count | name=“unseq” | AutoGauge | 乱序TsFile文件个数 |
4.2.10. IoTDB 进程统计
| Metric | Tags | Type | Description |
|---|---|---|---|
| process_used_mem | name=“memory” | AutoGauge | IoTDB 进程当前使用内存 |
| process_mem_ratio | name=“memory” | AutoGauge | IoTDB 进程的内存占用比例 |
| process_threads_count | name=“process” | AutoGauge | IoTDB 进程当前线程数 |
| process_status | name=“process” | AutoGauge | IoTDB 进程存活状态,1为存活,0为终止 |
4.2.11. IoTDB 日志统计
| Metric | Tags | Type | Description |
|---|---|---|---|
| logback_events | level=“trace/debug/info/warn/error” | Counter | 不同类型的日志个数 |
4.2.12. JVM 线程统计
| Metric | Tags | Type | Description |
|---|---|---|---|
| jvm_threads_live_threads | AutoGauge | 当前线程数 | |
| jvm_threads_daemon_threads | AutoGauge | 当前 Daemon 线程数 | |
| jvm_threads_peak_threads | AutoGauge | 峰值线程数 | |
| jvm_threads_states_threads | state=“runnable/blocked/waiting/timed-waiting/new/terminated” | AutoGauge | 当前处于各种状态的线程数 |
4.2.13. JVM GC 统计
| Metric | Tags | Type | Description |
|---|---|---|---|
| jvm_gc_pause | action=“end of major GC/end of minor GC”,cause=“xxxx” | Timer | 不同原因的Young GC/Full GC的次数与耗时 |
| jvm_gc_concurrent_phase_time | action=“{{action}}”,cause=“{{cause}}” | Timer | 不同原因的Young GC/Full GC的次数与耗时 |
| jvm_gc_max_data_size_bytes | AutoGauge | 老年代内存的历史最大值 | |
| jvm_gc_live_data_size_bytes | AutoGauge | 老年代内存的使用值 | |
| jvm_gc_memory_promoted_bytes | Counter | 老年代内存正向增长累计值 | |
| jvm_gc_memory_allocated_bytes | Counter | GC分配内存正向增长累计值 |
4.2.14. JVM 内存统计
| Metric | Tags | Type | Description |
|---|---|---|---|
| jvm_buffer_memory_used_bytes | id=“direct/mapped” | AutoGauge | 已经使用的缓冲区大小 |
| jvm_buffer_total_capacity_bytes | id=“direct/mapped” | AutoGauge | 最大缓冲区大小 |
| jvm_buffer_count_buffers | id=“direct/mapped” | AutoGauge | 当前缓冲区数量 |
| jvm_memory_committed_bytes | {area=“heap/nonheap”,id=“xxx”,} | AutoGauge | 当前申请的内存大小 |
| jvm_memory_max_bytes | {area=“heap/nonheap”,id=“xxx”,} | AutoGauge | 最大内存 |
| jvm_memory_used_bytes | {area=“heap/nonheap”,id=“xxx”,} | AutoGauge | 已使用内存大小 |
4.2.15. JVM 类加载统计
| Metric | Tags | Type | Description |
|---|---|---|---|
| jvm_classes_unloaded_classes | AutoGauge | 累计卸载的class数量 | |
| jvm_classes_loaded_classes | AutoGauge | 累计加载的class数量 |
4.2.16. JVM 编译时间统计
| Metric | Tags | Type | Description |
|---|---|---|---|
| jvm_compilation_time_ms | {compiler=“HotSpot 64-Bit Tiered Compilers”,} | AutoGauge | 耗费在编译上的时间 |
4.3. All 级别监控指标
目前还没有All级别的监控指标,后续会持续添加。
5. 怎样获取这些系统监控?
- 监控模块的相关配置均在
conf/iotdb-{datanode/confignode}.properties中,所有配置项支持通过load configuration命令热加载。
5.1. 使用 JMX 方式
对于使用 JMX 对外暴露的指标,可以通过 Jconsole 来进行查看。在进入 Jconsole 监控页面后,首先会看到 IoTDB 的各类运行情况的概览。在这里,您可以看到堆内存信息、线程信息、类信息以及服务器的 CPU 使用情况。
5.1.1. 获取监控指标数据
连接到 JMX 后,您可以通过 “MBeans” 标签找到名为 “org.apache.iotdb.metrics” 的 “MBean”,可以在侧边栏中查看所有监控指标的具体值。
5.1.2. 获取其他相关数据
连接到 JMX 后,您可以通过 “MBeans” 标签找到名为 “org.apache.iotdb.service” 的 “MBean”,如下图所示,了解服务的基本状态
为了提高查询性能,IOTDB 对 ChunkMetaData 和 TsFileMetaData 进行了缓存。用户可以使用 MXBean ,展开侧边栏org.apache.iotdb.db.service查看缓存命中率:
5.2. 使用 Prometheus 方式
5.2.1. 监控指标的 Prometheus 映射关系
对于 Metric Name 为 name, Tags 为 K1=V1, ..., Kn=Vn 的监控指标有如下映射,其中 value 为具体值
| 监控指标类型 | 映射关系 |
|---|---|
| Counter | name_total{k1=“V1”, ..., Kn=“Vn”} value |
| AutoGauge、Gauge | name{k1=“V1”, ..., Kn=“Vn”} value |
| Histogram | name_max{k1=“V1”, ..., Kn=“Vn”} value name_sum{k1=“V1”, ..., Kn=“Vn”} value name_count{k1=“V1”, ..., Kn=“Vn”} value name{k1=“V1”, ..., Kn=“Vn”, quantile=“0.0”} value name{k1=“V1”, ..., Kn=“Vn”, quantile=“0.25”} value name{k1=“V1”, ..., Kn=“Vn”, quantile=“0.5”} value name{k1=“V1”, ..., Kn=“Vn”, quantile=“0.75”} value name{k1=“V1”, ..., Kn=“Vn”, quantile=“1.0”} value |
| Rate | name_total{k1=“V1”, ..., Kn=“Vn”} value name_total{k1=“V1”, ..., Kn=“Vn”, rate=“m1”} value name_total{k1=“V1”, ..., Kn=“Vn”, rate=“m5”} value name_total{k1=“V1”, ..., Kn=“Vn”, rate=“m15”} value name_total{k1=“V1”, ..., Kn=“Vn”, rate=“mean”} value |
| Timer | name_seconds_max{k1=“V1”, ..., Kn=“Vn”} value name_seconds_sum{k1=“V1”, ..., Kn=“Vn”} value name_seconds_count{k1=“V1”, ..., Kn=“Vn”} value name_seconds{k1=“V1”, ..., Kn=“Vn”, quantile=“0.0”} value name_seconds{k1=“V1”, ..., Kn=“Vn”, quantile=“0.25”} value name_seconds{k1=“V1”, ..., Kn=“Vn”, quantile=“0.5”} value name_seconds{k1=“V1”, ..., Kn=“Vn”, quantile=“0.75”} value name_seconds{k1=“V1”, ..., Kn=“Vn”, quantile=“1.0”} value |
5.2.2. 修改配置文件
- 以 DataNode 为例,修改 iotdb-datanode.properties 配置文件如下:
dn_metric_reporter_list=PROMETHEUS
dn_metric_level=CORE
dn_metric_prometheus_reporter_port=9091
启动 IoTDB DataNode
打开浏览器或者用
curl访问http://servier_ip:9091/metrics, 就能得到如下 metric 数据:
...
# HELP file_count
# TYPE file_count gauge
file_count{name="wal",} 0.0
file_count{name="unseq",} 0.0
file_count{name="seq",} 2.0
...
5.2.3. Prometheus + Grafana
如上所示,IoTDB 对外暴露出标准的 Prometheus 格式的监控指标数据,可以使用 Prometheus 采集并存储监控指标,使用 Grafana 可视化监控指标。
IoTDB、Prometheus、Grafana三者的关系如下图所示:
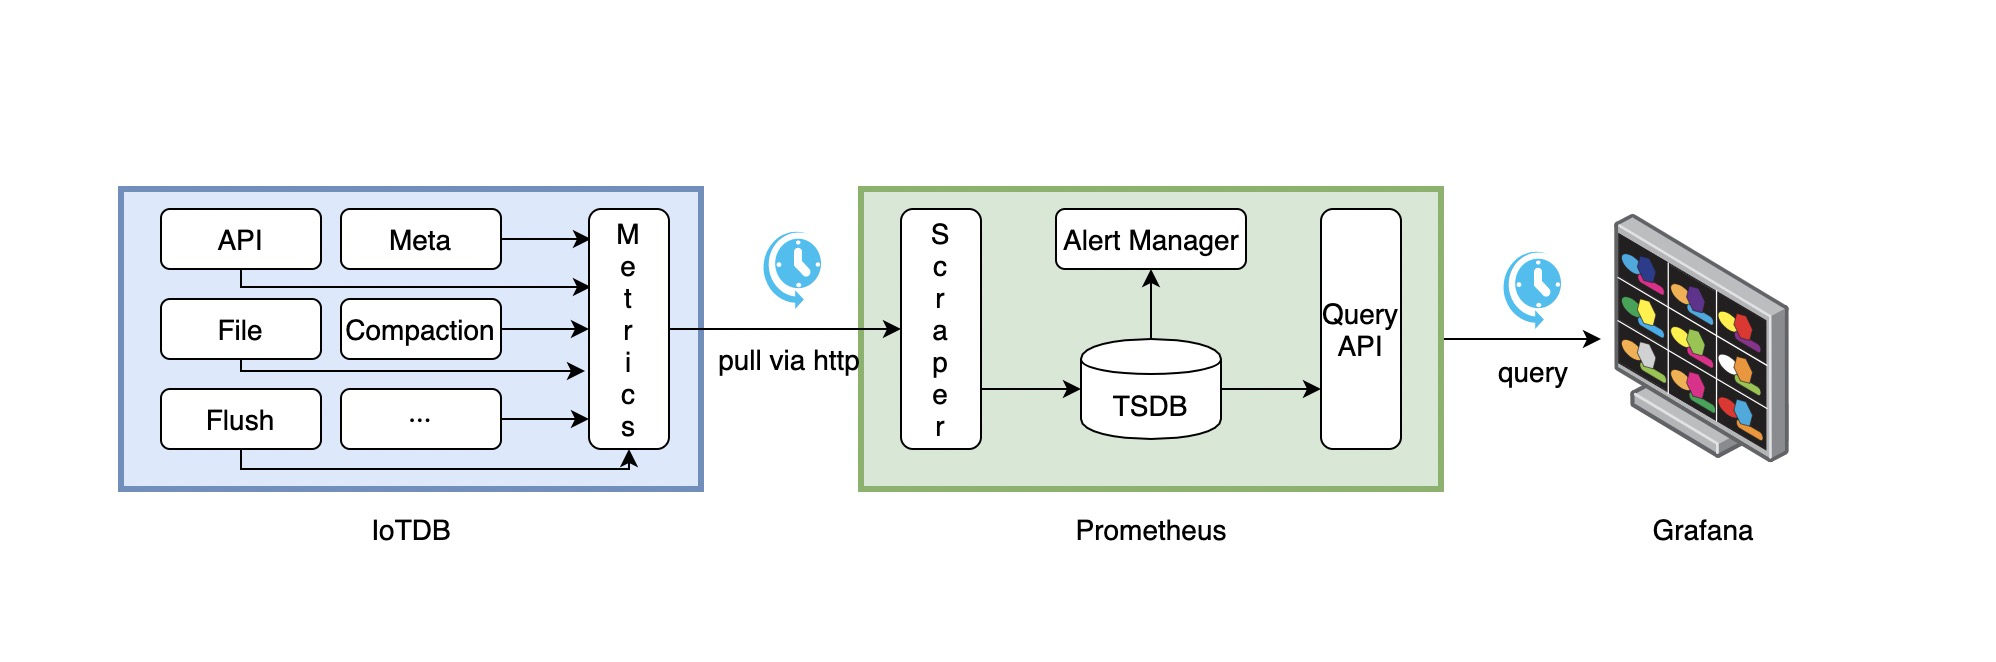
- IoTDB在运行过程中持续收集监控指标数据。
- Prometheus以固定的间隔(可配置)从IoTDB的HTTP接口拉取监控指标数据。
- Prometheus将拉取到的监控指标数据存储到自己的TSDB中。
- Grafana以固定的间隔(可配置)从Prometheus查询监控指标数据并绘图展示。
从交互流程可以看出,我们需要做一些额外的工作来部署和配置Prometheus和Grafana。
比如,你可以对Prometheus进行如下的配置(部分参数可以自行调整)来从IoTDB获取监控数据
job_name: pull-metrics
honor_labels: true
honor_timestamps: true
scrape_interval: 15s
scrape_timeout: 10s
metrics_path: /metrics
scheme: http
follow_redirects: true
static_configs:
  - targets:
      - localhost:9091
更多细节可以参考下面的文档:
Prometheus从HTTP接口拉取metrics数据的配置说明
5.2.4. Apache IoTDB Dashboard
我们提供了Apache IoTDB Dashboard,在Grafana中显示的效果图如下所示:

5.2.4.1. 如何获取 Apache IoTDB Dashboard?
- 您可以在 grafana-metrics-example 文件夹下获取到对应不同iotdb版本的Dashboard的json文件。
- 您可以访问Grafana Dashboard官网搜索
Apache IoTDB Dashboard并使用
在创建Grafana时,您可以选择Import刚刚下载的json文件,并为Apache IoTDB Dashboard选择对应目标数据源。
5.2.4.2. Apache IoTDB ConfigNode Dashboard 说明
除特殊说明的监控项以外,以下监控项均保证在Important级别的监控框架中可用。
Overview:系统概述Registered Node:注册的ConfigNode/DataNode个数DataNode:集群DataNode的存活状态,包括Online和Unknown两种。ConfigNode:集群ConfigNode的存活状态,包括Online和Unknown两种。The Status Of Node:集群具体节点运行状态,包括Online和Unkown两种。
Region:Region概述Region Number:Region个数,包括总个数,DataRegion 个数和 SchemaRegion 个数。Leadership distribution:集群 Leader 分布情况,指每个节点上对应 Region 的 Leader 的个数。Total Region in Node:不同 Node 的 Region 总数量。Region in Node:不同 Node 的 SchemaRegion/DataRegion 数量。Region in Database(Normal级别):不同 Database 的 Region 数量,包括 SchemaRegion、DataRegion。Slot in Database(Normal级别):不同 Database 的Slot数量,包括 DataSlot 数量和 SchemaSlot 数量。
System:系统CPU Core:系统 CPU 核数情况。CPU Load:系统 CPU 负载情况、进度 CPU 负载情况。CPU Time Per Minute:进程平均每分钟占用系统 CPU 时间,注意:多核会导致该值超过1分钟。System Memory:系统物理内存大小、系统使用物理内存大小、虚拟机提交的内存大小。System Swap Size:系统交换区总大小、系统交换区使用大小。Process Memory:IoTDB 进程最大内存总大小、IoTDB 进程总内存大小、IoTDB 进程使用内存大小。The Number of GC Per Minute:平均每分钟 GC 次数。The Time Consumed Of GC Per Minute:平均每分钟 GC 耗时。The Number Of Java Thread:IoTDB 进程的不同状态的线程数。Heap Memory:IoTDB 进程的堆内存Off Heap Memory:IoTDB 进程的堆外内存Log Number Per Minute:IoTDB 进程平均每分钟日志数The Time Consumed of Compliation Per Minute:平均每分钟编译耗时The Number Of Class:JVM 加载和卸载的类数量
5.2.4.3. Apache IoTDB DataNode Dashboard 说明
除特殊说明的监控项以外,以下监控项均保证在Important级别的监控框架中可用。
Overview:系统概述The Number Of Entity:实体数量,包含时间序列等Write Point Per Minute:每分钟系统平均写入点数Database Used Memory:每个 Database 使用的内存大小
Interface:接口The Time Consumed Of Operation(50%):不同客户端操作耗时的中位数The Time Consumed Of Operation(75%):不同客户端操作耗时的上四分位数The Time Consumed Of Operation(100%):不同客户端操作耗时的最大值The QPS of Interface:系统接口每秒钟访问次数The Time Consumed Of Interface:系统接口的平均耗时Cache Hit Rate:缓存命中率Thrift Connection:建立的 Thrift 连接个数Thrift Active Thread:建立的活跃的 Thrift 连接的个数
Engine:引擎Task Number:系统中不同状态的任务个数The Time Consumed Of Tasking:系统中不同状态的任务的耗时Compaction Read And Write Per Minute:平均每分钟合并读取和写入数据量Compaction R/W Ratio Per Minute:平均每分钟合并读取和写入数据比Compaction Number Per Minute:平均每分钟不同类型的合并任务数量
IoTConsensus:IoT共识协议IoTConsensus Used Memory:IoT共识层使用的内存大小IoTConsensus Sync Index:不同的Region的写入Index和同步IndexIoTConsensus Overview:不同节点的同步总差距、总缓存的请求个数The time consumed of different stages(50%):不同阶段耗时的中位数The time consumed of different stages(75%):不同阶段耗时的上四分位数The time consumed of different stages(100%):不同阶段耗时的最大值IoTConsensus Search Index Rate:不同region的写入Index的增长速度IoTConsensus Safe Index Rate:不同region的同步Index的增长速度IoTConsensus LogDispatcher Request Size:不同的LogDispatcherThread缓存的请求个数Sync Lag:每个region的同步index差距Min Peer Sync Lag:每个region的写入index和同步最快的LogDispatcherThread的同步index之间的差距Sync speed diff of Peers:每个region中同步最快的LogDispatcherThread与同步最慢的LogDispatcherThread之间的同步index差距
System:系统CPU Core:系统 CPU 核数情况。CPU Load:系统 CPU 负载情况、进度 CPU 负载情况。CPU Time Per Minute:进程平均每分钟占用系统 CPU 时间,注意:多核会导致该值超过1分钟。System Memory:系统物理内存大小、系统使用物理内存大小、虚拟机提交的内存大小。System Swap Size:系统交换区总大小、系统交换区使用大小。Process Memory:IoTDB 进程最大内存总大小、IoTDB 进程总内存大小、IoTDB 进程使用内存大小。The Size Of File:IoTDB系统相关的文件大小,包括wal下的文件总大小、seq下的tsfile文件总大小、unseq下的tsfile文件总大小The Number Of File:IoTDB系统相关的文件个数,包括wal下的文件个数、seq下的tsfile文件个数、unseq下的tsfile文件个数The Space Of Disk:当前data目录所挂载的磁盘总大小和剩余大小The Number of GC Per Minute:平均每分钟 GC 次数。The Time Consumed Of GC Per Minute:平均每分钟 GC 耗时。The Number Of Java Thread:IoTDB 进程的不同状态的线程数。Heap Memory:IoTDB 进程的堆内存Off Heap Memory:IoTDB 进程的堆外内存Log Number Per Minute:IoTDB 进程平均每分钟日志数The Time Consumed of Compliation Per Minute:平均每分钟编译耗时The Number Of Class:JVM 加载和卸载的类数量
5.3. 使用 IoTDB 方式
5.3.1. 监控指标的 IoTDB 映射关系
对于 Metric Name 为 name, Tags 为 K1=V1, ..., Kn=Vn 的监控指标有如下映射,以默认写到 root.__system.metric.
ip:port为例
| 监控指标类型 | 映射关系 |
|---|---|
| Counter | root.__system.metric.ip:port.name.K1=V1...Kn=Vn.value |
| AutoGauge、Gauge | root.__system.metric.ip:port.name.K1=V1...Kn=Vn.value |
| Histogram | root.__system.metric.ip:port.name.K1=V1...Kn=Vn.count root.__system.metric. ip:port.name.K1=V1...Kn=Vn.max root.__system.metric. ip:port.name.K1=V1...Kn=Vn.sum root.__system.metric. ip:port.name.K1=V1...Kn=Vn.p0 root.__system.metric. ip:port.name.K1=V1...Kn=Vn.p25 root.__system.metric. ip:port.name.K1=V1...Kn=Vn.p50 root.__system.metric. ip:port.name.K1=V1...Kn=Vn.p75 root.__system.metric. ip:port.name.K1=V1...Kn=Vn.p100 |
| Rate | root.__system.metric.ip:port.name.K1=V1...Kn=Vn.count root.__system.metric. ip:port.name.K1=V1...Kn=Vn.mean root.__system.metric. ip:port.name.K1=V1...Kn=Vn.m1 root.__system.metric. ip:port.name.K1=V1...Kn=Vn.m5 root.__system.metric. ip:port.name.K1=V1...Kn=Vn.m15 |
| Timer | root.__system.metric.ip:port.name.K1=V1...Kn=Vn.count root.__system.metric. ip:port.name.K1=V1...Kn=Vn.max root.__system.metric. ip:port.name.K1=V1...Kn=Vn.mean root.__system.metric. ip:port.name.K1=V1...Kn=Vn.sum root.__system.metric. ip:port.name.K1=V1...Kn=Vn.p0 root.__system.metric. ip:port.name.K1=V1...Kn=Vn.p25 root.__system.metric. ip:port.name.K1=V1...Kn=Vn.p50 root.__system.metric. ip:port.name.K1=V1...Kn=Vn.p75 root.__system.metric. ip:port.name.K1=V1...Kn=Vn.p100 root.__system.metric. ip:port.name.K1=V1...Kn=Vn.m1 root.__system.metric. ip:port.name.K1=V1...Kn=Vn.m5 root.__system.metric. ip:port.name.K1=V1...Kn=Vn.m15 |
5.3.2. 获取监控指标
根据如上的映射关系,可以构成相关的 IoTDB 查询语句获取监控指标