Along with IoTDB running, we hope to observe the status of IoTDB, so as to troubleshoot system problems or discover potential system risks in time. A series of metrics that can reflect the operating status of the system are system monitoring metrics.
1. When to use metric framework?
Belows are some typical application scenarios
System is running slowly
When system is running slowly, we always hope to have information about system's running status as detail as possible, such as:
- JVM:Is there FGC? How long does it cost? How much does the memory usage decreased after GC? Are there lots of threads?
- System:Is the CPU usage too hi?Are there many disk IOs?
- Connections:How many connections are there in the current time?
- Interface:What is the TPS and latency of every interface?
- Thread Pool:Are there many pending tasks?
- Cache Hit Ratio
No space left on device
When meet a “no space left on device” error, we really want to know which kind of data file had a rapid rise in the past hours.
Is the system running in abnormal status
We could use the count of error logs、the alive status of nodes in cluster, etc, to determine whether the system is running abnormally.
2. Who will use metric framework?
Any person cares about the system's status, including but not limited to RD, QA, SRE, DBA, can use the metrics to work more efficiently.
3. What is metrics?
3.1. Key Concept
In IoTDB's metric module, each metrics is uniquely identified by Metric Name and Tags.
Metric Name: Metric type name, such aslogback_eventsmeans log events.Tags: indicator classification, in the form of Key-Value pairs, each indicator can have 0 or more categories, common Key-Value pairs:name = xxx: The name of the monitored object, which is the description of business logic. For example, for a monitoring item of typeMetric Name = entry_seconds_count, the meaning of name refers to the monitored business interface.type = xxx: Monitoring indicator type subdivision, which is a description of monitoring indicator itself. For example, for monitoring items of typeMetric Name = point, the meaning of type refers to the specific type of monitoring points.status = xxx: The status of the monitored object is a description of business logic. For example, for monitoring items of typeMetric Name = Task, this parameter can be used to distinguish the status of the monitored object.user = xxx: The relevant user of the monitored object is a description of business logic. For example, count the total points written by therootuser.- Customize according to the specific situation: For example, there is a level classification under logback_events_total, which is used to indicate the number of logs under a specific level.
Metric Level: The level of metric managing level, The default startup level isCorelevel, the recommended startup level isImportant level, and the audit strictness isCore > Important > Normal > AllCore: Core metrics of the system, used by the operation and maintenance personnel, which is related to the performance, stability, and security of the system, such as the status of the instance, the load of the system, etc.Important: Important metrics of the module, which is used by operation and maintenance and testers, and is directly related to the running status of each module, such as the number of merged files, execution status, etc.Normal: Normal metrics of the module, used by developers to facilitate locating the module when problems occur, such as specific key operation situations in the merger.All: All metrics of the module, used by module developers, often used when the problem is reproduced, so as to solve the problem quickly.
3.2. External data format for metrics
- IoTDB provides metrics in JMX, Prometheus and IoTDB formats:
- For JMX, metrics can be obtained through
org.apache.iotdb.metrics. - For Prometheus, the value of the metrics can be obtained through the externally exposed port
- External exposure in IoTDB mode: metrics can be obtained by executing IoTDB queries
- For JMX, metrics can be obtained through
4. The detail of metrics
Currently, IoTDB provides metrics for some main modules externally, and with the development of new functions and system optimization or refactoring, metrics will be added and updated synchronously.
If you want to add your own metrics data in IoTDB, please see the [IoTDB Metric Framework] (https://github.com/apache/iotdb/tree/master/metrics) document.
4.1. Core level metrics
Core-level metrics are enabled by default during system operation. The addition of each Core-level metrics needs to be carefully evaluated. The current Core-level metrics are as follows:
4.1.1. Cluster
| Metric | Tags | Type | Description |
|---|---|---|---|
| config_node | name=“total”,status=“Registered/Online/Unknown” | AutoGauge | The number of registered/online/unknown confignodes |
| data_node | name=“total”,status=“Registered/Online/Unknown” | AutoGauge | The number of registered/online/unknown datanodes |
4.1.2. IoTDB process
| Metric | Tags | Type | Description |
|---|---|---|---|
| process_cpu_load | name=“process” | AutoGauge | The current CPU usage of IoTDB process, Unit: % |
| process_cpu_time | name=“process” | AutoGauge | The total CPU time occupied of IoTDB process, Unit: ns |
| process_max_mem | name=“memory” | AutoGauge | The maximum available memory of IoTDB process |
| process_total_mem | name=“memory” | AutoGauge | The current requested memory for IoTDB process |
| process_free_mem | name=“memory” | AutoGauge | The free available memory of IoTDB process |
4.1.3. System
| Metric | Tags | Type | Description |
|---|---|---|---|
| sys_cpu_load | name=“system” | AutoGauge | The current CPU usage of system, Unit: % |
| sys_cpu_cores | name=“system” | Gauge | The available number of CPU cores |
| sys_total_physical_memory_size | name=“memory” | Gauge | The maximum physical memory of system |
| sys_free_physical_memory_size | name=“memory” | AutoGauge | The current available memory of system |
| sys_total_swap_space_size | name=“memory” | AutoGauge | The maximum swap space of system |
| sys_free_swap_space_size | name=“memory” | AutoGauge | The available swap space of system |
| sys_committed_vm_size | name=“memory” | AutoGauge | The space of virtual memory available to running processes |
| sys_disk_total_space | name=“disk” | AutoGauge | The total disk space |
| sys_disk_free_space | name=“disk” | AutoGauge | The available disk space |
4.2. Important level metrics
4.2.1. Cluster
| Metric | Tags | Type | Description |
|---|---|---|---|
| cluster_node_leader_count | name=“{{ip}}:{{port}}” | Gauge | The count of consensus group leader on each node |
| cluster_node_status | name=“{{ip}}:{{port}}”,type=“ConfigNode/DataNode” | Gauge | The current node status, 0=Unkonwn 1=online |
4.2.2. Node
| Metric | Tags | Type | Description |
|---|---|---|---|
| quantity | name=“database” | AutoGauge | The number of database |
| quantity | name=“timeSeries” | AutoGauge | The number of timeseries |
| quantity | name=“pointsIn” | Counter | The number of write points |
| region | name=“total”,type=“SchemaRegion” | AutoGauge | The total number of SchemaRegion in PartitionTable |
| region | name=“total”,type=“DataRegion” | AutoGauge | The total number of DataRegion in PartitionTable |
| region | name=“{{ip}}:{{port}}”,type=“SchemaRegion” | Gauge | The number of SchemaRegion in PartitionTable of specific node |
| region | name=“{{ip}}:{{port}}”,type=“DataRegion” | Gauge | The number of DataRegion in PartitionTable of specific node |
4.2.3. IoTConsensus
| Metric | Tags | Type | Description |
|---|---|---|---|
| mutli_leader | name=“logDispatcher-{{IP}}:{{Port}}”, region=“{{region}}”, type=“currentSyncIndex” | AutoGauge | The sync index of synchronization thread in replica group |
| mutli_leader | name=“logDispatcher-{{IP}}:{{Port}}”, region=“{{region}}”, type=“cachedRequestInMemoryQueue” | AutoGauge | The size of cache requests of synchronization thread in replica group |
| mutli_leader | name=“IoTConsensusServerImpl”, region=“{{region}}”, type=“searchIndex” | AutoGauge | The write process of main process in replica group |
| mutli_leader | name=“IoTConsensusServerImpl”, region=“{{region}}”, type=“safeIndex” | AutoGauge | The sync index of replica group |
| stage | name=“iot_consensus”, region=“{{region}}”, type=“getStateMachineLock” | Histogram | The time consumed to get statemachine lock in main process |
| stage | name=“iot_consensus”, region=“{{region}}”, type=“checkingBeforeWrite” | Histogram | The time consumed to precheck before write in main process |
| stage | name=“iot_consensus”, region=“{{region}}”, type=“writeStateMachine” | Histogram | The time consumed to write statemachine in main process |
| stage | name=“iot_consensus”, region=“{{region}}”, type=“offerRequestToQueue” | Histogram | The time consumed to try to offer request to queue in main process |
| stage | name=“iot_consensus”, region=“{{region}}”, type=“consensusWrite” | Histogram | The time consumed to the whole write in main process |
| stage | name=“iot_consensus”, region=“{{region}}”, type=“constructBatch” | Histogram | The time consumed to construct batch in synchronization thread |
| stage | name=“iot_consensus”, region=“{{region}}”, type=“syncLogTimePerRequest” | Histogram | The time consumed to sync log in asynchronous callback process |
4.2.4. Cache
| Metric | Tags | Type | Description |
|---|---|---|---|
| cache_hit | name=“chunk” | AutoGauge | The cache hit ratio of ChunkCache, Unit: % |
| cache_hit | name=“schema” | AutoGauge | The cache hit ratio of SchemaCache, Unit: % |
| cache_hit | name=“timeSeriesMeta” | AutoGauge | The cache hit ratio of TimeseriesMetadataCache, Unit: % |
| cache_hit | name=“bloomFilter” | AutoGauge | The interception rate of bloomFilter in TimeseriesMetadataCache, Unit: % |
| cache | name=“Database”, type=“hit” | Counter | The hit number of Database Cache |
| cache | name=“Database”, type=“all” | Counter | The access number of Database Cache |
| cache | name=“SchemaPartition”, type=“hit” | Counter | The hit number of SchemaPartition Cache |
| cache | name=“SchemaPartition”, type=“all” | Counter | The access number of SSchemaPartition Cache |
| cache | name=“DataPartition”, type=“hit” | Counter | The hit number of DataPartition Cache |
| cache | name=“DataPartition”, type=“all” | Counter | The access number of SDataPartition Cache |
4.2.5. Interface
| Metric | Tags | Type | Description |
|---|---|---|---|
| operation | name = “{{name}}” | Histogram | The time consumed of operations in client |
| entry | name=“{{interface}}” | Timer | The time consumed of thrift operations |
| thrift_connections | name=“ConfigNodeRPC” | AutoGauge | The number of thrift internal connections in ConfigNode |
| thrift_connections | name=“Internal” | AutoGauge | The number of thrift internal connections in DataNode |
| thrift_connections | name=“MPPDataExchange” | AutoGauge | The number of thrift internal connections in MPP |
| thrift_connections | name=“RPC” | AutoGauge | The number of thrift connections of Client |
| thrift_active_threads | name=“ConfigNodeRPC-Service” | AutoGauge | The number of thrift active internal connections in ConfigNode |
| thrift_active_threads | name=“DataNodeInternalRPC-Service” | AutoGauge | The number of thrift active internal connections in DataNode |
| thrift_active_threads | name=“MPPDataExchangeRPC-Service” | AutoGauge | The number of thrift active internal connections in MPP |
| thrift_active_threads | name=“ClientRPC-Service” | AutoGauge | The number of thrift active connections of client |
4.2.6. Memory
| Metric | Tags | Type | Description |
|---|---|---|---|
| mem | name=“database_{{name}}” | AutoGauge | The memory usage of DataRegion in DataNode, Unit: byte |
| mem | name=“chunkMetaData_{{name}}” | AutoGauge | The memory usage of chunkMetaData when writting TsFile, Unit: byte |
| mem | name=“IoTConsensus” | AutoGauge | The memory usage of IoTConsensus, Unit: byte |
4.2.7. Task
| Metric | Tags | Type | Description |
|---|---|---|---|
| queue | name=“compaction_inner”, status=“running/waiting” | Gauge | The number of inner compaction tasks |
| queue | name=“compaction_cross”, status=“running/waiting” | Gauge | The number of cross compatcion tasks |
| cost_task | name=“inner_compaction/cross_compaction/flush” | Gauge | The time consumed of compaction tasks |
| queue | name=“flush”,status=“running/waiting” | AutoGauge | The number of flush tasks |
| queue | name=“Sub_RawQuery”,status=“running/waiting” | AutoGauge | The number of Sub_RawQuery |
4.2.8. Compaction
| Metric | Tags | Type | Description |
|---|---|---|---|
| data_written | name=“compaction”, type=“aligned/not-aligned/total” | Counter | The written size of compaction |
| data_read | name=“compaction” | Counter | The read size of compaction |
| compaction_task_count | name = “inner_compaction”, type=“sequence” | Counter | The number of inner sequence compction |
| compaction_task_count | name = “inner_compaction”, type=“unsequence” | Counter | The number of inner sequence compction |
| compaction_task_count | name = “cross_compaction”, type=“cross” | Counter | The number of corss compction |
4.2.9. File
| Metric | Tags | Type | Description |
|---|---|---|---|
| file_size | name=“wal” | AutoGauge | The size of WAL file, Unit: byte |
| file_size | name=“seq” | AutoGauge | The size of sequence TsFile, Unit: byte |
| file_size | name=“unseq” | AutoGauge | The size of unsequence TsFile, Unit: byte |
| file_count | name=“wal” | AutoGauge | The count of WAL file |
| file_count | name=“seq” | AutoGauge | The count of sequence TsFile |
| file_count | name=“unseq” | AutoGauge | The count of unsequence TsFile |
4.2.10. IoTDB Process
| Metric | Tags | Type | Description |
|---|---|---|---|
| process_used_mem | name=“memory” | AutoGauge | The used memory of IoTDB process |
| process_mem_ratio | name=“memory” | AutoGauge | The used memory ratio of IoTDB process |
| process_threads_count | name=“process” | AutoGauge | The number of thread of IoTDB process |
| process_status | name=“process” | AutoGauge | The status of IoTDB process, 1=live, 0=dead |
4.2.11. Log
| Metric | Tags | Type | Description |
|---|---|---|---|
| logback_events | level=“trace/debug/info/warn/error” | Counter | The number of log events |
4.2.12. JVM Thread
| Metric | Tags | Type | Description |
|---|---|---|---|
| jvm_threads_live_threads | AutoGauge | The number of live thread | |
| jvm_threads_daemon_threads | AutoGauge | The number of daemon thread | |
| jvm_threads_peak_threads | AutoGauge | The number of peak thread | |
| jvm_threads_states_threads | state=“runnable/blocked/waiting/timed-waiting/new/terminated” | AutoGauge | The number of thread in different states |
4.2.13. JVM GC
| Metric | Tags | Type | Description |
|---|---|---|---|
| jvm_gc_pause | action=“end of major GC/end of minor GC”,cause=“xxxx” | Timer | The number and time consumed of Young GC/Full Gc caused by different reason |
| jvm_gc_concurrent_phase_time | action=“{{action}}”,cause=“{{cause}}” | Timer | The number and time consumed of Young GC/Full Gc caused by different |
| jvm_gc_max_data_size_bytes | AutoGauge | The historical maximum value of old memory | |
| jvm_gc_live_data_size_bytes | AutoGauge | The usage of old memory | |
| jvm_gc_memory_promoted_bytes | Counter | The accumulative value of positive memory growth of old memory | |
| jvm_gc_memory_allocated_bytes | Counter | The accumulative value of positive memory growth of allocated memory |
4.2.14. JVM Memory
| Metric | Tags | Type | Description |
|---|---|---|---|
| jvm_buffer_memory_used_bytes | id=“direct/mapped” | AutoGauge | The used size of buffer |
| jvm_buffer_total_capacity_bytes | id=“direct/mapped” | AutoGauge | The max size of buffer |
| jvm_buffer_count_buffers | id=“direct/mapped” | AutoGauge | The number of buffer |
| jvm_memory_committed_bytes | {area=“heap/nonheap”,id=“xxx”,} | AutoGauge | The committed memory of JVM |
| jvm_memory_max_bytes | {area=“heap/nonheap”,id=“xxx”,} | AutoGauge | The max memory of JVM |
| jvm_memory_used_bytes | {area=“heap/nonheap”,id=“xxx”,} | AutoGauge | The used memory of JVM |
4.2.15. JVM Class
| Metric | Tags | Type | Description |
|---|---|---|---|
| jvm_classes_unloaded_classes | AutoGauge | The number of unloaded class | |
| jvm_classes_loaded_classes | AutoGauge | The number of loaded class |
4.2.16. JVM Compilation
| Metric | Tags | Type | Description |
|---|---|---|---|
| jvm_compilation_time_ms | {compiler=“HotSpot 64-Bit Tiered Compilers”,} | AutoGauge | The time consumed in compilation |
4.3. Normal level Metrics
4.3.1. Cluster
| Metric | Tags | Type | Description |
|---|---|---|---|
| region | name=“{{DatabaseName}}”,type=“SchemaRegion/DataRegion” | AutoGauge | The number of DataRegion/SchemaRegion of database in specific node |
| slot | name=“{{DatabaseName}}”,type=“schemaSlotNumber/dataSlotNumber” | AutoGauge | The number of DataSlot/SchemaSlot of database in specific node |
4.4. All Metric
Currently there is no All level metrics, and it will continue to be added in the future.
5. How to get these metrics?
The relevant configuration of the metric module is in conf/iotdb-{datanode/confignode}.properties, and all configuration items support hot loading through the load configuration command.
5.1. JMX
For metrics exposed externally using JMX, you can view them through Jconsole. After entering the Jconsole monitoring page, you will first see an overview of various running conditions of IoTDB. Here you can see heap memory information, thread information, class information, and the server's CPU usage.
5.1.1. Obtain metric data
After connecting to JMX, you can find the “MBean” named “org.apache.iotdb.metrics” through the “MBeans” tab, and you can view the specific values of all monitoring metrics in the sidebar.
5.1.2. Get other relevant data
After connecting to JMX, you can find the “MBean” named “org.apache.iotdb.service” through the “MBeans” tab, as shown in the image below, to understand the basic status of the service
In order to improve query performance, IOTDB caches ChunkMetaData and TsFileMetaData. Users can use MXBean and expand the sidebar org.apache.iotdb.db.service to view the cache hit ratio:
5.2. Prometheus
5.2.1. The mapping from metric type to prometheus forma
For metrics whose Metric Name is name and Tags are K1=V1, ..., Kn=Vn, the mapping is as follows, where value is a specific value
| Metric Type | Mapping |
|---|---|
| Counter | name_total{k1=“V1”, ..., Kn=“Vn”} value |
| AutoGauge、Gauge | name{k1=“V1”, ..., Kn=“Vn”} value |
| Histogram | name_max{k1=“V1”, ..., Kn=“Vn”} value name_sum{k1=“V1”, ..., Kn=“Vn”} value name_count{k1=“V1”, ..., Kn=“Vn”} value name{k1=“V1”, ..., Kn=“Vn”, quantile=“0.0”} value name{k1=“V1”, ..., Kn=“Vn”, quantile=“0.25”} value name{k1=“V1”, ..., Kn=“Vn”, quantile=“0.5”} value name{k1=“V1”, ..., Kn=“Vn”, quantile=“0.75”} value name{k1=“V1”, ..., Kn=“Vn”, quantile=“1.0”} value |
| Rate | name_total{k1=“V1”, ..., Kn=“Vn”} value name_total{k1=“V1”, ..., Kn=“Vn”, rate=“m1”} value name_total{k1=“V1”, ..., Kn=“Vn”, rate=“m5”} value name_total{k1=“V1”, ..., Kn=“Vn”, rate=“m15”} value name_total{k1=“V1”, ..., Kn=“Vn”, rate=“mean”} value |
| Timer | name_seconds_max{k1=“V1”, ..., Kn=“Vn”} value name_seconds_sum{k1=“V1”, ..., Kn=“Vn”} value name_seconds_count{k1=“V1”, ..., Kn=“Vn”} value name_seconds{k1=“V1”, ..., Kn=“Vn”, quantile=“0.0”} value name_seconds{k1=“V1”, ..., Kn=“Vn”, quantile=“0.25”} value name_seconds{k1=“V1”, ..., Kn=“Vn”, quantile=“0.5”} value name_seconds{k1=“V1”, ..., Kn=“Vn”, quantile=“0.75”} value name_seconds{k1=“V1”, ..., Kn=“Vn”, quantile=“1.0”} value |
5.2.2. Config File
- Taking DataNode as an example, modify the iotdb-datanode.properties configuration file as follows:
dn_metric_reporter_list=PROMETHEUS
dn_metric_level=CORE
dn_metric_prometheus_reporter_port=9091
Then you can get metrics data as follows
- Start IoTDB DataNodes
- Open a browser or use
curlto visithttp://servier_ip:9091/metrics, you can get the following metric data:
...
# HELP file_count
# TYPE file_count gauge
file_count{name="wal",} 0.0
file_count{name="unseq",} 0.0
file_count{name="seq",} 2.0
...
5.2.3. Prometheus + Grafana
As shown above, IoTDB exposes monitoring metrics data in the standard Prometheus format to the outside world. Prometheus can be used to collect and store monitoring indicators, and Grafana can be used to visualize monitoring indicators.
The following picture describes the relationships among IoTDB, Prometheus and Grafana
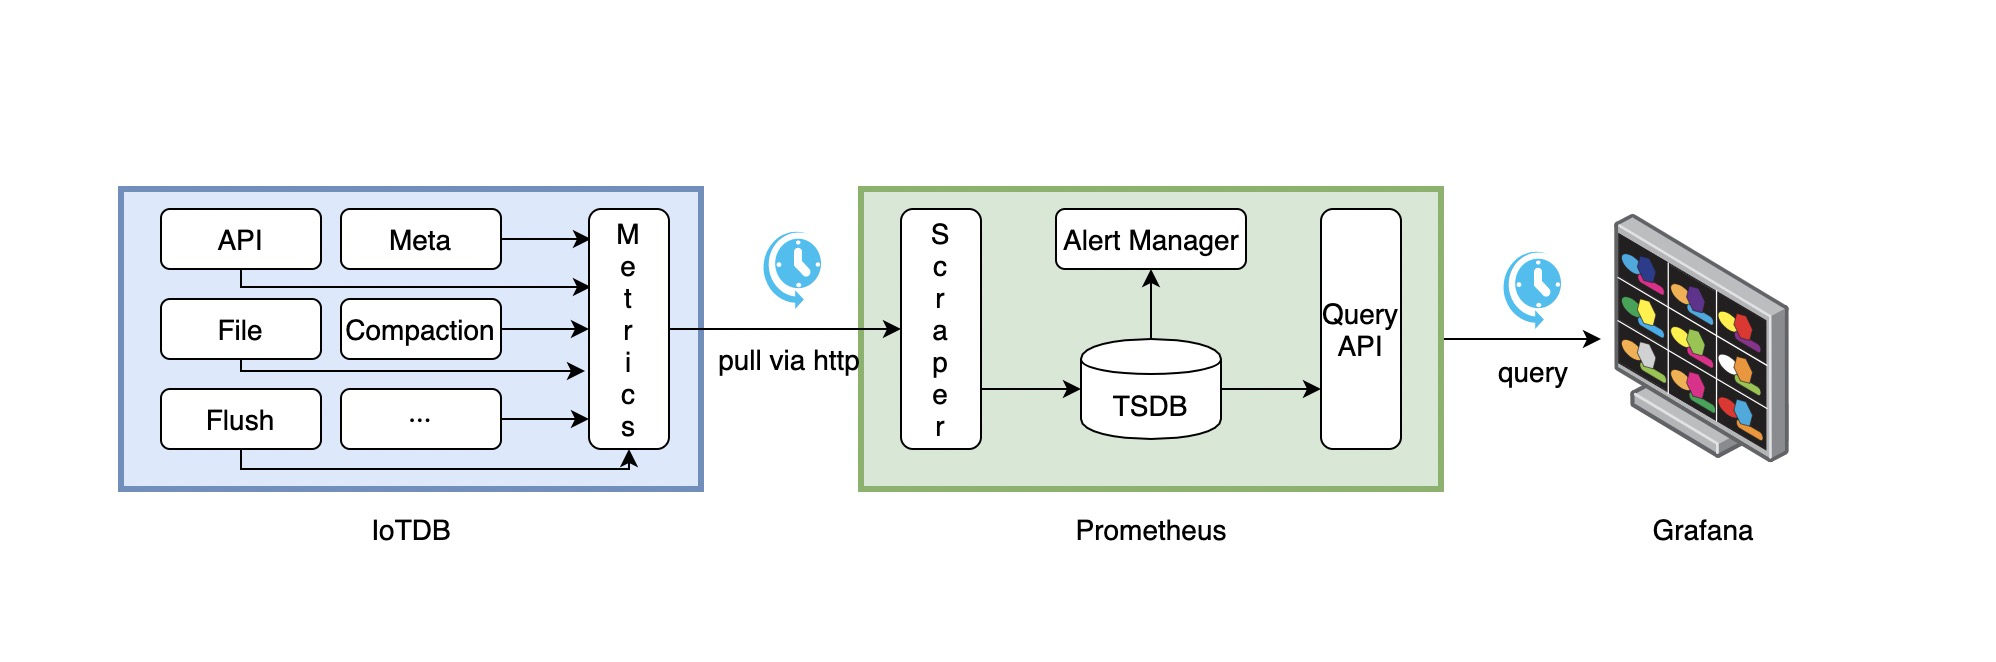
- Along with running, IoTDB will collect its metrics continuously.
- Prometheus scrapes metrics from IoTDB at a constant interval (can be configured).
- Prometheus saves these metrics to its inner TSDB.
- Grafana queries metrics from Prometheus at a constant interval (can be configured) and then presents them on the graph.
So, we need to do some additional works to configure and deploy Prometheus and Grafana.
For instance, you can config your Prometheus as follows to get metrics data from IoTDB:
job_name: pull-metrics
honor_labels: true
honor_timestamps: true
scrape_interval: 15s
scrape_timeout: 10s
metrics_path: /metrics
scheme: http
follow_redirects: true
static_configs:
- targets:
  - localhost:9091
The following documents may help you have a good journey with Prometheus and Grafana.
Grafana query metrics from Prometheus
5.2.4. Apache IoTDB Dashboard
We provide the Apache IoTDB Dashboard, and the rendering shown in Grafana is as follows:

5.2.4.1. How to get Apache IoTDB Dashboard
- You can obtain the json files of Dashboards corresponding to different iotdb versions in the grafana-metrics-example folder.
- You can visit Grafana Dashboard official website, search for
Apache IoTDB Dashboardand use
When creating Grafana, you can select the json file you just downloaded to Import and select the corresponding target data source for Apache IoTDB Dashboard.
5.2.4.2. Apache IoTDB ConfigNode Dashboard Instructions
Except for the metrics specified specially, the following metrics are guaranteed to be available in the monitoring framework at the Important levels.
Overview: system overviewRegistered Node: The number of registered ConfigNode/DataNodeDataNode: The status of the cluster DataNode, including Online and Unknown.ConfigNode: The status of the cluster ConfigNode, including Online and Unknown.The Status Of Node: The status of specific nodes in the cluster, including Online and Unknown.
Region: Region overviewRegion Number: the number of Regions, including the total number, the number of DataRegions and the number of SchemaRegions.Leadership distribution: Cluster leader distribution, which refers to the number of Leaders corresponding to the Region on each node.Total Region in Node: The total number of Regions of different Nodes.Region in Node: the number of SchemaRegions/DataRegions of different Nodes.Region in Database(Normal level): the number of Regions in different Databases, including SchemaRegion and DataRegion.Slot in Database(Normal level): The number of Slots in different Databases, including the number of DataSlots and SchemaSlots.
System: systemCPU Core: the number of CPU cores in the system.CPU Load: system CPU load, progress CPU load.CPU Time Per Minute: The process takes up the system CPU time per minute on average. Note: multi-core will cause this value to exceed 1 minute.System Memory: the physical memory size of the system, the physical memory size used by the system, and the memory size submitted by the virtual machine.System Swap Size: the total size of the system swap area, the size used by the system swap area.Process Memory: the maximum total memory size of the IoTDB process, the total memory size of the IoTDB process, and the memory size used by the IoTDB process.The Number of GC Per Minute: The average number of GC per minute.The Time Consumed Of GC Per Minute: Average GC time spent per minute.The Number Of Java Thread: The number of threads in different states of the IoTDB process.Heap Memory: the heap memory of the IoTDB processOff Heap Memory: the off-heap memory of the IoTDB processLog Number Per Minute: the average number of logs per minute of the IoTDB processThe Time Consumed of Compliation Per Minute: average compilation time per minuteThe Number Of Class: The number of classes loaded and unloaded by the JVM
5.2.4.3. Apache IoTDB DataNode Dashboard Instructions
Except for the metrics specified specially, the following metrics are guaranteed to be available in the monitoring framework at the Important levels.
Overview: system overviewThe Number Of Entity: the number of entities, including time series, etc.Write Point Per Minute: the average number of system write points per minuteDatabase Used Memory: the memory size used by each Database
Interface: interfaceThe Time Consumed Of Operation(50%): Median time spent by different client operationsThe Time Consumed Of Operation(75%): The upper quartile of the time consumed by different client operationsThe Time Consumed Of Operation(100%): The maximum time spent by different client operationsThe QPS of Interface: system interface visits per secondThe Time Consumed Of Interface: the average time consumed by the system interfaceCache Hit Rate: cache hit rateThrift Connection: the number of Thrift connections establishedThrift Active Thread: The number of active Thrift connections established
Engine:Task Number: the number of tasks in different states in the systemThe Time Consumed Of Tasking: Time consumption of tasks in different states in the systemCompaction Read And Write Per Minute: the average amount of combined read and write data per minuteCompaction R/W Ratio Per Minute: The average ratio of combined read and write data per minuteCompaction Number Per Minute: the average number of different types of consolidation tasks per minute
IoTConsensus:IoTConsensus Used Memory:The size of the memory used by IoTConsensus consensusIoTConsensus Sync Index:the searchIndex and safeIndex of regionIoTConsensus Overview:The total sync lag and total size of buffered requests of nodeThe time consumed of different stages(50%):The median of the time consumed of different stagesThe time consumed of different stages(75%):The upper quartile of the time consumed of different stagesThe time consumed of different stages(100%):The max of the time consumed of different stagesIoTConsensus Search Index Rate:The increasing rate of searchIndex of regionIoTConsensus Safe Index Rate:The increasing rate of safeIndex of regionIoTConsensus LogDispatcher Request Size:The number of requests buffered in logDispatcherSync Lag:The sync lag of regionMin Peer Sync Lag:The sync lag between the searchIndex of IoTConsensusServerImpl and the max currentSyncIndex of LogDispatcherSync speed diff of Peers:The sync lag between the max currentSyncIndex of LogDispatcher and the min currentSyncIndex of LogDispatcher
System: systemCPU Core: the number of CPU cores in the system.CPU Load: system CPU load, progress CPU load.CPU Time Per Minute: The process takes up the system CPU time per minute on average. Note: multi-core will cause this value to exceed 1 minute.System Memory: the physical memory size of the system, the physical memory size used by the system, and the memory size submitted by the virtual machine.System Swap Size: the total size of the system swap area, the size used by the system swap area.Process Memory: the maximum total memory size of the IoTDB process, the total memory size of the IoTDB process, and the memory size used by the IoTDB process.The Size Of File: IoTDB system-related file size, including the total file size under wal, the total size of tsfile files under seq, and the total size of tsfile files under unseqThe Number Of File: the number of files related to the IoTDB system, including the number of files under wal, the number of tsfile files under seq, and the number of tsfile files under unseqThe Space Of Disk: the total size and remaining size of the disk mounted in the current data directoryThe Number of GC Per Minute: The average number of GC per minute.The Time Consumed Of GC Per Minute: Average GC time spent per minute.The Number Of Java Thread: The number of threads in different states of the IoTDB process.Heap Memory: the heap memory of the IoTDB processOff Heap Memory: the off-heap memory of the IoTDB processLog Number Per Minute: the average number of logs per minute of the IoTDB processThe Time Consumed of Compliation Per Minute: average compilation time per minuteThe Number Of Class: The number of classes loaded and unloaded by the JVM
5.3. IoTDB
5.3.1. IoTDB mapping relationship of metrics
For metrics whose Metric Name is name and Tags are K1=V1, ..., Kn=Vn, the mapping is as follows, taking root.__system.metric.
ip:portas an example by default
| Metric Type | Mapping |
|---|---|
| Counter | root.__system.metric.ip:port.name.K1=V1...Kn=Vn.value |
| AutoGauge、Gauge | root.__system.metric.ip:port.name.K1=V1...Kn=Vn.value |
| Histogram | root.__system.metric.ip:port.name.K1=V1...Kn=Vn.count root.__system.metric. ip:port.name.K1=V1...Kn=Vn.max root.__system.metric. ip:port.name.K1=V1...Kn=Vn.sum root.__system.metric. ip:port.name.K1=V1...Kn=Vn.p0 root.__system.metric. ip:port.name.K1=V1...Kn=Vn.p25 root.__system.metric. ip:port.name.K1=V1...Kn=Vn.p50 root.__system.metric. ip:port.name.K1=V1...Kn=Vn.p75 root.__system.metric. ip:port.name.K1=V1...Kn=Vn.p100 |
| Rate | root.__system.metric.ip:port.name.K1=V1...Kn=Vn.count root.__system.metric. ip:port.name.K1=V1...Kn=Vn.mean root.__system.metric. ip:port.name.K1=V1...Kn=Vn.m1 root.__system.metric. ip:port.name.K1=V1...Kn=Vn.m5 root.__system.metric. ip:port.name.K1=V1...Kn=Vn.m15 |
| Timer | root.__system.metric.ip:port.name.K1=V1...Kn=Vn.count root.__system.metric. ip:port.name.K1=V1...Kn=Vn.max root.__system.metric. ip:port.name.K1=V1...Kn=Vn.mean root.__system.metric. ip:port.name.K1=V1...Kn=Vn.sum root.__system.metric. ip:port.name.K1=V1...Kn=Vn.p0 root.__system.metric. ip:port.name.K1=V1...Kn=Vn.p25 root.__system.metric. ip:port.name.K1=V1...Kn=Vn.p50 root.__system.metric. ip:port.name.K1=V1...Kn=Vn.p75 root.__system.metric. ip:port.name.K1=V1...Kn=Vn.p100 root.__system.metric. ip:port.name.K1=V1...Kn=Vn.m1 root.__system.metric. ip:port.name.K1=V1...Kn=Vn.m5 root.__system.metric. ip:port.name.K1=V1...Kn=Vn.m15 |
5.3.2. Obtain metrics
According to the above mapping relationship, related IoTDB query statements can be formed to obtain metrics