| <!-- |
| |
| Licensed to the Apache Software Foundation (ASF) under one |
| or more contributor license agreements. See the NOTICE file |
| distributed with this work for additional information |
| regarding copyright ownership. The ASF licenses this file |
| to you under the Apache License, Version 2.0 (the |
| "License"); you may not use this file except in compliance |
| with the License. You may obtain a copy of the License at |
| |
| http://www.apache.org/licenses/LICENSE-2.0 |
| |
| Unless required by applicable law or agreed to in writing, |
| software distributed under the License is distributed on an |
| "AS IS" BASIS, WITHOUT WARRANTIES OR CONDITIONS OF ANY |
| KIND, either express or implied. See the License for the |
| specific language governing permissions and limitations |
| under the License. |
| |
| --> |
| |
| # 监控面板安装部署 |
| 从 Apache IoTDB 1.0 版本开始,我们引入了系统监控模块,可以完成对 Apache IoTDB 的重要运行指标进行监控,本文介绍了如何在 Apache IoTDB 分布式开启系统监控模块,并且使用 Prometheus + Grafana 的方式完成对系统监控指标的可视化。 |
| |
| ## 前期准备 |
| |
| ### 软件要求 |
| |
| 1. Apache IoTDB:1.0 版本及以上,可以前往官网下载:https://iotdb.apache.org/Download/ |
| 2. Prometheus:2.30.3 版本及以上,可以前往官网下载:https://prometheus.io/download/ |
| 3. Grafana:8.4.2 版本及以上,可以前往官网下载:https://grafana.com/grafana/download |
| 4. IoTDB-Grafana安装包:Grafana看板为TimechoDB(基于IoTDB的企业版数据库)工具,您可联系您的销售获取相关安装包 |
| |
| ### 集群要求 |
| |
| 进行以下操作前请确认IoTDB集群已启动。 |
| |
| ### 说明 |
| |
| 本文将在一台机器(1 个 ConfigNode 和 1 个 DataNode)环境上进行监控面板搭建,其他集群配置是类似的,用户可以根据自己的集群情况(ConfigNode 和 DataNode 的数量)进行配置调整。本文搭建的集群的基本配置信息如下表所示。 |
| |
| | 集群角色 | 节点IP | 监控模块推送器 | 监控模块级别 | 监控 Port | |
| | ---------- | --------- | -------------- | ------------ | --------- | |
| | ConfigNode | 127.0.0.1 | PROMETHEUS | IMPORTANT | 9091 | |
| | DataNode | 127.0.0.1 | PROMETHEUS | IMPORTANT | 9093 | |
| |
| ## 配置 Prometheus 采集监控指标 |
| |
| 1. 下载安装包。下载Prometheus的二进制包到本地,解压后进入对应文件夹: |
| |
| ```Shell |
| tar xvfz prometheus-*.tar.gz |
| cd prometheus-* |
| ``` |
| |
| 2. 修改配置。修改Prometheus的配置文件prometheus.yml如下 |
| a. 新增 confignode 任务收集 ConfigNode 的监控数据 |
| b. 新增 datanode 任务收集 DataNode 的监控数据 |
| |
| ```YAML |
| global: |
| scrape_interval: 15s |
| |
| scrape_configs: |
| - job_name: "prometheus" |
| static_configs: |
| - targets: ["localhost:9090"] |
| - job_name: "confignode" |
| static_configs: |
| - targets: ["localhost:9091"] |
| honor_labels: true |
| - job_name: "datanode" |
| static_configs: |
| - targets: ["localhost:9093"] |
| honor_labels: true |
| ``` |
| |
| 3. 启动Promethues。Prometheus 监控数据的默认过期时间为 15d。在生产环境中,建议将其调整为 180d 以上,以对更长时间的历史监控数据进行追踪,启动命令如下所示: |
| |
| ```Shell |
| ./prometheus --config.file=prometheus.yml --storage.tsdb.retention.time=180d |
| ``` |
| |
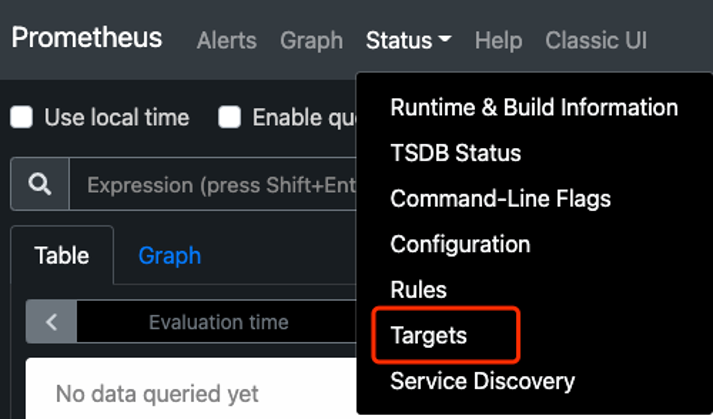
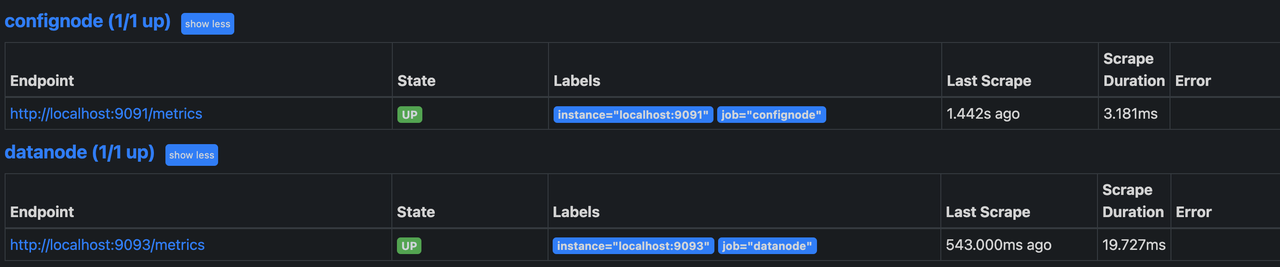
| 4. 确认启动成功。在浏览器中输入 http://localhost:9090,进入Prometheus,点击进入Status下的Target界面(如下图1),当看到State均为Up时表示配置成功并已经联通(如下图2),点击左侧链接可以跳转到网页监控。 |
| |
|  |
|  |
| |
| |
| |
| ## 使用 Grafana 查看监控数据 |
| |
| ### Step1:Grafana 安装、配置与启动 |
| |
| 1. 下载Grafana的二进制包到本地,解压后进入对应文件夹: |
| |
| ```Shell |
| tar -zxvf grafana-*.tar.gz |
| cd grafana-* |
| ``` |
| |
| 2. 启动Grafana并进入: |
| |
| ```Shell |
| ./bin/grafana-server web |
| ``` |
| |
| 3. 在浏览器中输入 http://localhost:3000,进入Grafana,默认初始用户名和密码均为 admin。 |
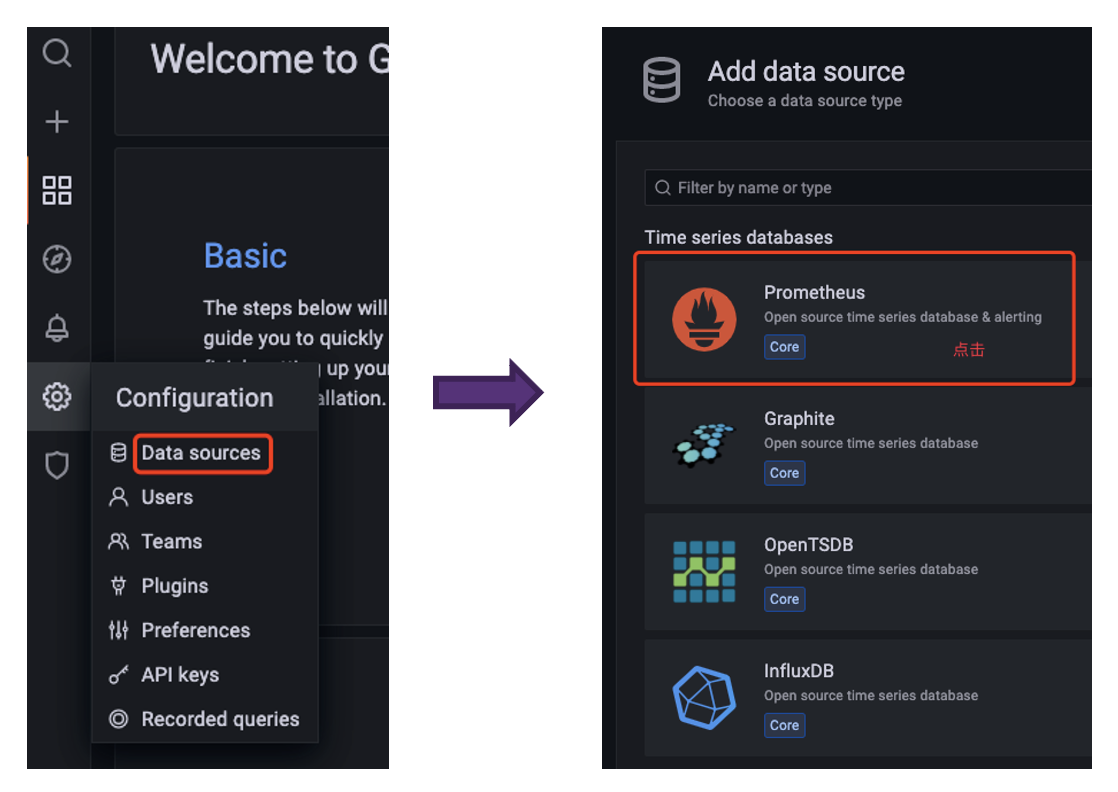
| 4. 首先我们在 Configuration 中配置 Data Source 为 Prometheus |
| |
|  |
| |
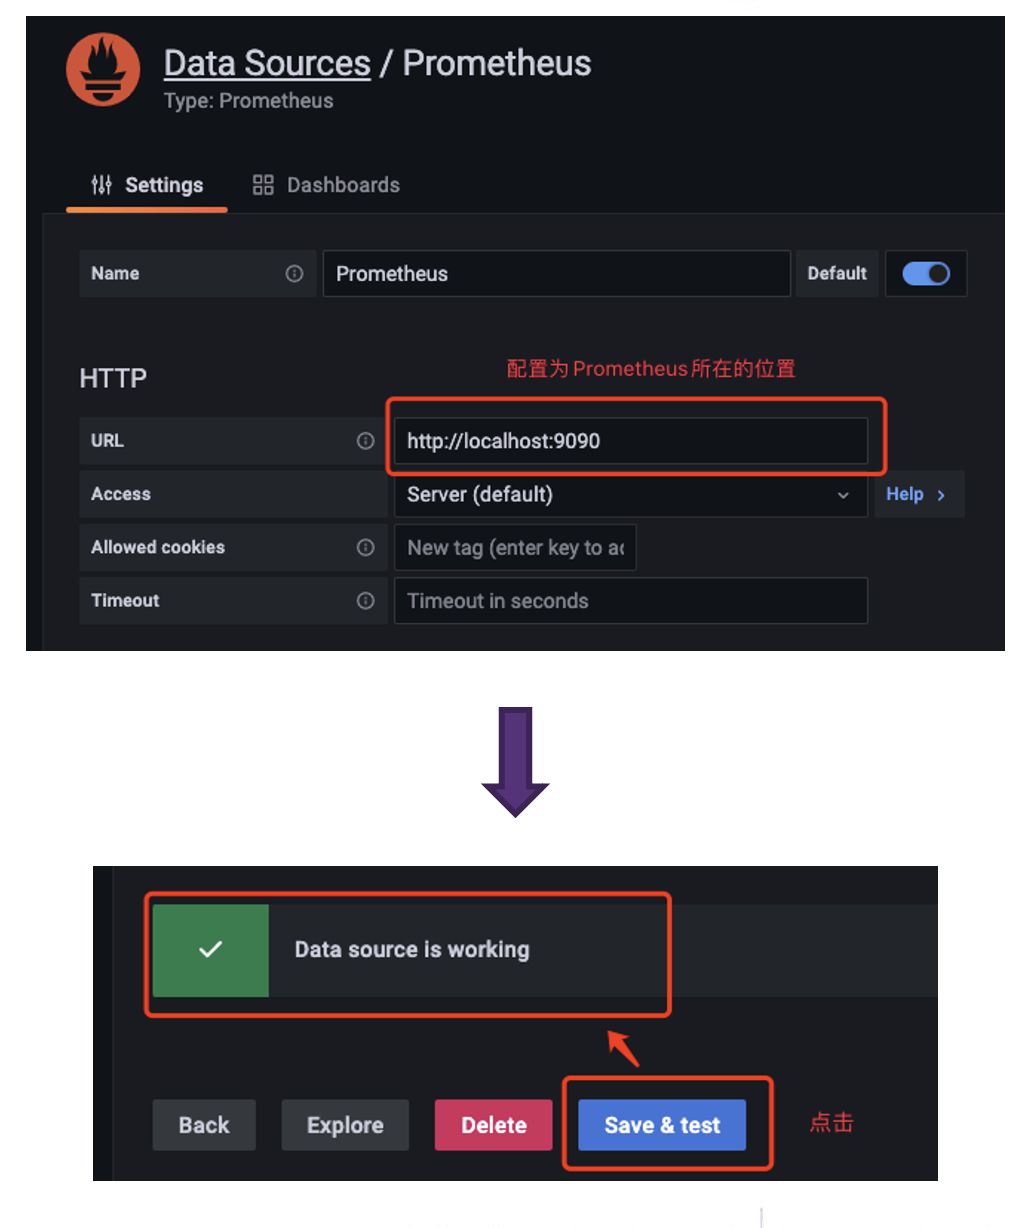
| 5. 在配置 Data Source 时注意 Prometheus 所在的URL,配置好后点击Save & Test 出现 Data source is working 提示则为配置成功 |
| |
|  |
| |
| ### Step2:使用IoTDB官方提供的Grafana看板 |
| |
| 1. 进入 Grafana,选择 Dashboards 的 Browse |
| |
| 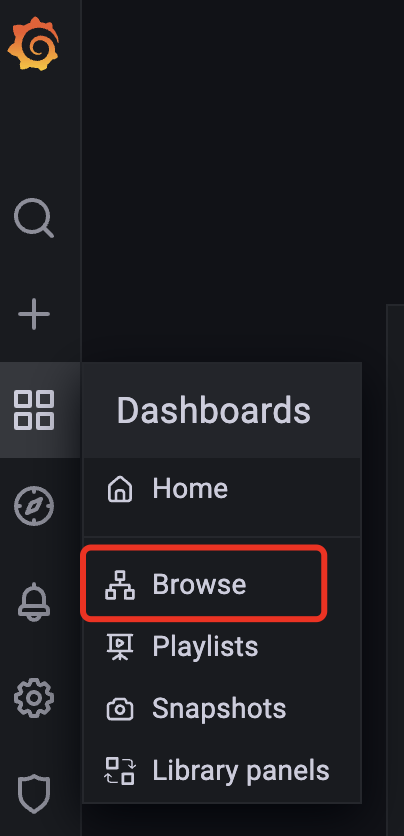 |
| |
| 2. 点击右侧 Import 按钮 |
| |
|  |
| |
| 3. 选择一种方式导入 Dashboard |
| a. 上传本地已下载的 Dashboard 的 Json 文件 |
| b. 输入 Grafana 官网获取到的 Dashboard 的 URL 或者 ID |
| c. 将 Dashboard 的 Json 文件内容直接粘贴进入 |
| |
| 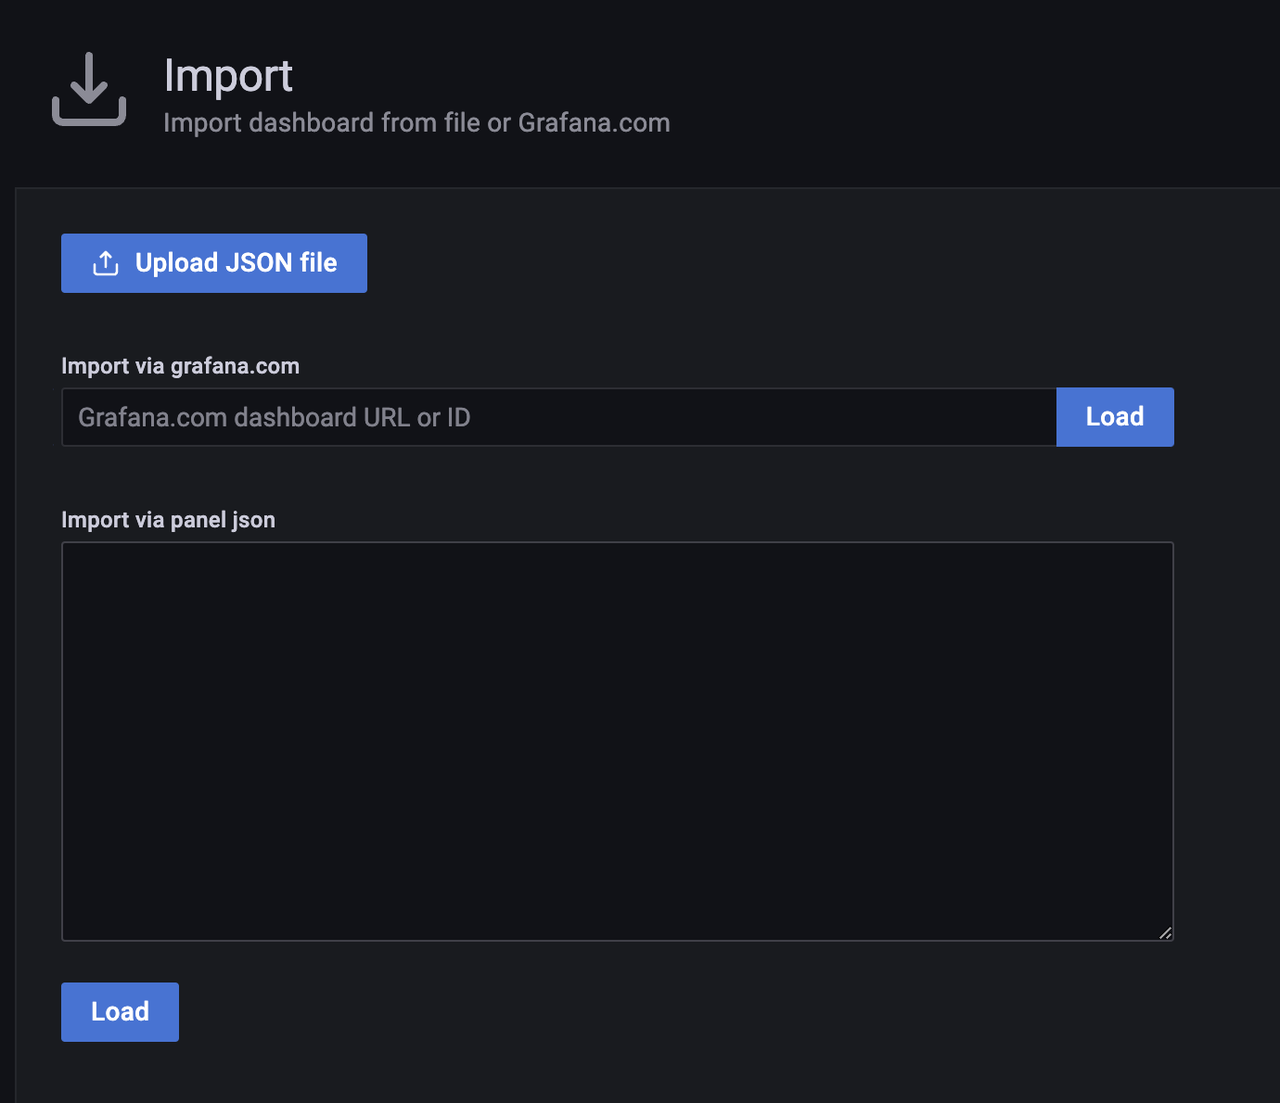 |
| |
| 4. 选择 Dashboard 的 Prometheus 为刚刚配置好的 Data Source,然后点击 Import |
| |
| 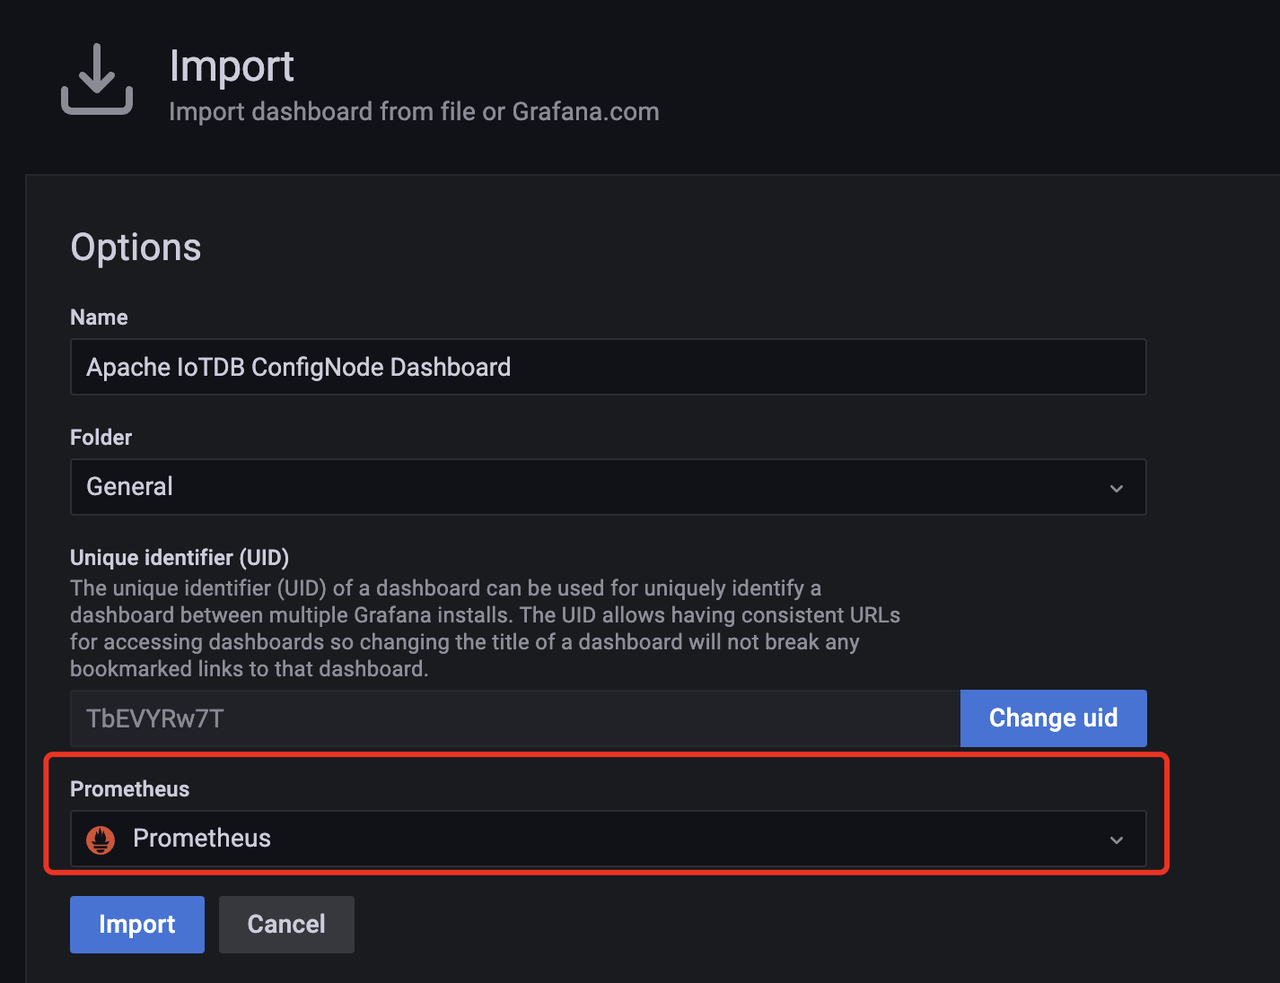 |
| |
| 5. 之后进入 Dashboard,选择 job 为 ConfigNode,就看到如下的监控面板 |
| |
| 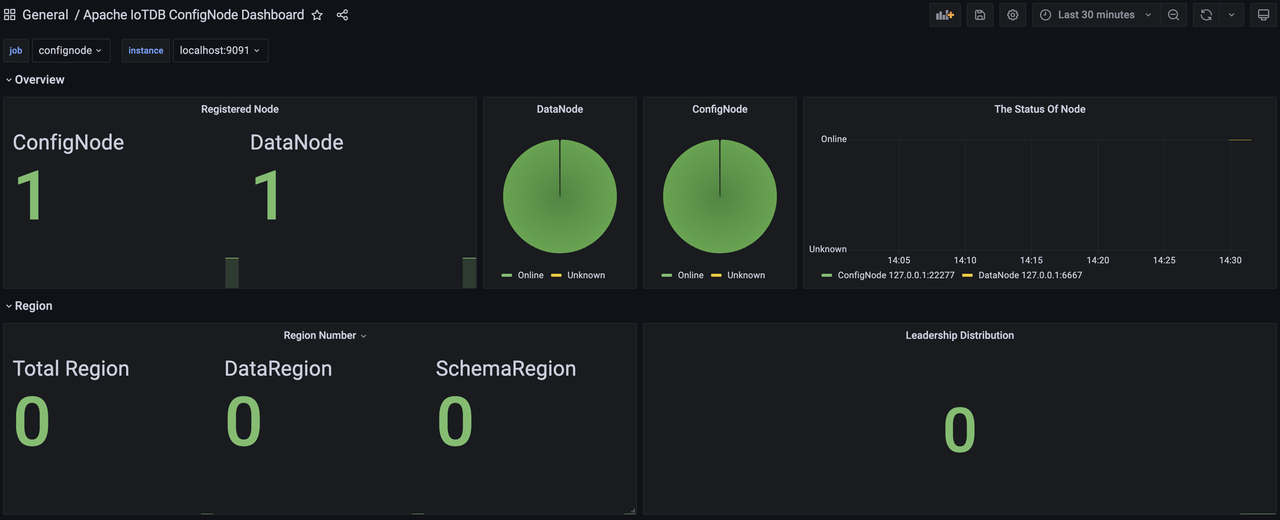 |
| |
| 6. 同样地,我们可以导入 Apache DataNode Dashboard,选择 job 为 DataNode,就看到如下的监控面板: |
| |
|  |
| |
| ### Step3:创建新的 Dashboard 进行数据可视化 |
| |
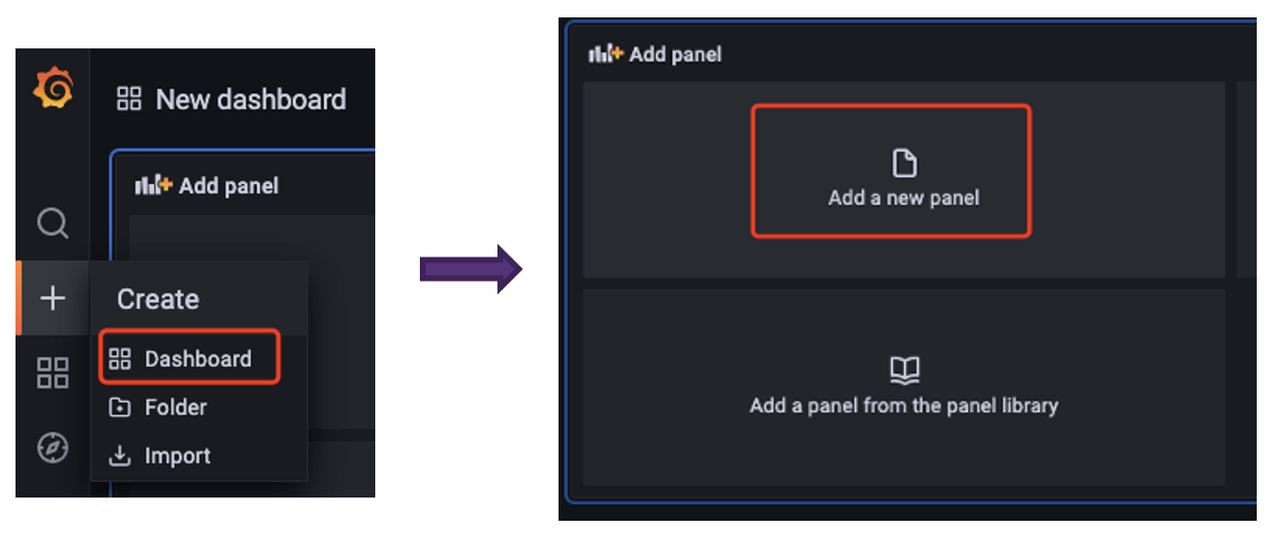
| 1. 首先创建Dashboard,然后创建Panel |
| |
|  |
| |
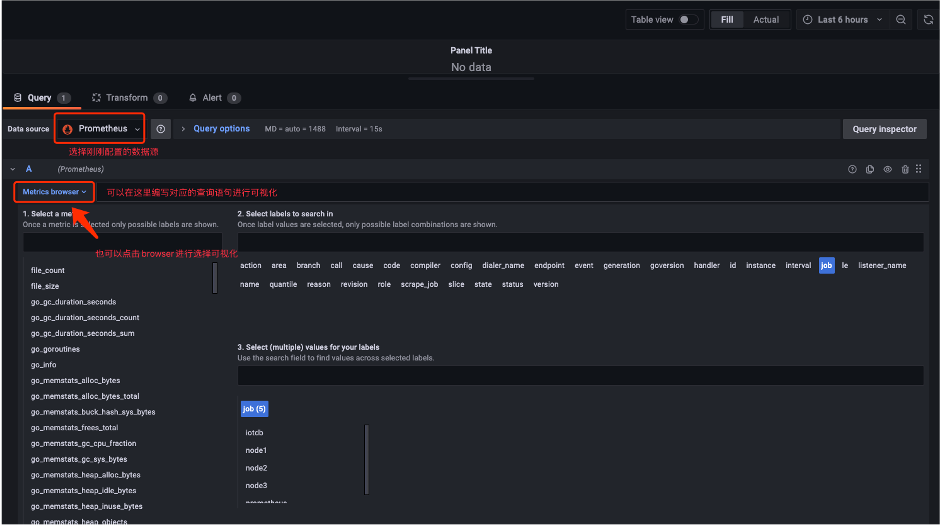
| 2. 之后就可以在面板根据自己的需求对监控相关的数据进行可视化(所有相关的监控指标可以先在job中选择confignode/datanode筛选) |
| |
|  |
| |
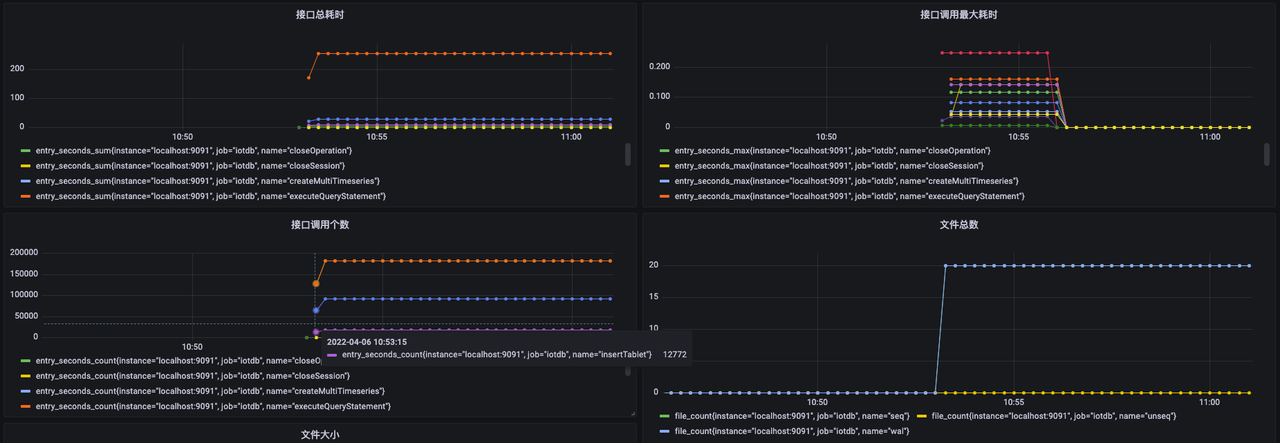
| 3. 选择关注的监控指标可视化完成后,我们就得到了这样的面板: |
| |
|  |
