1 Monitoring Board Install and Deploy
From the IoTDB 1.0 version, we introduced the system monitoring module, you can complete the IoTDB important operational indicators for monitoring, this article describes how to open the system monitoring module in the IoTDB distribution, and the use of Prometheus + Grafana way to complete the visualisation of the system monitoring indicators.
1.1 pre-preparation
1.1.1 software requirement
- IoTDB: version 1.0 and above, you may contact your sales for the relevant installer
- Prometheus: version 2.30.3 and above, download from the official website: https://prometheus.io/download/
- Grafana: version 8.4.2 and above, download from the official website: https://grafana.com/grafana/download
- IoTDB Dashboards: IoTDB Dashboard is a tool for Enterprise IoTDB, and you may contact your sales for the relevant installer.
1.1.2 Start ConfigNode
- Enter the
iotdb-enterprise-1.x.x.x-binpackage - Modify the configuration file
conf/iotdb-confignode.propertiesand modify the following configuration. Other configurations remain unchanged:
cn_metric_reporter_list=PROMETHEUS
cn_metric_level=IMPORTANT
cn_metric_prometheus_reporter_port=9091
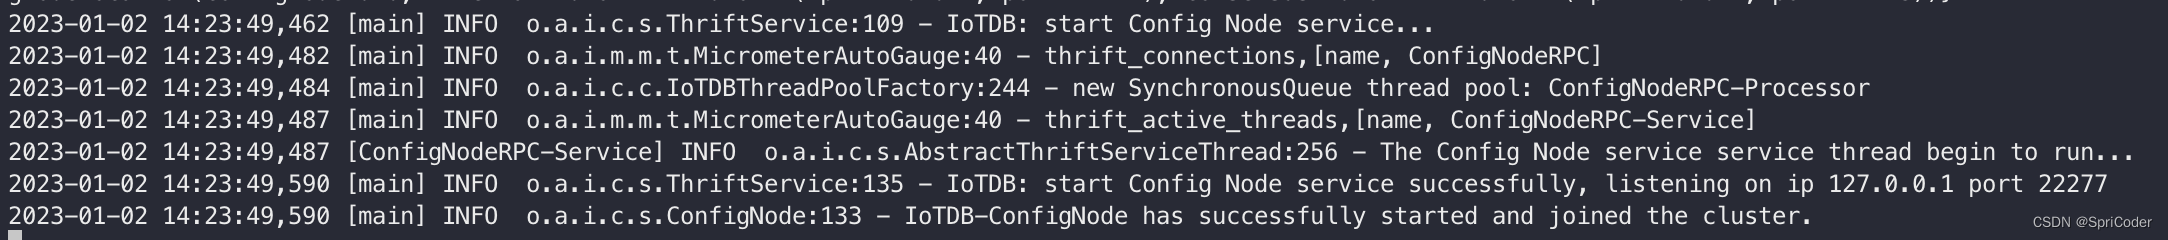
- Run the script to start ConfigNode:
./sbin/start-confignode.sh. If the following prompt appears, the startup is successful:
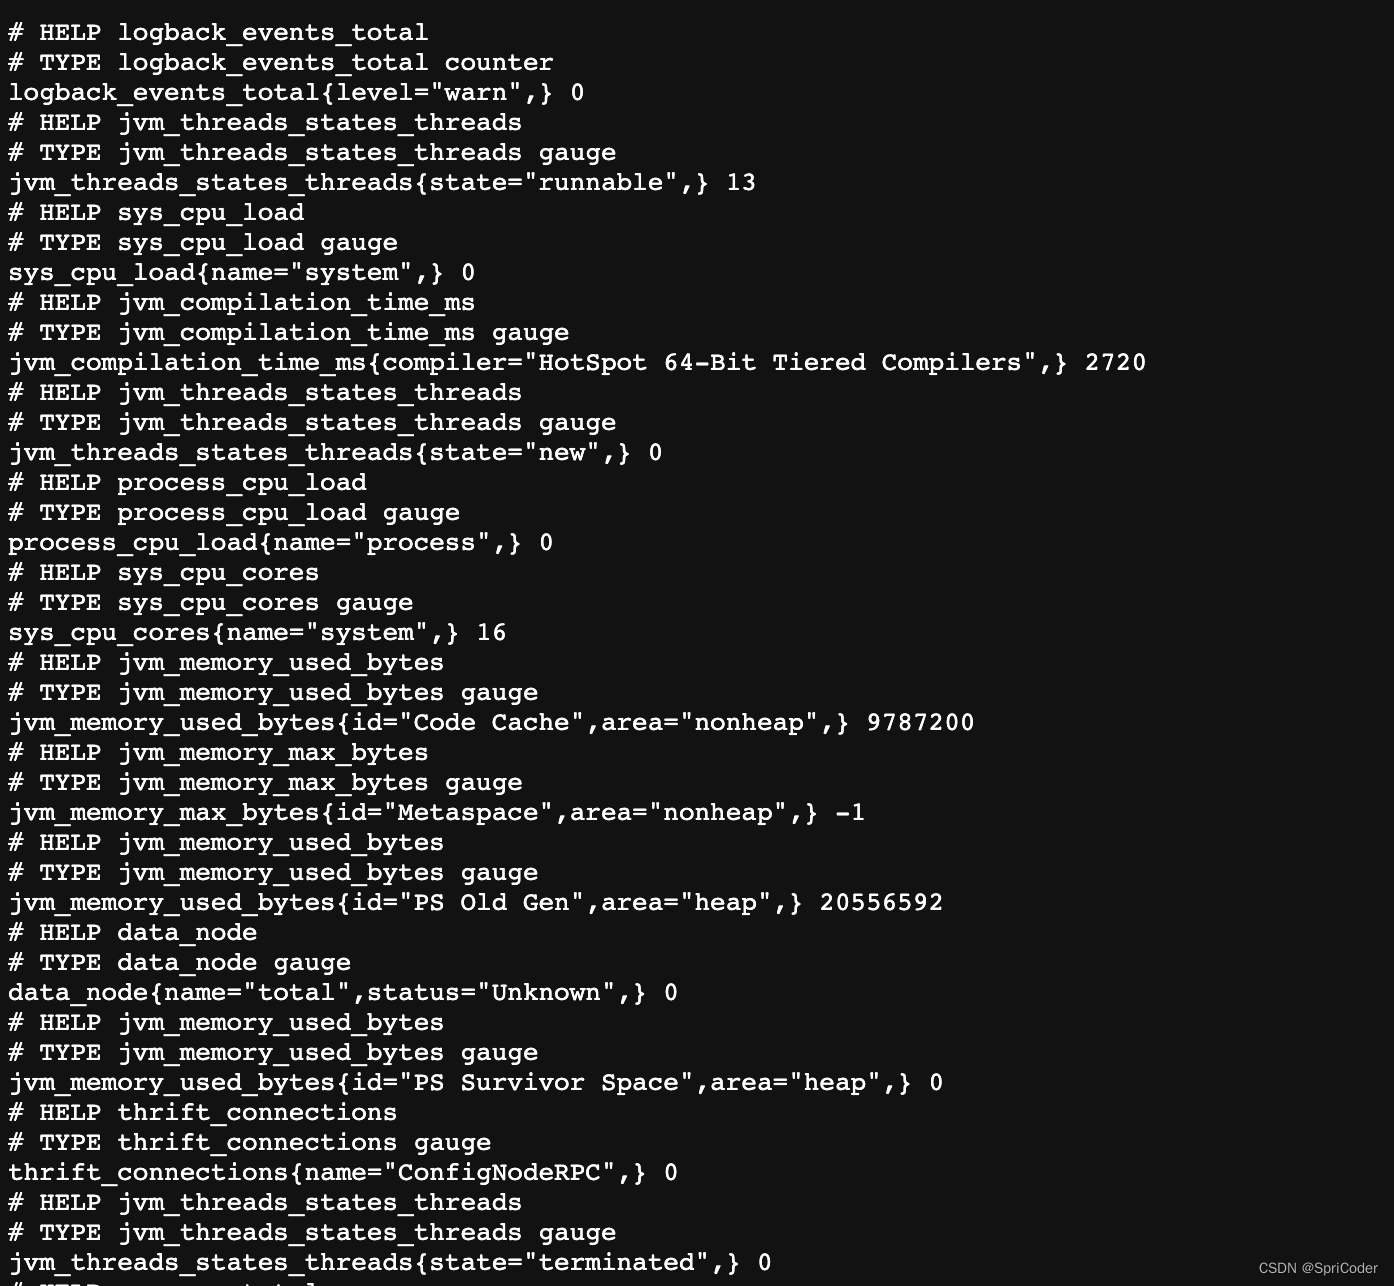
- Enter the http://localhost:9091/metrics URL in the browser, and you can view the following monitoring item information:
- Similarly, the other two ConfigNode nodes can be configured to ports 9092 and 9093 respectively.
1.1.3 Start DataNode
- Enter the
iotdb-enterprise-1.x.x.x-binpackage - Modify the configuration file
conf/iotdb-datanode.propertiesand modify the following configuration. Other configurations remain unchanged:
dn_metric_reporter_list=PROMETHEUS
dn_metric_level=IMPORTANT
dn_metric_prometheus_reporter_port=9094
- Run the script to start DataNode:
./sbin/start-datanode.sh. If the following prompt appears, the startup is successful:

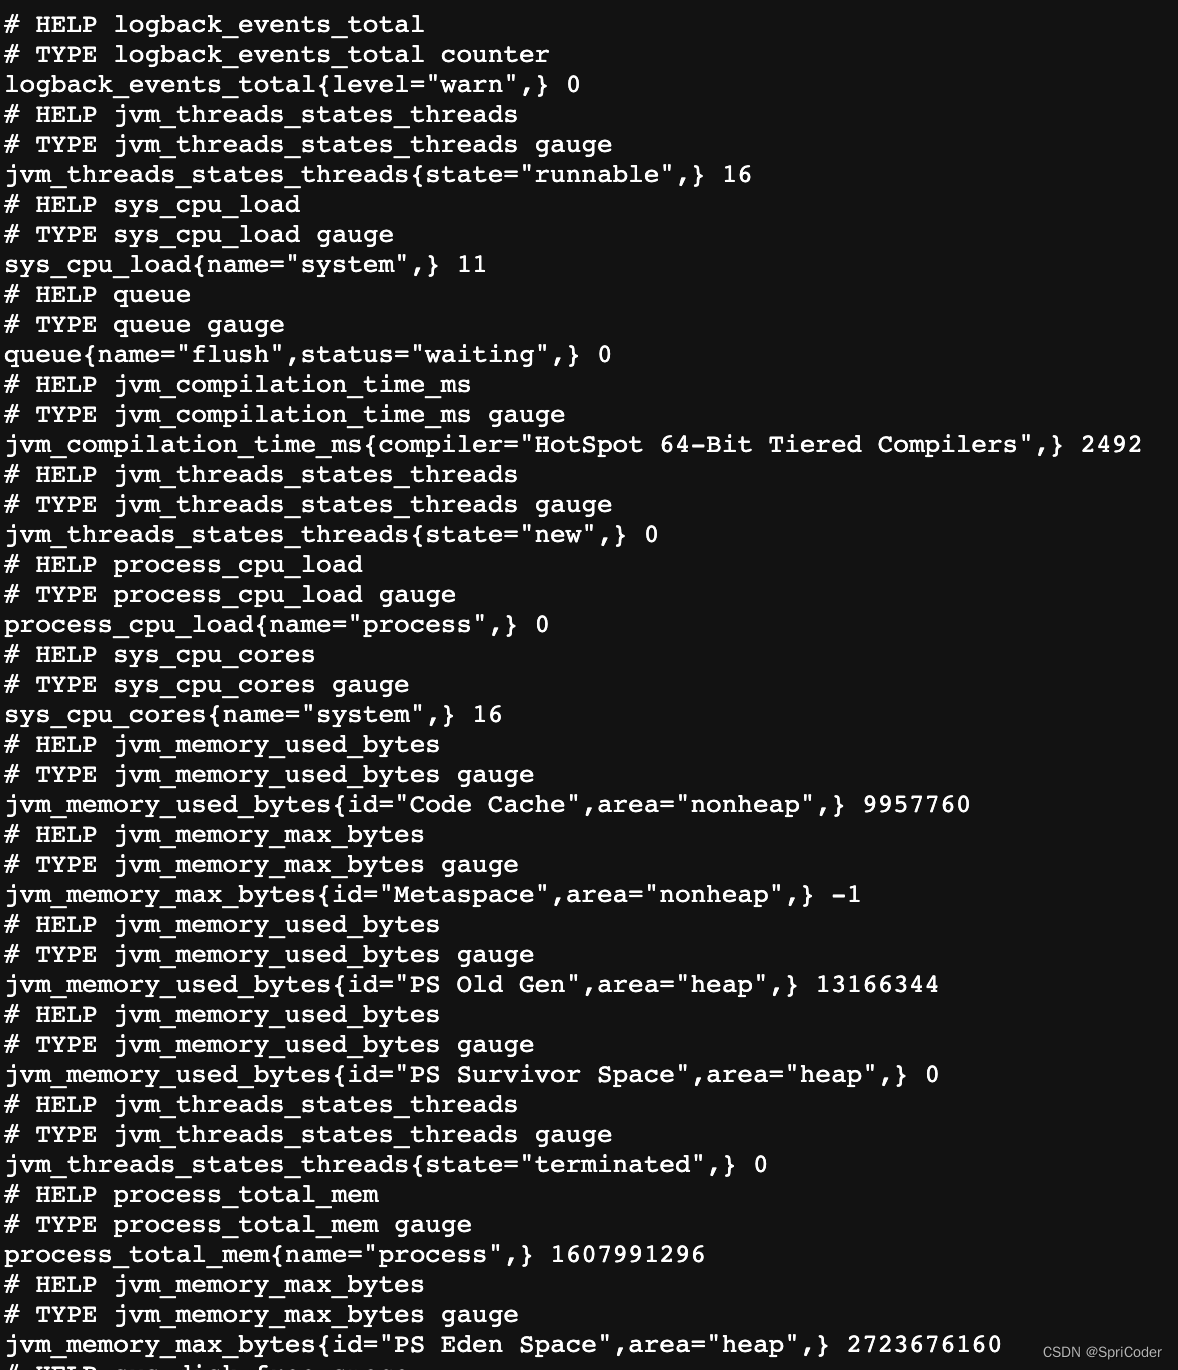
- Enter the
http://localhost:9094/metricsURL in the browser, and you can view the following monitoring item information:
- Similarly, the other two DataNodes can be configured to ports 9095 and 9096.
1.1.4 clarification
Please confirm that the IoTDB cluster has been started before performing the following operations.
This doc will build the monitoring dashboard on one machine (1 ConfigNode and 1 DataNode) environment, other cluster configurations are similar, users can adjust the configuration according to their own cluster situation (the number of ConfigNode and DataNode). The basic configuration information of the cluster built in this paper is shown in the table below.
| NODETYPE | NODEIP | Monitor Pusher | Monitor Level | Monitor Port |
|---|---|---|---|---|
| ConfigNode | 127.0.0.1 | PROMETHEUS | IMPORTANT | 9091 |
| ConfigNode | 127.0.0.1 | PROMETHEUS | IMPORTANT | 9092 |
| ConfigNode | 127.0.0.1 | PROMETHEUS | IMPORTANT | 9093 |
| DataNode | 127.0.0.1 | PROMETHEUS | IMPORTANT | 9094 |
| DataNode | 127.0.0.1 | PROMETHEUS | IMPORTANT | 9095 |
| DataNode | 127.0.0.1 | PROMETHEUS | IMPORTANT | 9096 |
1.2 configure Prometheus capture monitoring metrics
- Download the installation package. Download the Prometheus binary package locally, unzip it and go to the corresponding folder:
tar xvfz prometheus-*.tar.gz
cd prometheus-*
- Modify the configuration. Modify the Prometheus configuration file prometheus.yml as follows: a. Added confignode task to collect monitoring data from ConfigNode b. Add datanode task to collect monitoring data from DataNode
global:
  scrape_interval: 15s

scrape_configs:
  - job_name: "prometheus"
    static_configs:
    - targets: ["localhost:9090"]
  - job_name: "confignode"
    static_configs:
    - targets: ["localhost:9091", "localhost:9092", "localhost:9093"]
    honor_labels: true
  - job_name: "datanode"
    static_configs:
    - targets: ["localhost:9094", "localhost:9095", "localhost:9096"]
    honor_labels: true
- Start Promethues. the default expiration time for Prometheus monitoring data is 15d. in production environments, it is recommended to adjust the expiration time to 180d or more in order to track historical monitoring data for a longer period of time, as shown in the following startup command:
./prometheus --config.file=prometheus.yml --storage.tsdb.retention.time=180d
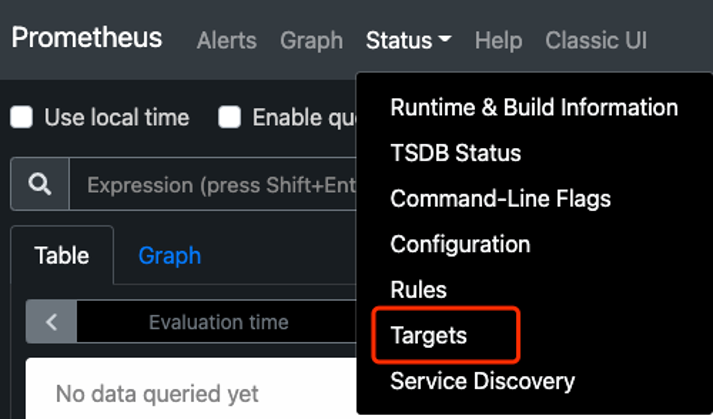
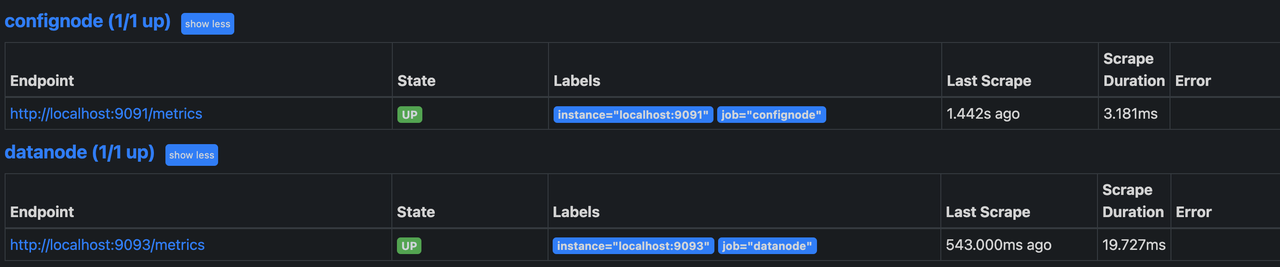
- Confirm the startup is successful. Enter http://localhost:9090 in the browser to enter Prometheus, click to enter the Target interface under Status (Figure 1 below), when you see State are Up, it means the configuration is successful and connected (Figure 2 below), click the link on the left side to jump to the webpage monitoring.
1.3 Using Grafana to View Monitoring Data
1.3.1 Step1:Grafana Installation, Configuration and Startup
- Download the binary package of Grafana locally, unzip it and go to the corresponding folder:
tar -zxvf grafana-*.tar.gz
cd grafana-*
- Start Grafana and enter:
./bin/grafana-server web
- Enter http://localhost:3000 in your browser to access Grafana, the default initial username and password are both admin.
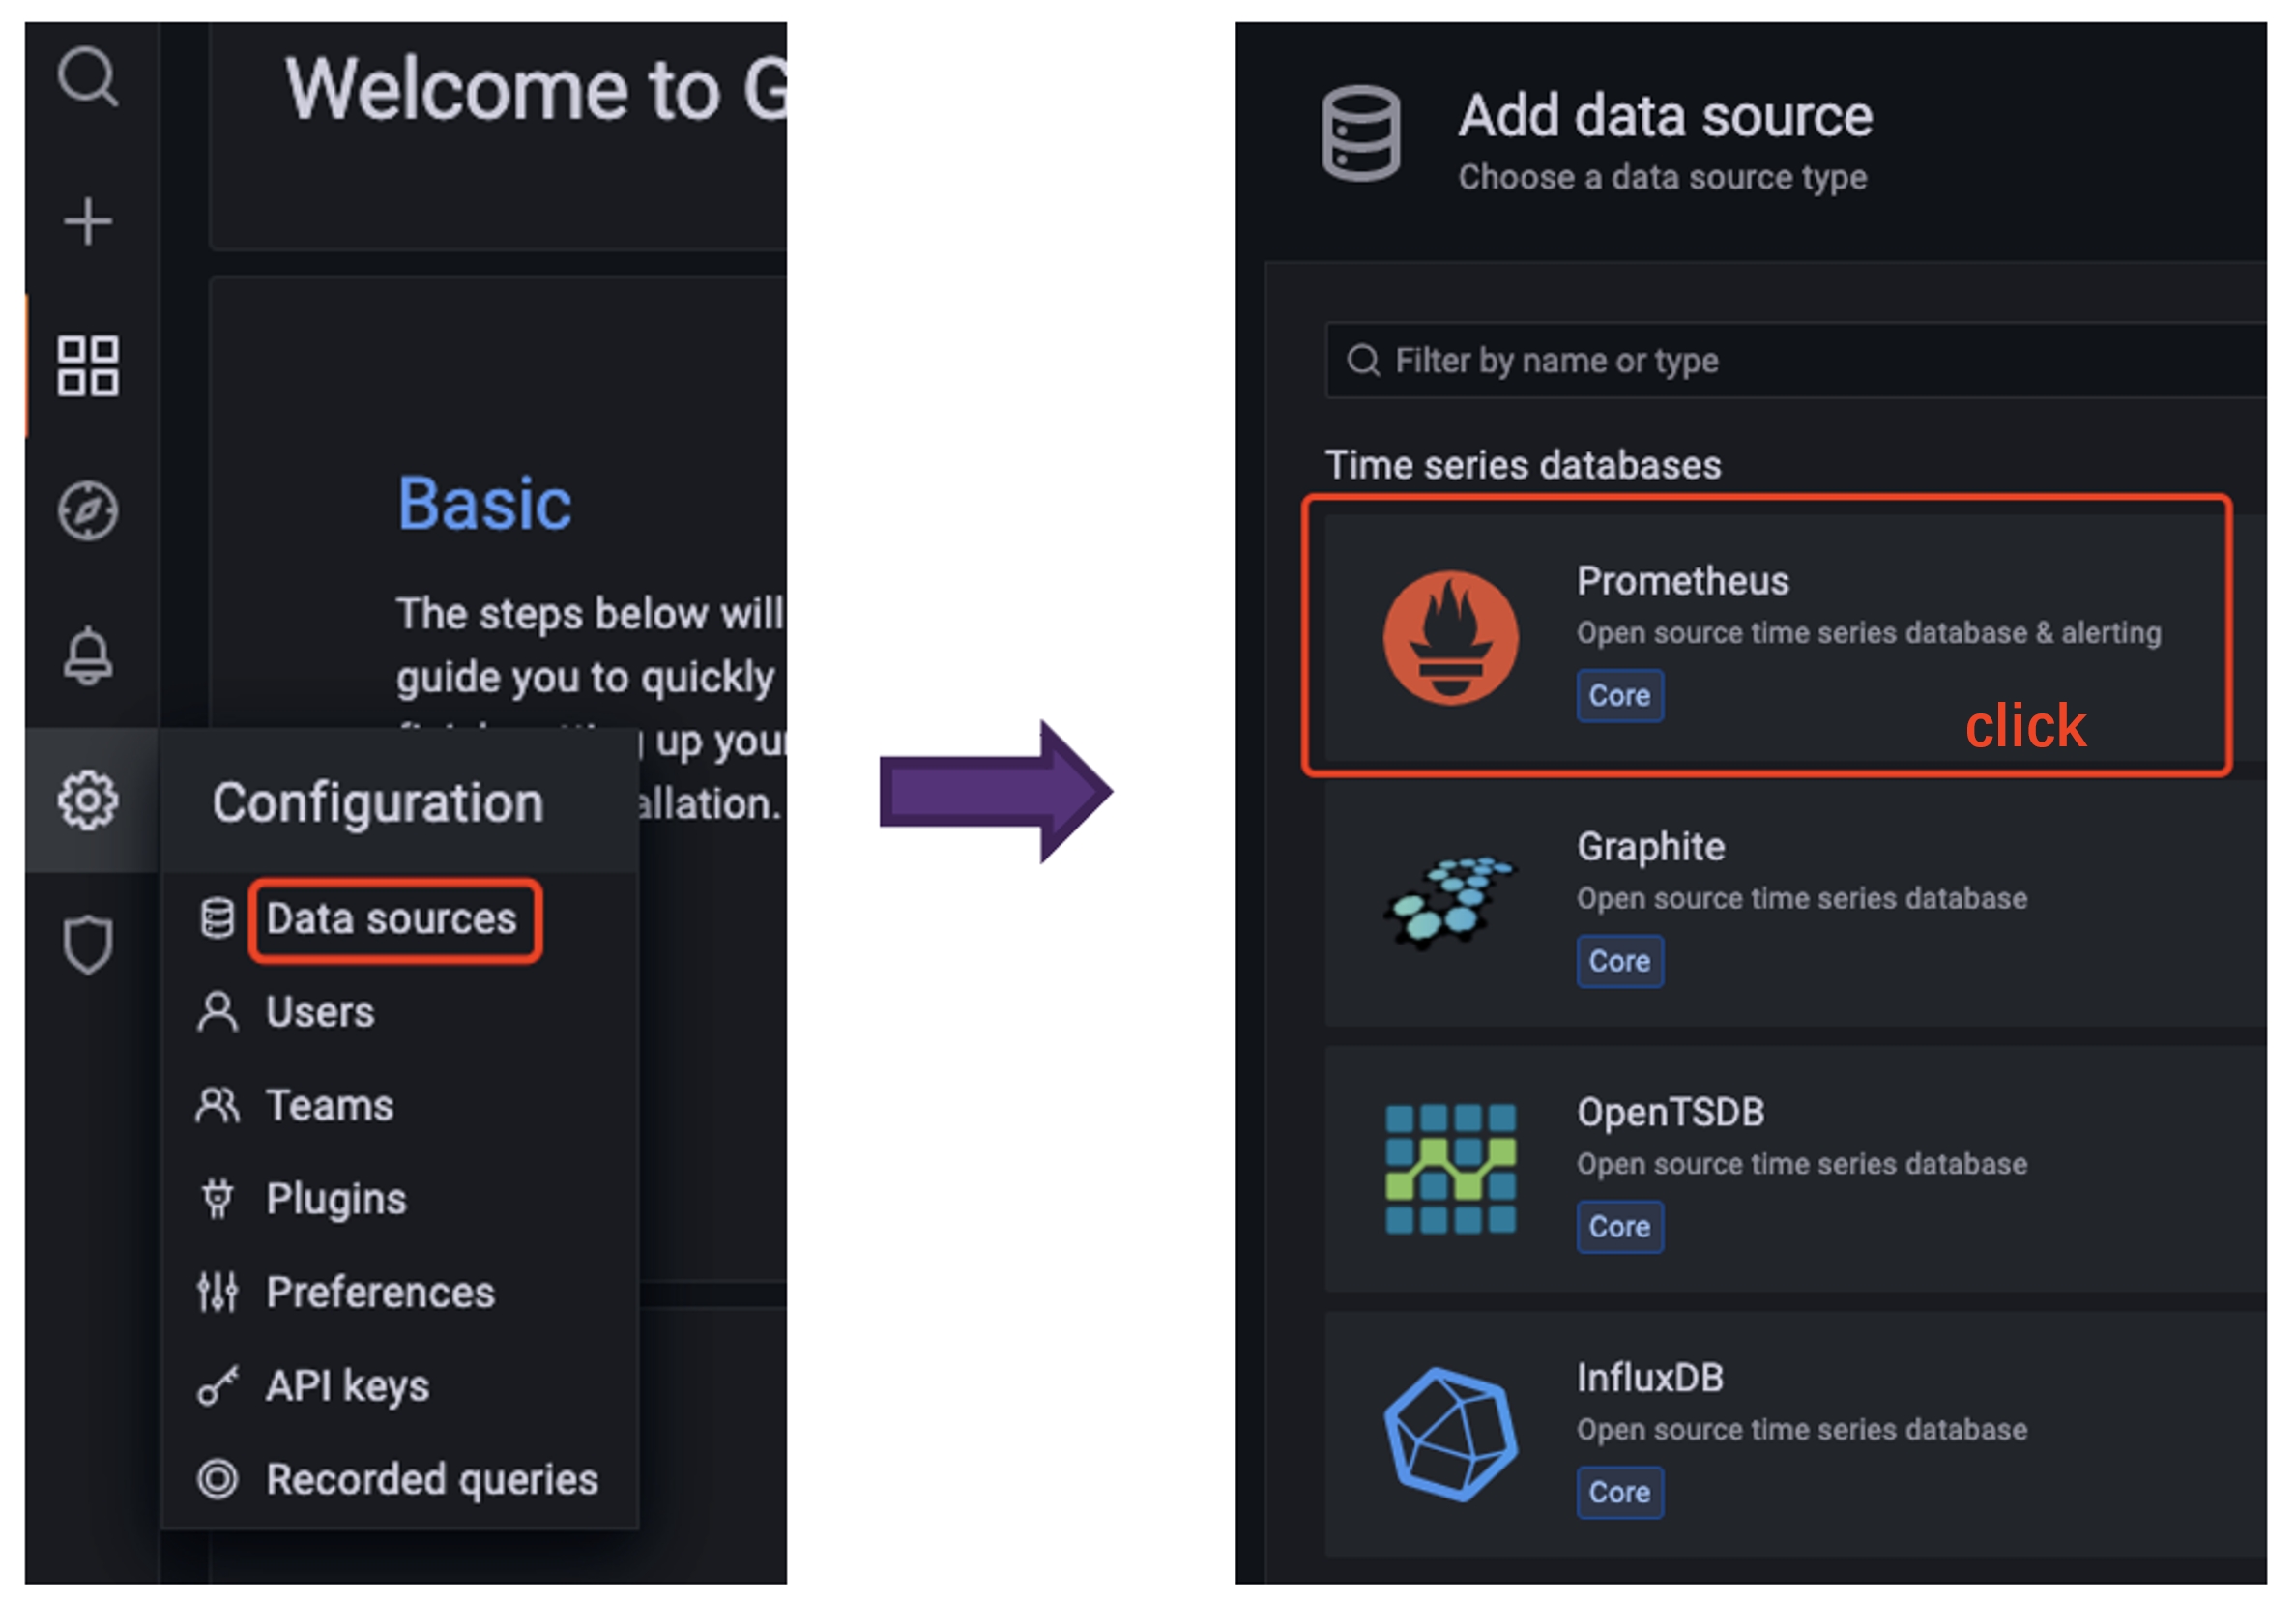
- First we configure the Data Source in Configuration to be Prometheus.
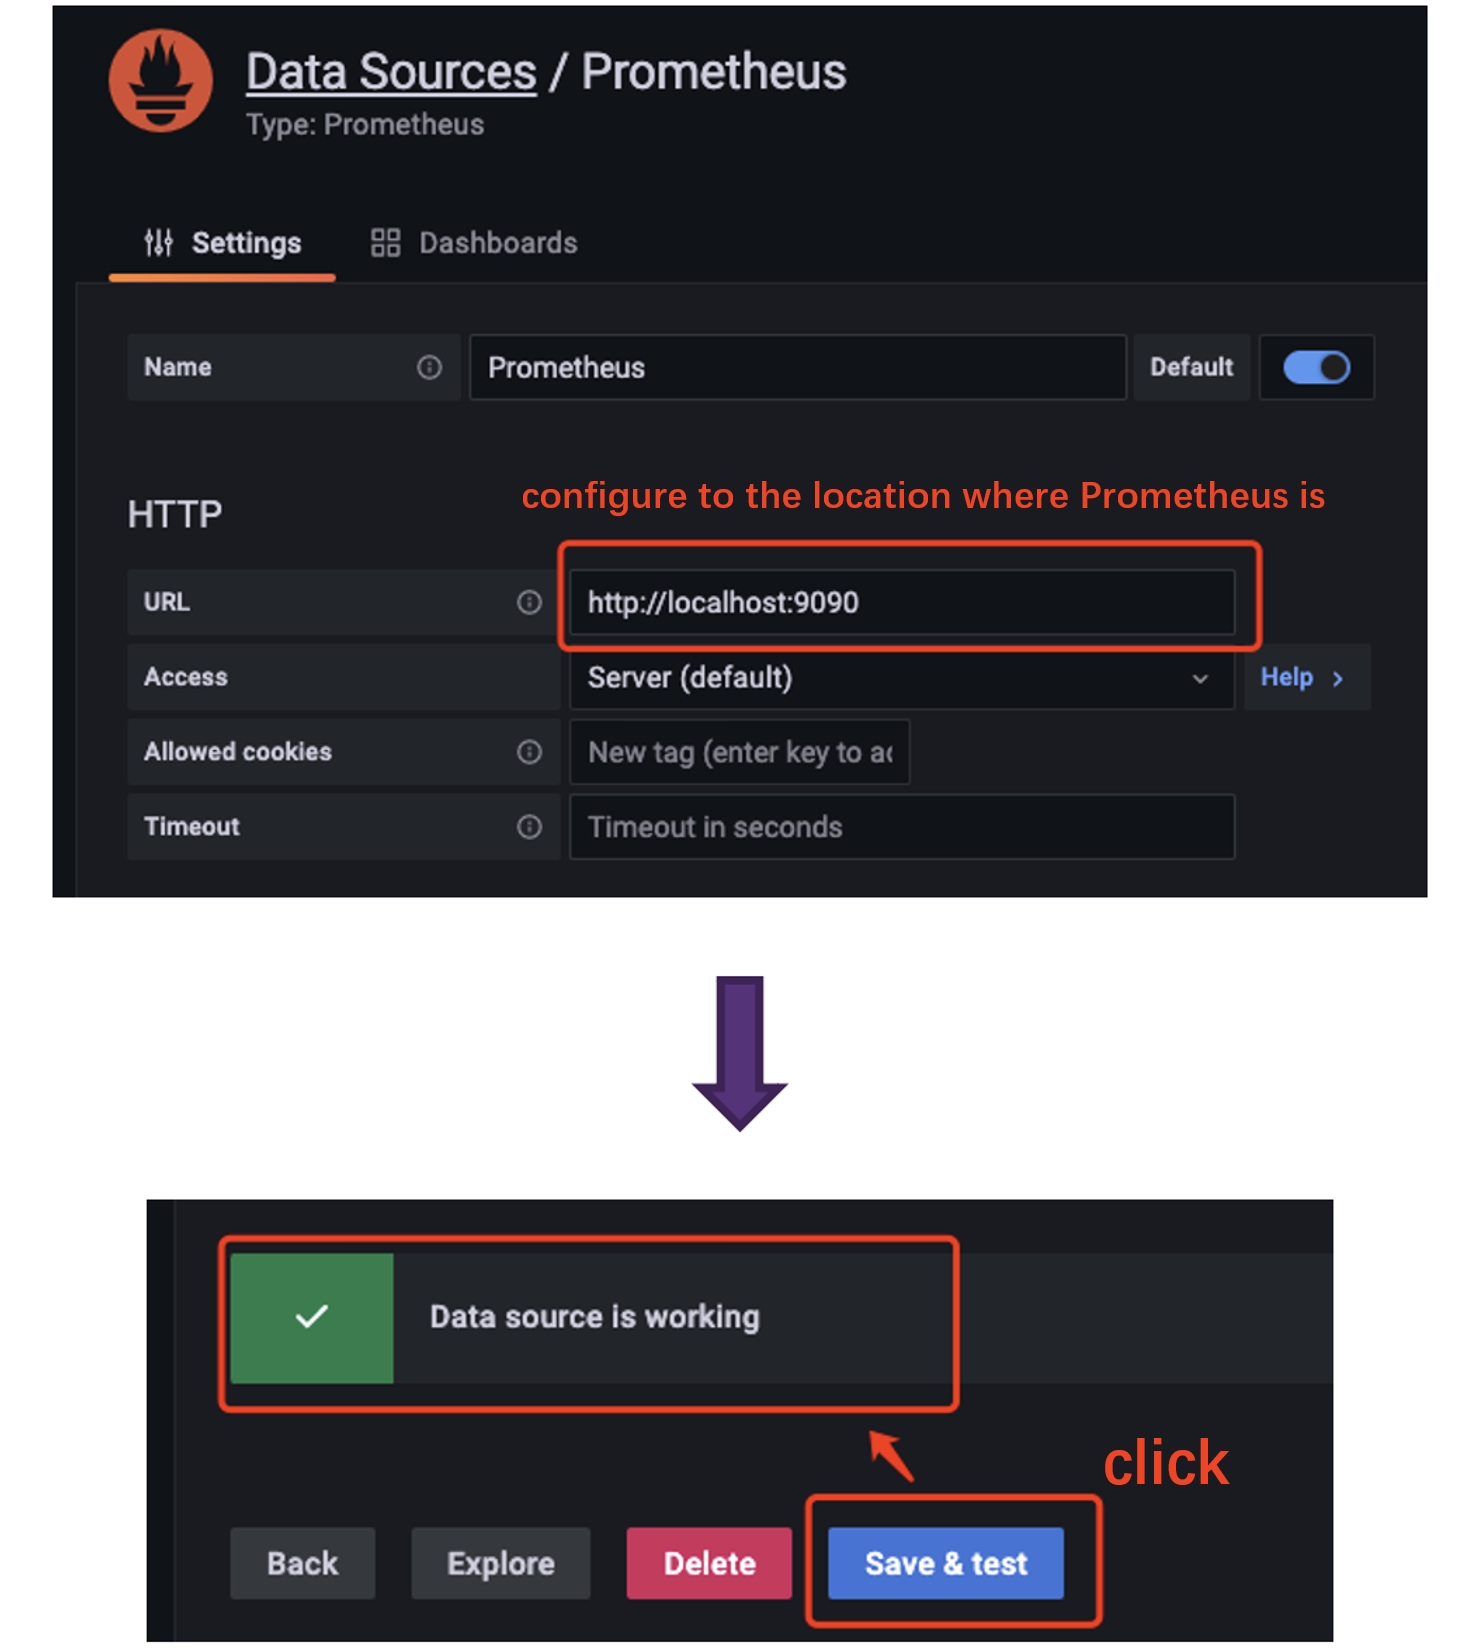
- When configuring the Data Source, pay attention to the URL where Prometheus is located, and click Save & Test after configuration, the Data source is working prompt appears, then the configuration is successful.
1.3.2 Step2:Import the IoTDB Dashboards
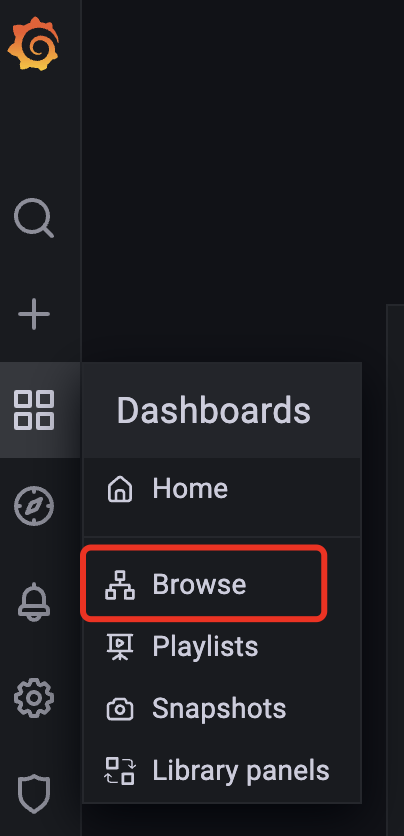
- Enter Grafana,click Browse of Dashboards
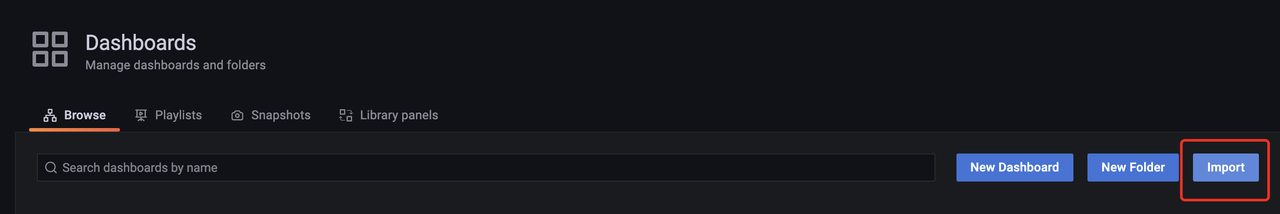
- Click the Import button on the right
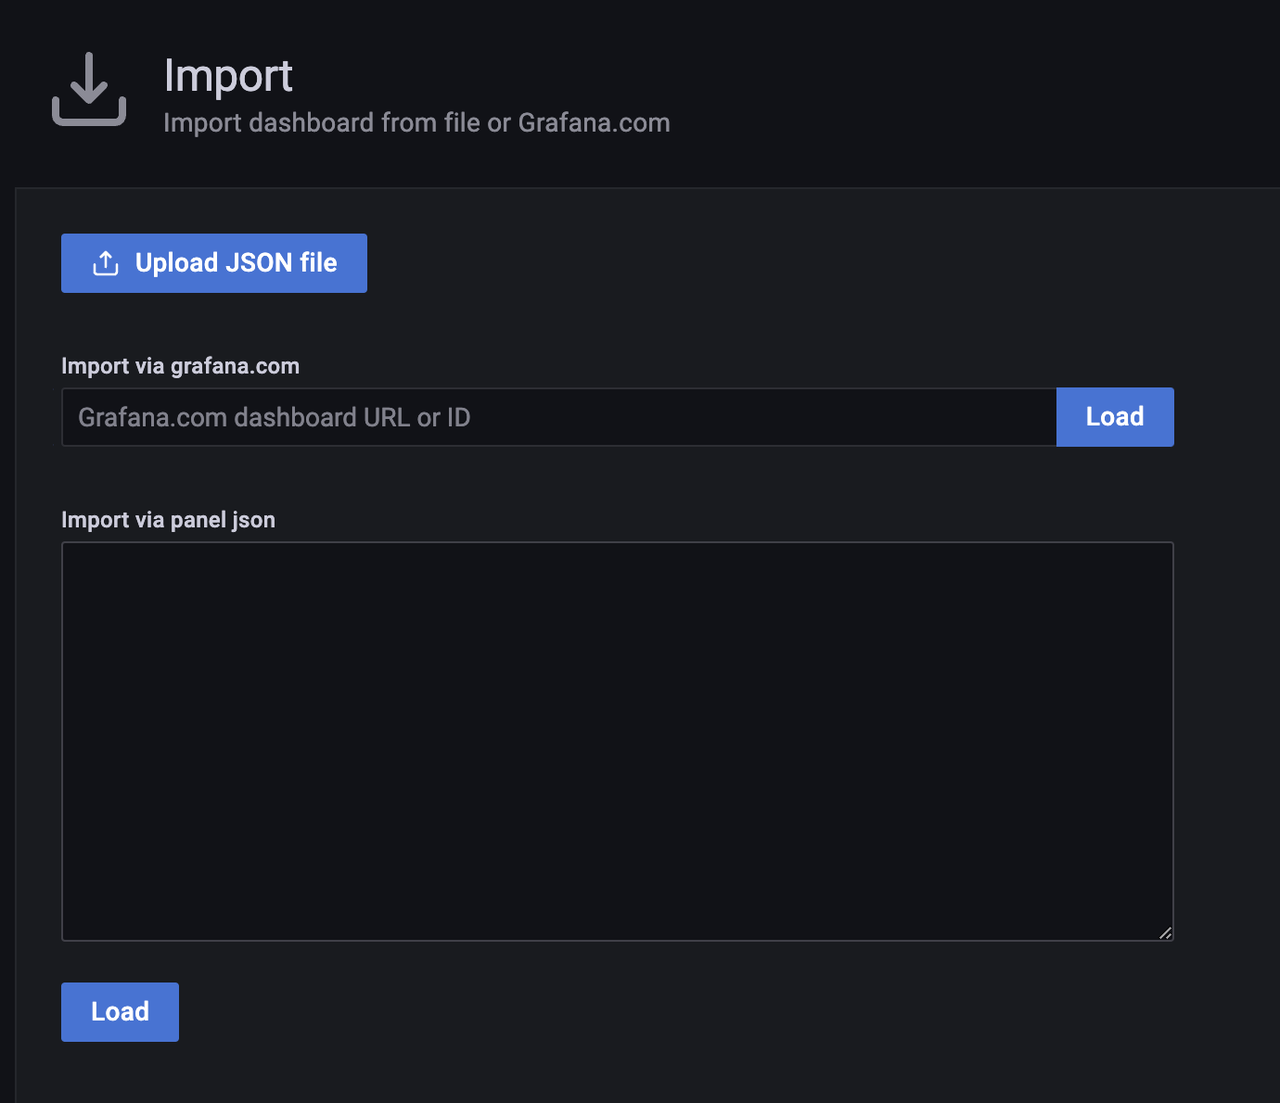
- Select a way to import Dashboard a. Upload the Json file of the downloaded Dashboard locally b. Paste the contents of the Dashboard's Json file
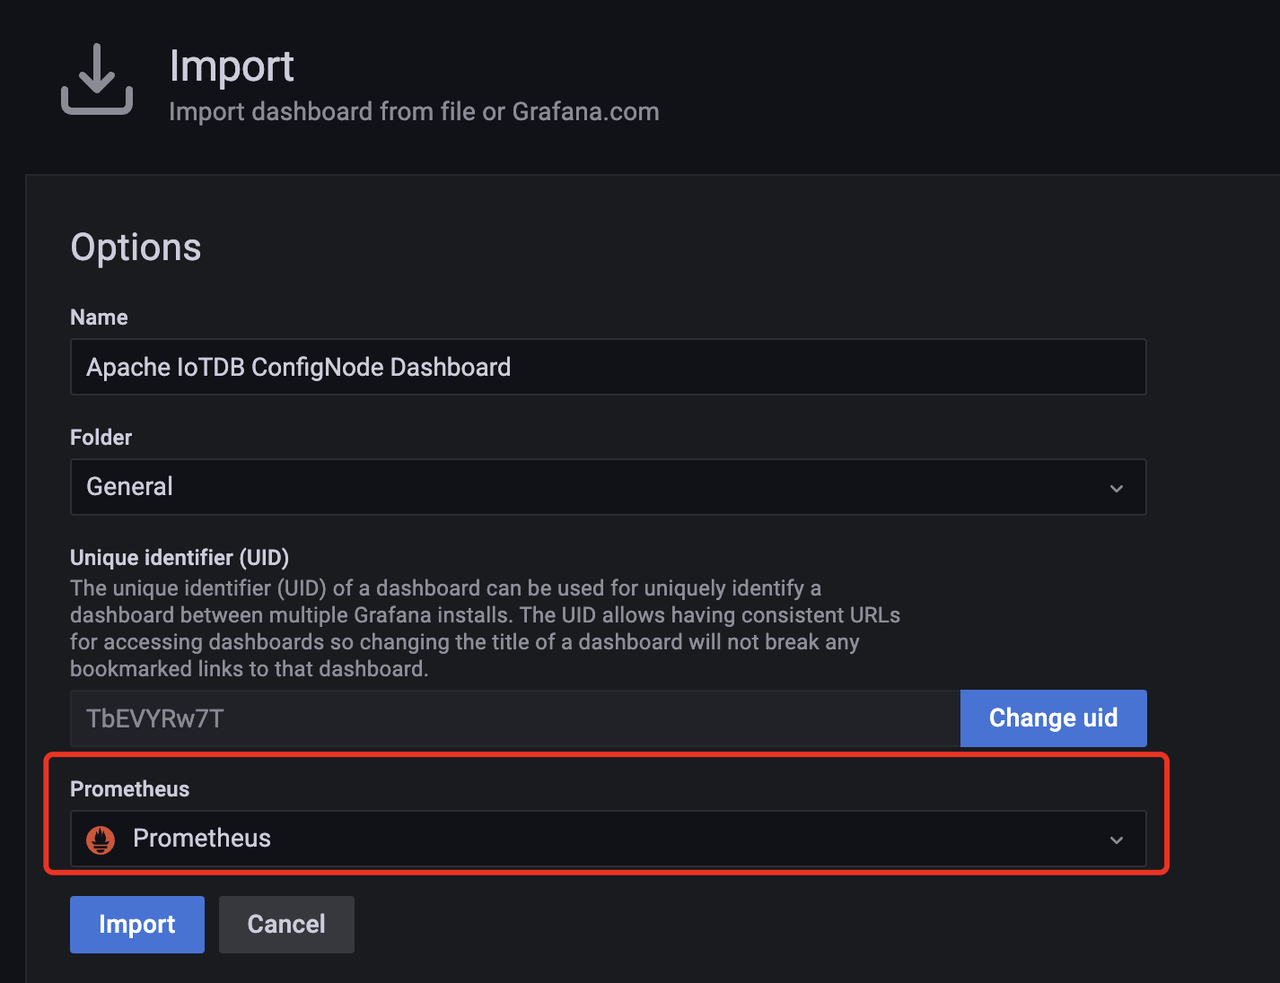
- Select Prometheus in the Dashboard as the Data Source you just configured and click Import
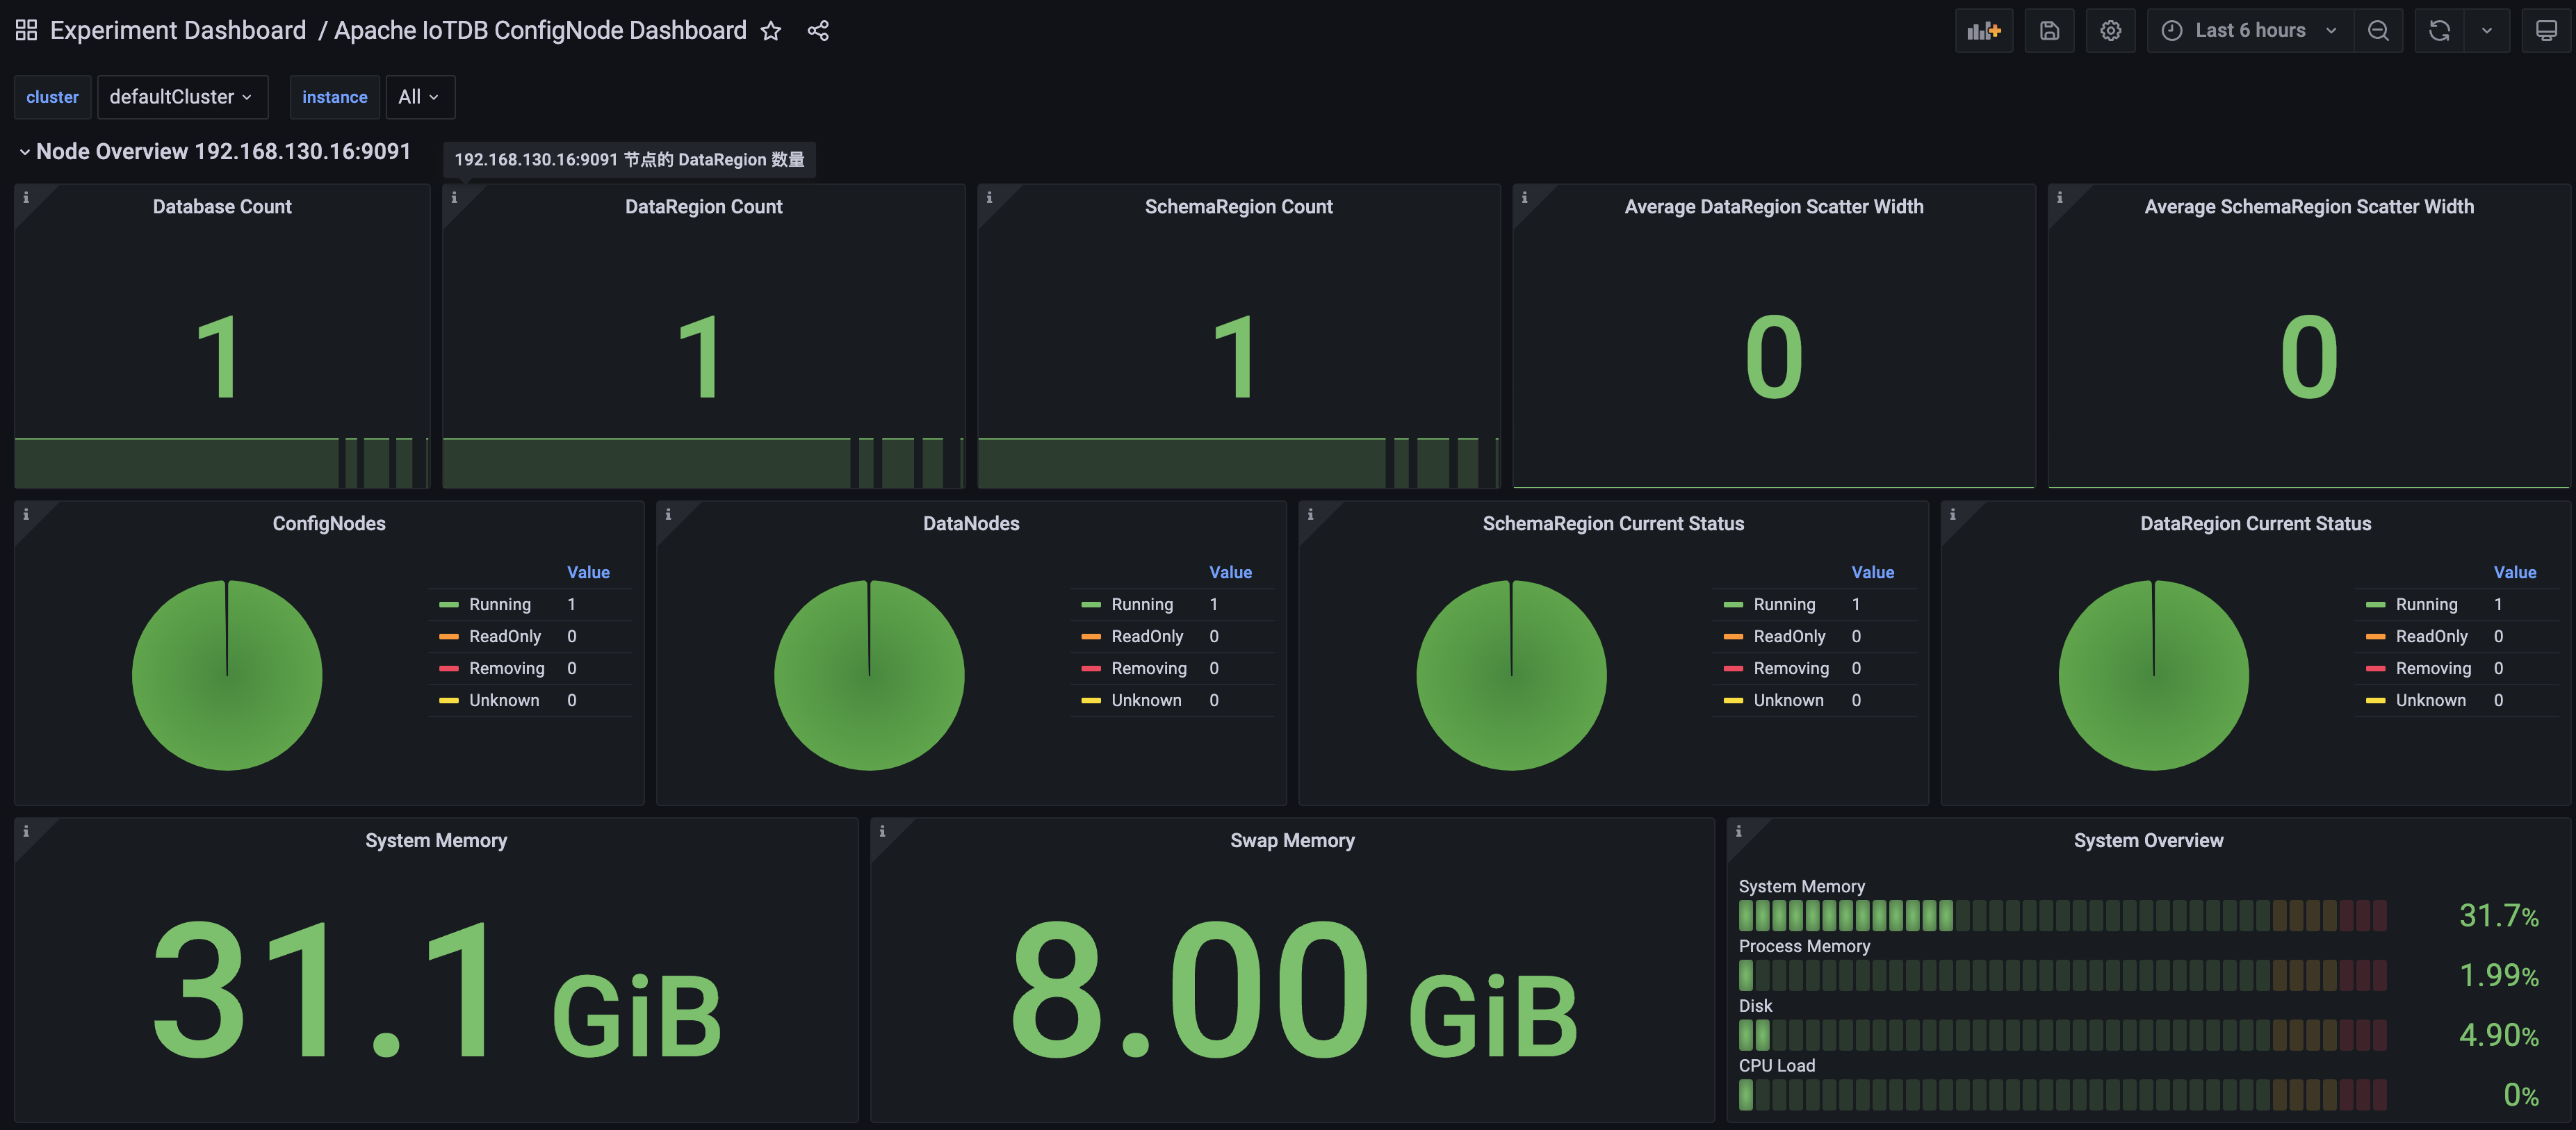
- Then enter the Apache ConfigNode Dashboard and see the following monitoring panel
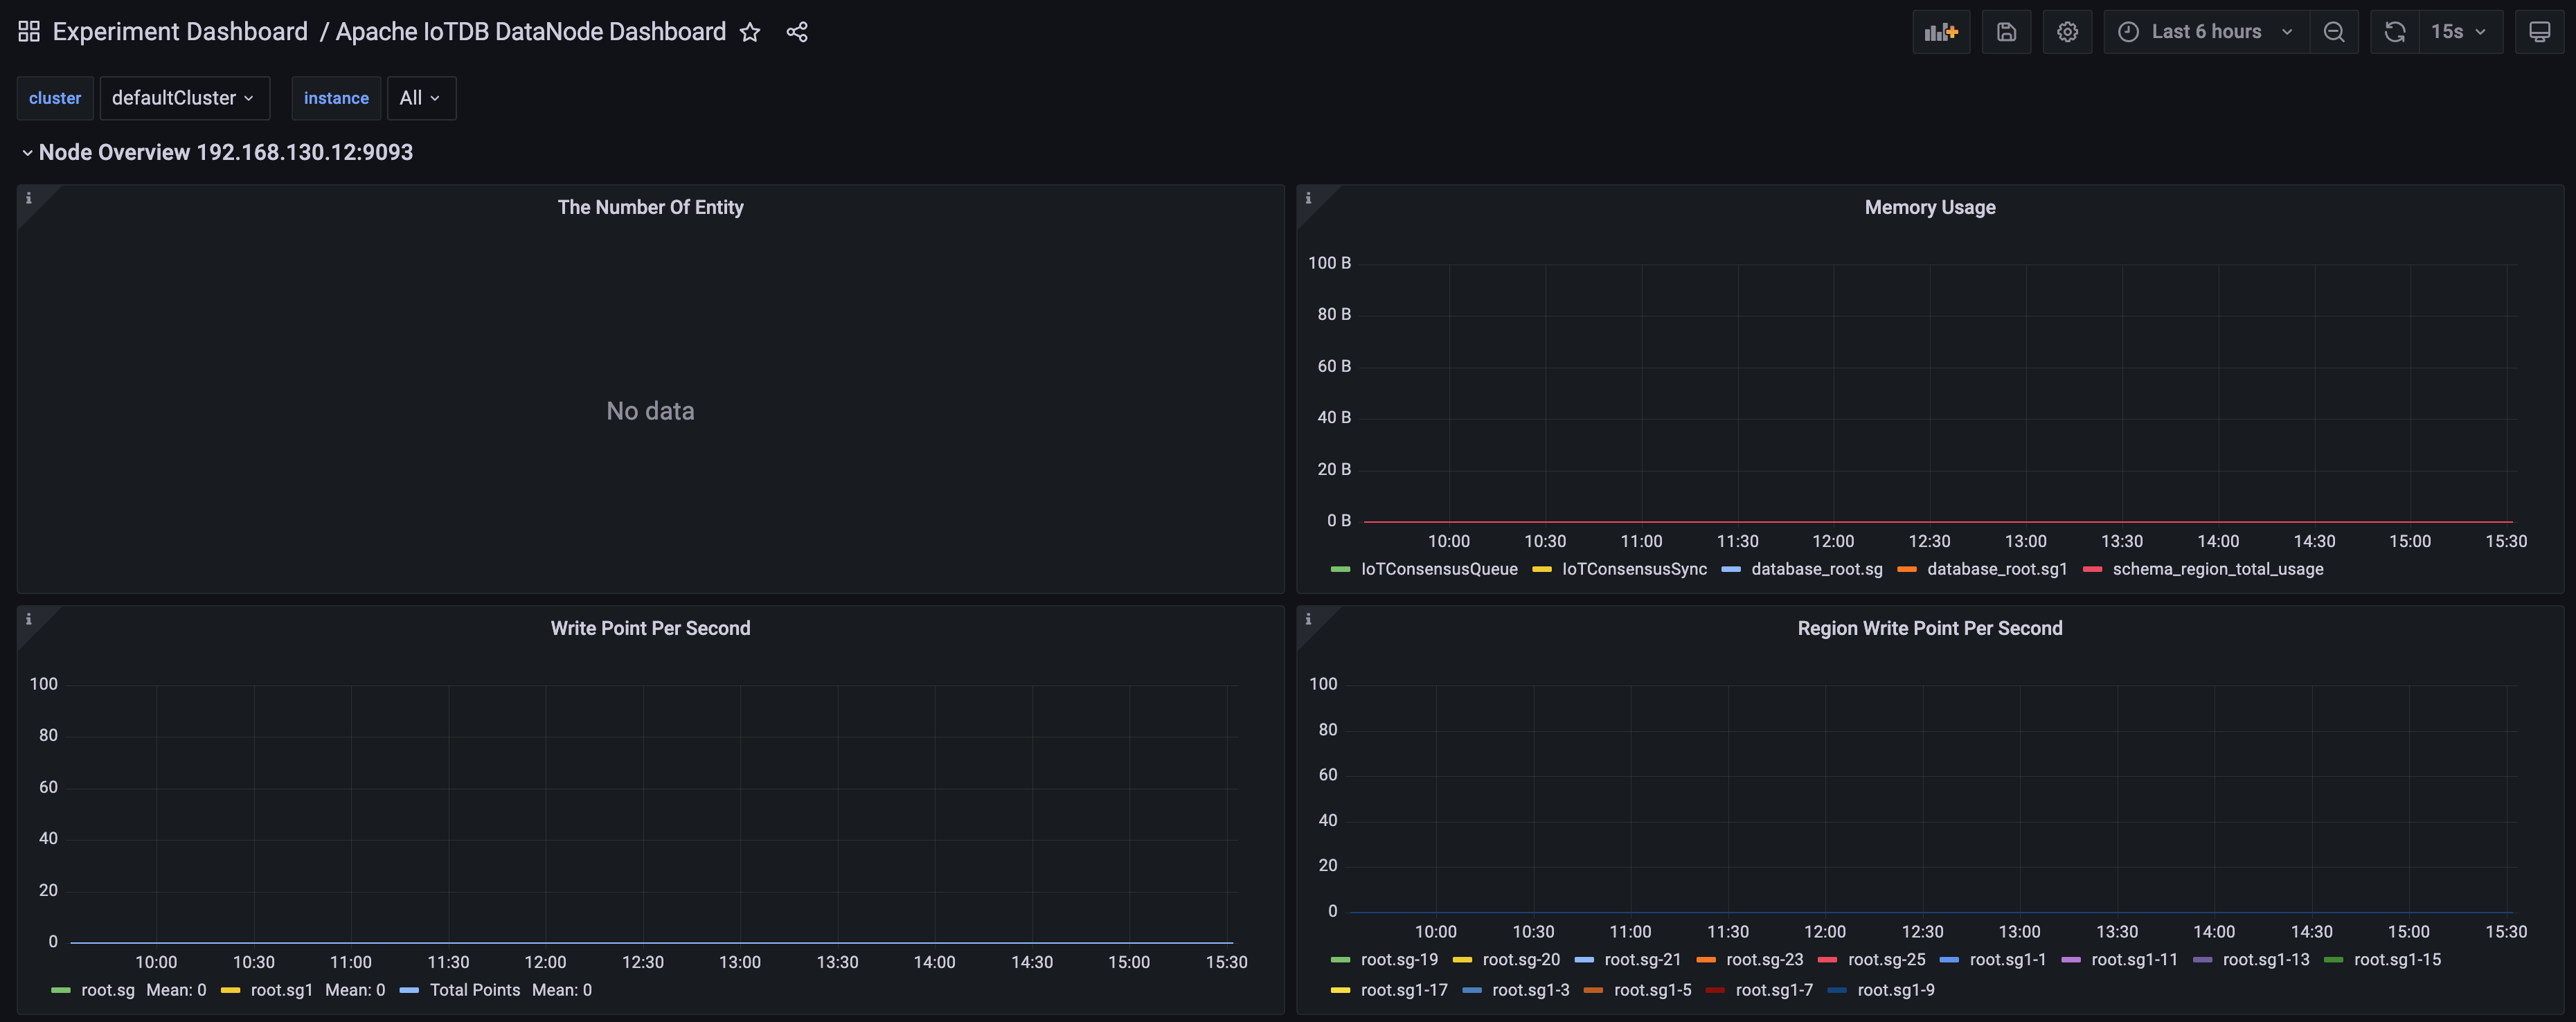
- Similarly, we can import Apache DataNode Dashboard and see the following monitoring panel:
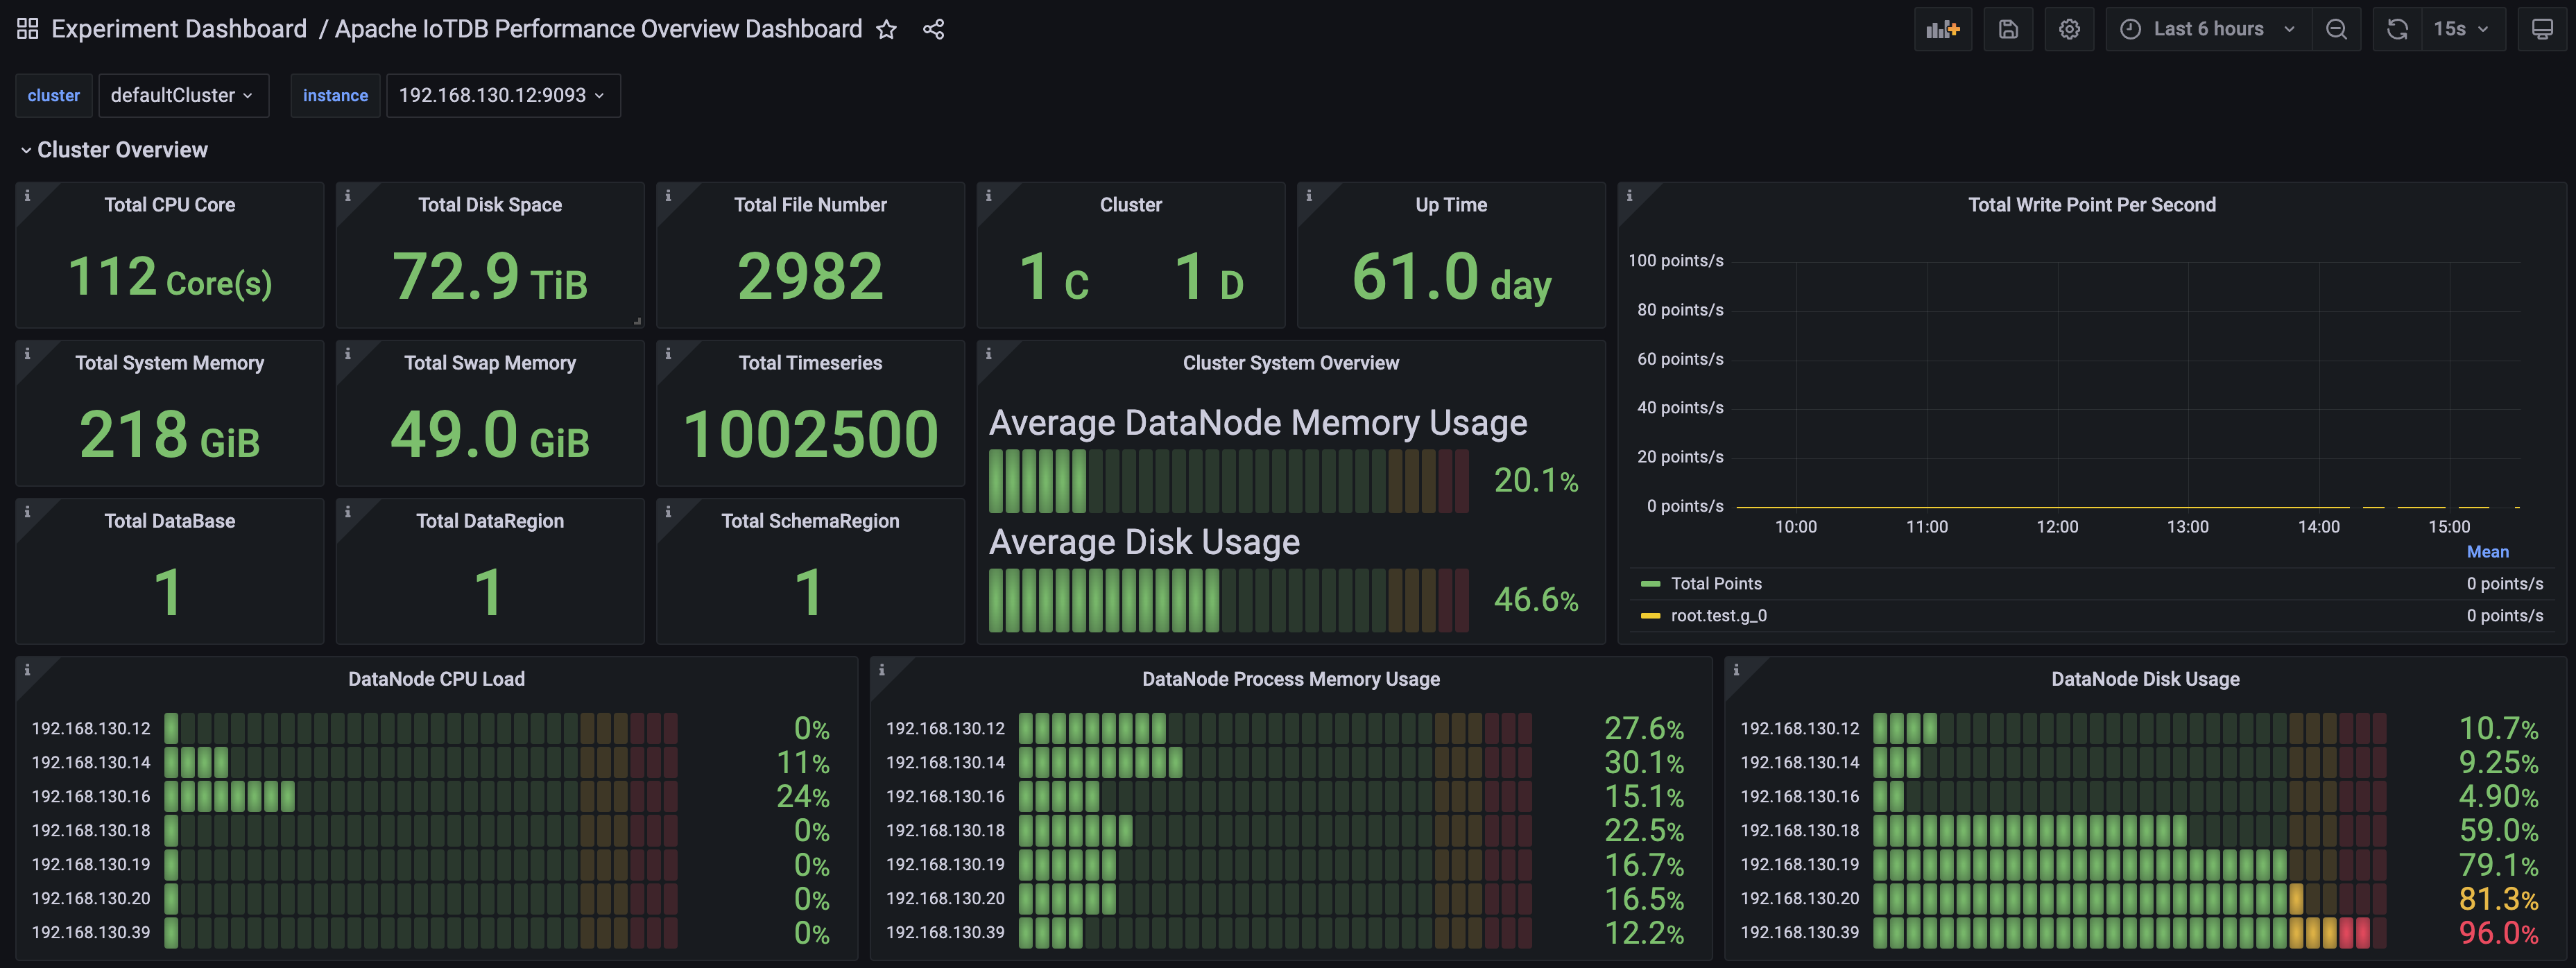
- Similarly, we can import the Apache Performance Overview Dashboard and see the following monitoring panel:
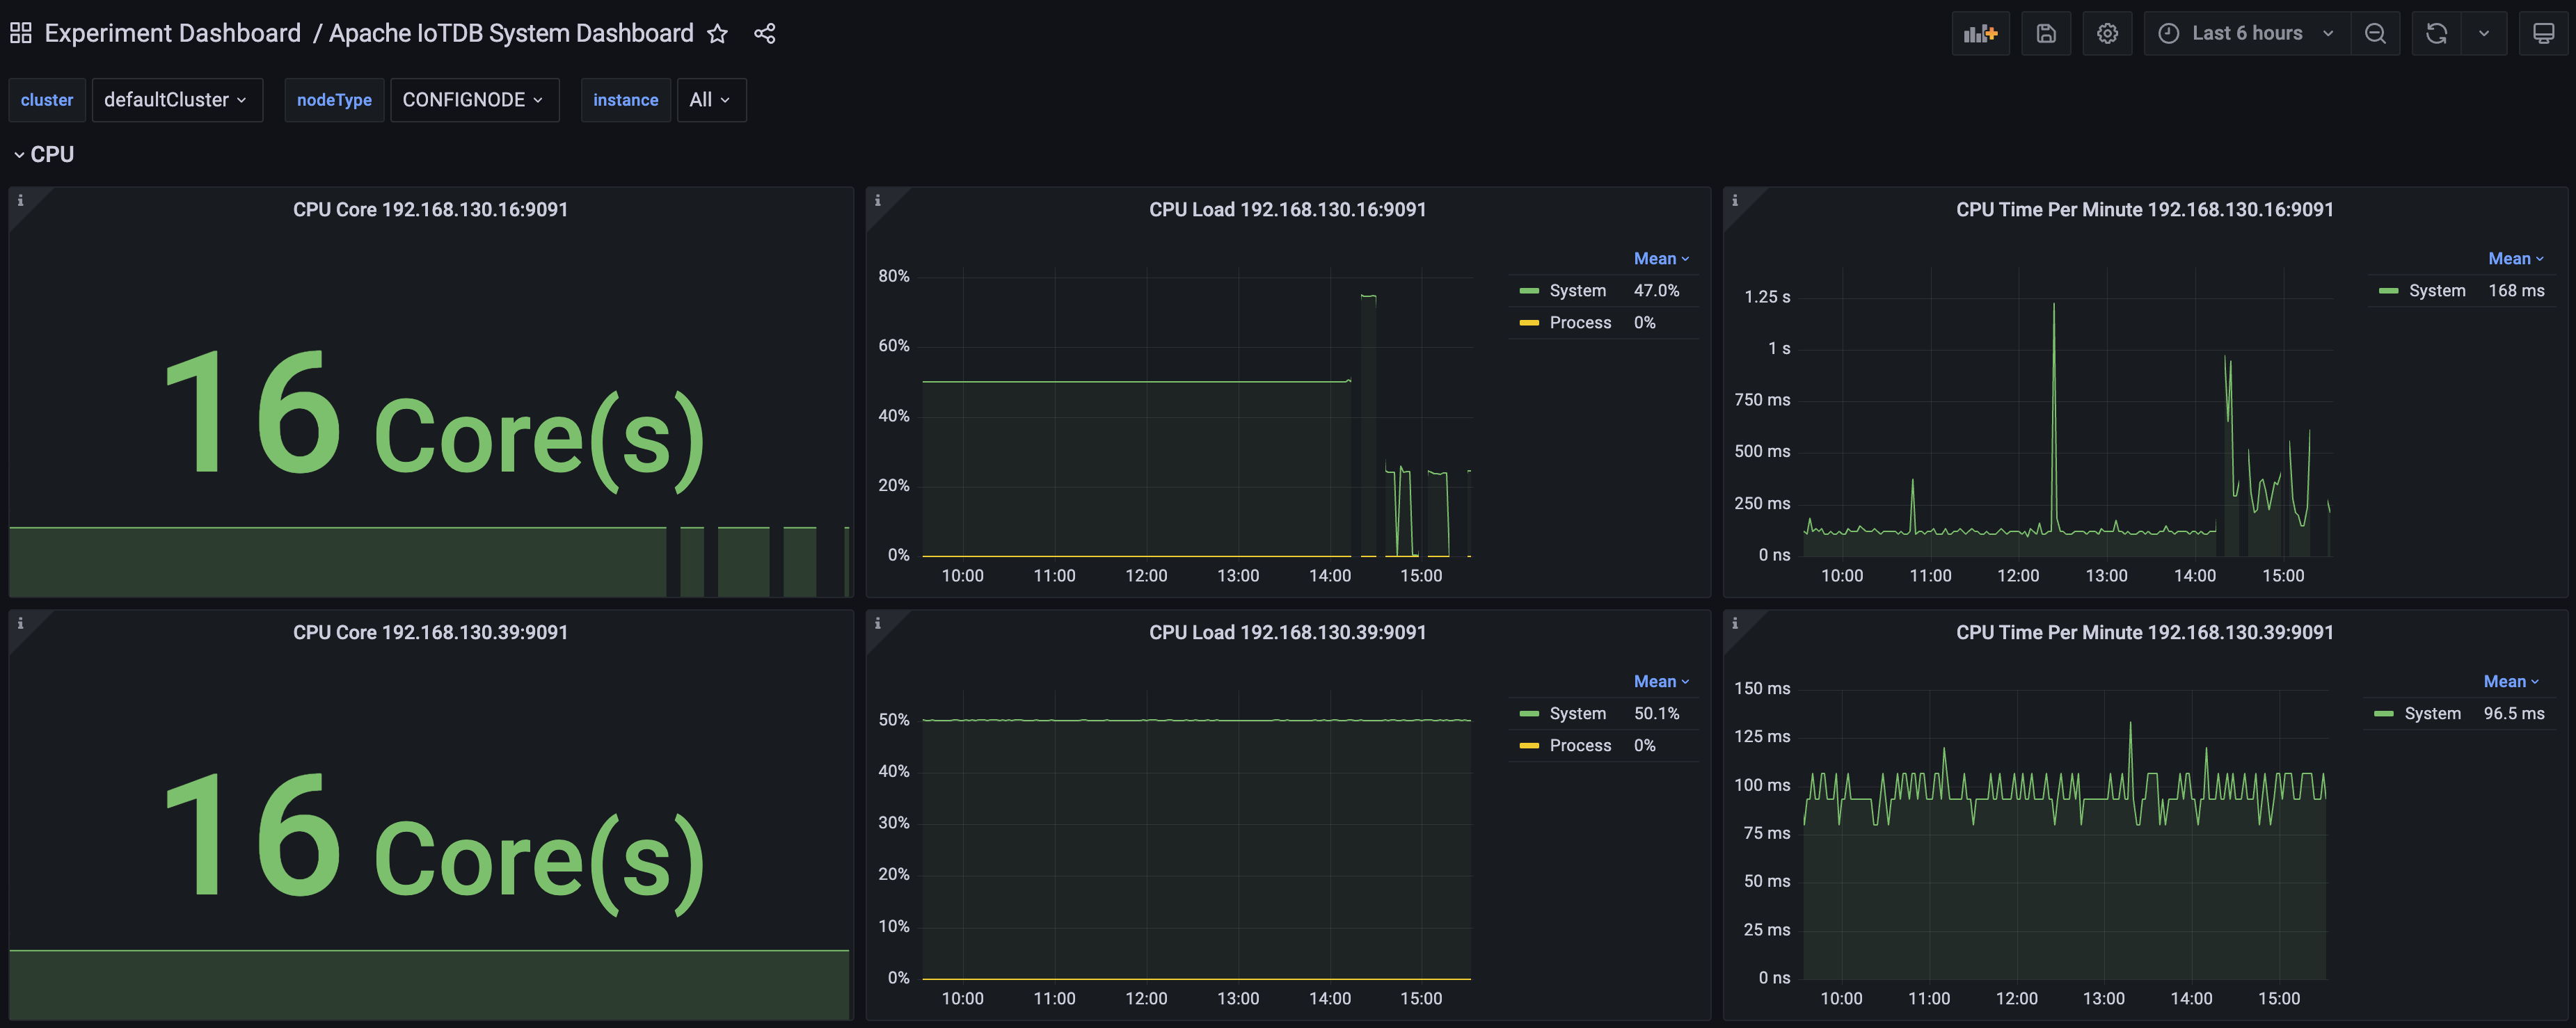
- Similarly, we can import the Apache System Overview Dashboard and see the following monitoring panel:
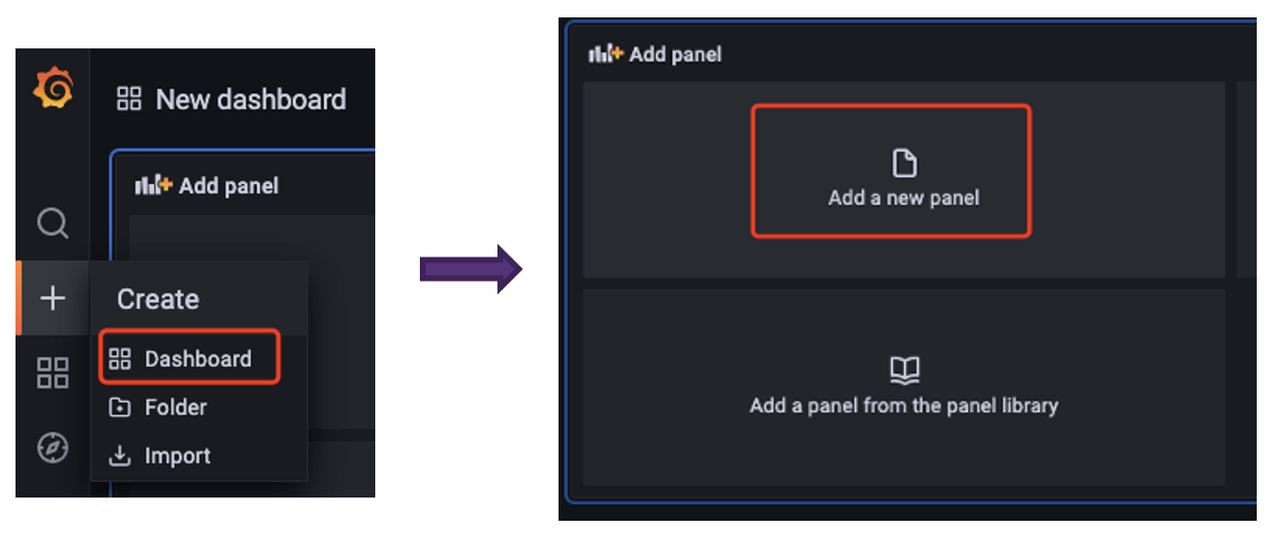
1.3.3 Step3:Creating a new Dashboard for data visualisation
- First create the Dashboard, then create the Panel.
- After that, you can visualize the monitoring-related data in the panel according to your needs (all relevant monitoring metrics can be filtered by selecting confignode/datanode in the job first).
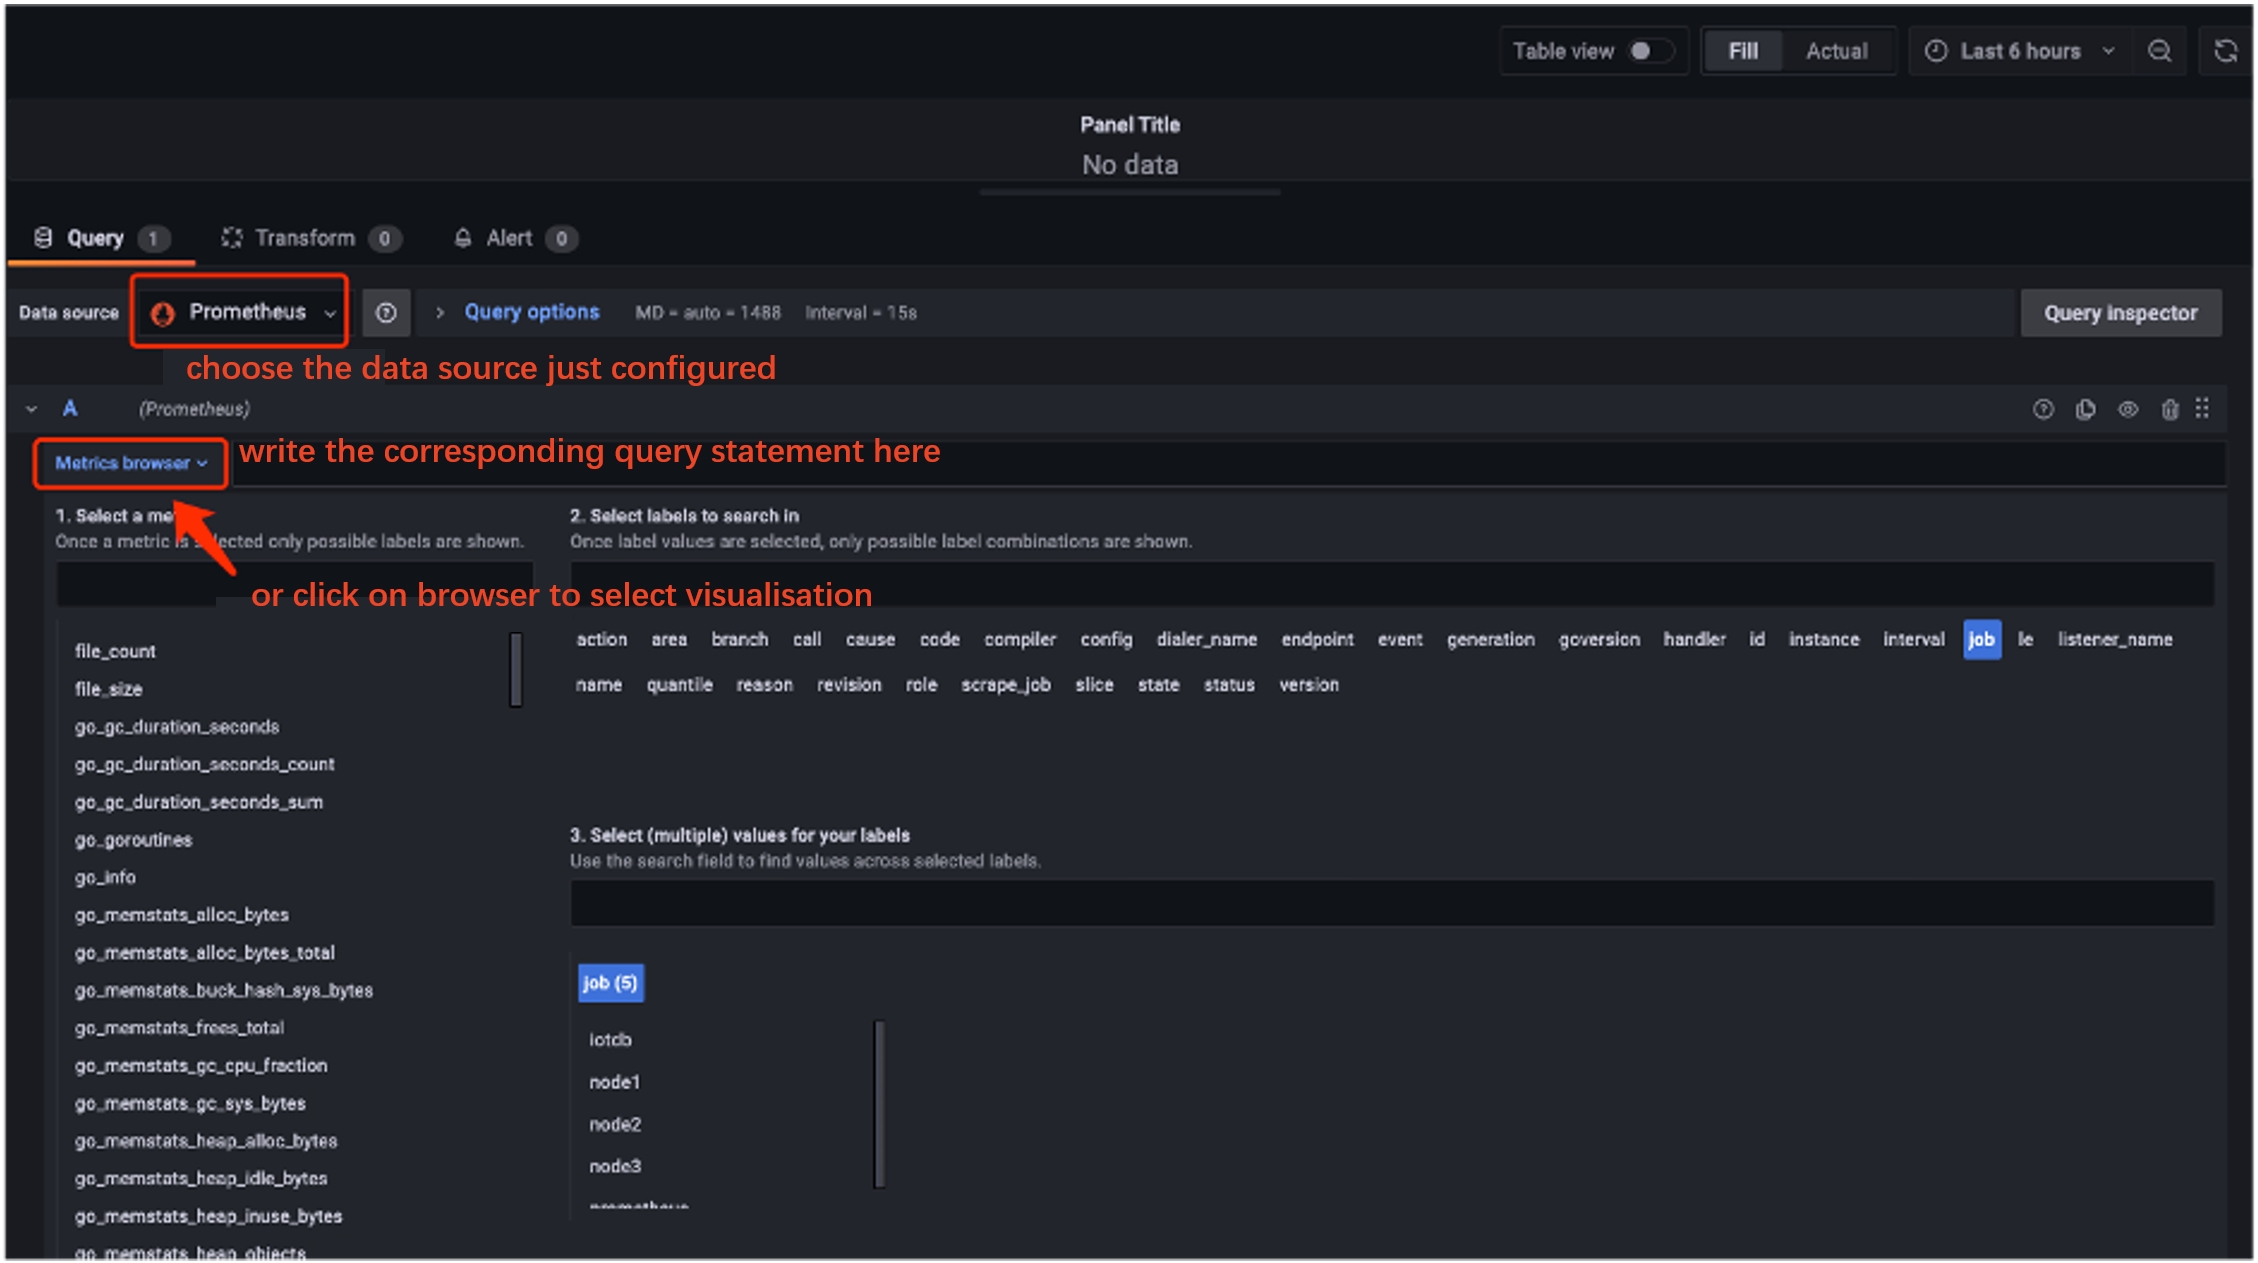
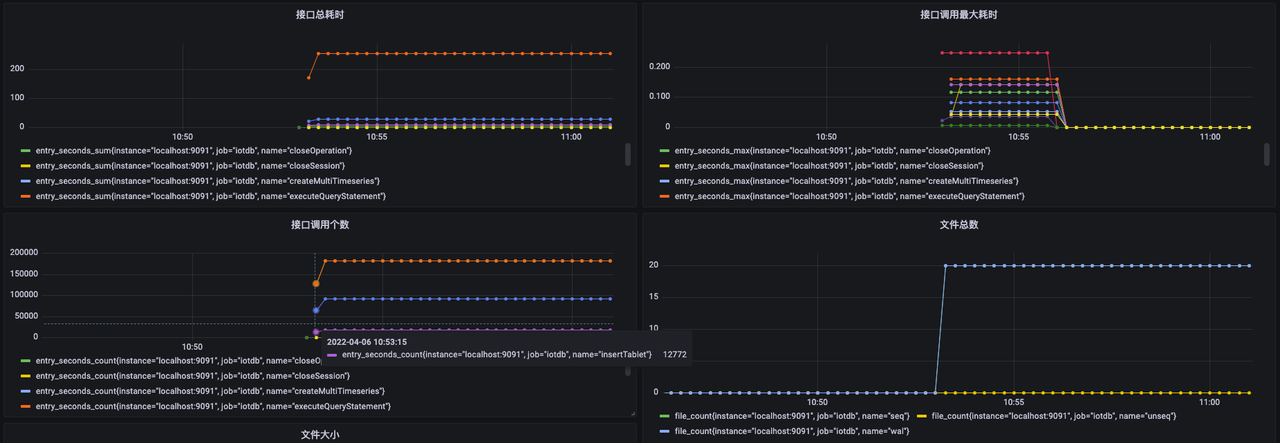
- Once the visualisation of the monitoring metrics selected for attention is complete, we get a panel like this: