Workbench Deployment
The visualization console is one of the supporting tools for IoTDB. It is an official application tool system used in various stages of database deployment, operation and maintenance management, and application development, making the use, operation and management of databases simpler and more efficient, truly achieving low-cost management and operation of databases. This document will help you install Workbench.
Installation Preparation
| Preparation Content | Name | Version Requirements | Link |
|---|---|---|---|
| Operating System | Windows or Linux | - | - |
| Installation Environment | JDK | Need>=V1.8.0_162 (recommended to use 11 or 17, please choose ARM or x64 installation package according to machine configuration when downloading) | https://www.oracle.com/java/technologies/downloads/ |
| Related Software | Prometheus | Requires installation of V2.30.3 and above. | https://prometheus.io/download/ |
| Database | IoTDB | Requires V1.2.0 Enterprise Edition and above | You can contact business or technical support to obtain |
| Console | IoTDB-Workbench-<version> | - | You can choose according to the appendix version comparison table and contact business or technical support to obtain it |
Installation Steps
Step 1: IoTDB enables monitoring indicator collection
Open the monitoring configuration item. The configuration items related to monitoring in IoTDB are disabled by default. Before deploying the monitoring panel, you need to open the relevant configuration items (note that the service needs to be restarted after enabling monitoring configuration).
Restart all nodes. After modifying the monitoring indicator configuration of three nodes, the confignode and datanode services of all nodes can be restarted:
./sbin/stop-standalone.sh      #Stop confignode and datanode first
./sbin/start-confignode.sh  -d #Start confignode
./sbin/start-datanode.sh  -d   #Start datanode
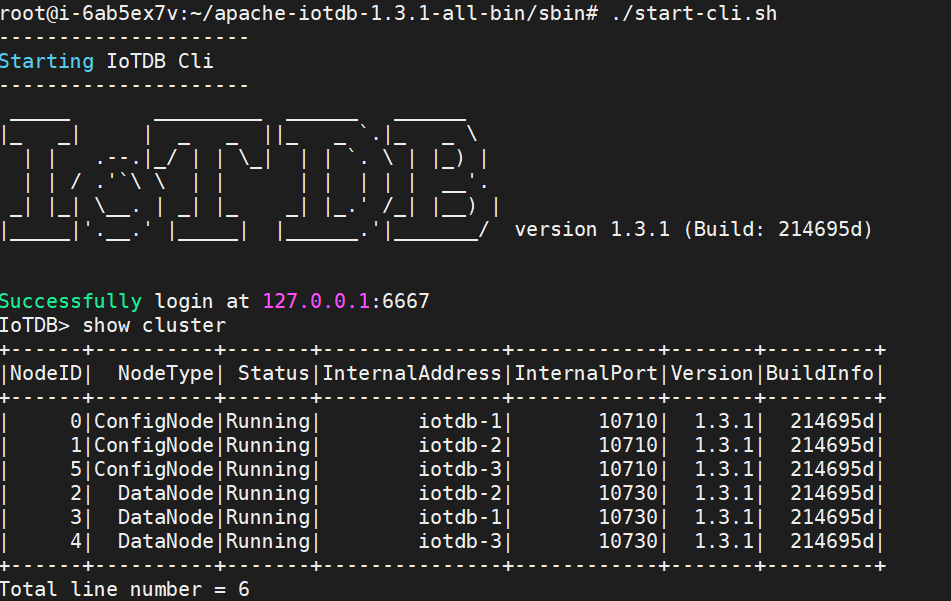
After restarting, confirm the running status of each node through the client. If the status is Running, it indicates successful configuration:
Step 2: Install and configure Prometheus
Download the Prometheus installation package, which requires installation of V2.30.3 and above. You can go to the Prometheus official website to download it (https://prometheus.io/docs/introduction/first_steps/)
Unzip the installation package and enter the unzipped folder:
tar xvfz prometheus-*.tar.gz
cd prometheus-*
Modify the configuration. Modify the configuration file prometheus.yml as follows
- Add configNode task to collect monitoring data for ConfigNode
- Add a datanode task to collect monitoring data for DataNodes
global:
scrape_interval: 15s
evaluation_interval: 15s
scrape_configs:
- job_name: "prometheus"
    static_configs:
    - targets: ["localhost:9090"]
- job_name: "confignode"
    static_configs:
    - targets: ["iotdb-1:9091","iotdb-2:9091","iotdb-3:9091"]
    honor_labels: true
- job_name: "datanode"
    static_configs:
    - targets: ["iotdb-1:9092","iotdb-2:9092","iotdb-3:9092"]
    honor_labels: true
Start Prometheus. The default expiration time for Prometheus monitoring data is 15 days. In production environments, it is recommended to adjust it to 180 days or more to track historical monitoring data for a longer period of time. The startup command is as follows:
./prometheus --config.file=prometheus.yml --storage.tsdb.retention.time=180d
Confirm successful startup. Enter in browser
http://IP:portGo to Prometheus and click on the Target interface under Status. When you see that all States are Up, it indicates successful configuration and connectivity.
Step 3: Install Workbench
Windows:
Enter the config directory of iotdb Workbench -
<version>Modify Workbench configuration file: Go to the
configfolder and modify the configuration fileapplication-prod.properties. If you are installing it locally, there is no need to modify it. If you are deploying it on a server, you need to modify the IP addressWorkbench can be deployed on a local or cloud server as long as it can connect to IoTDB
Configuration Before Modification After modification pipe.callbackUrl pipe.callbackUrl= http://127.0.0.1pipe.callbackUrl= http://<Workbench's IP address>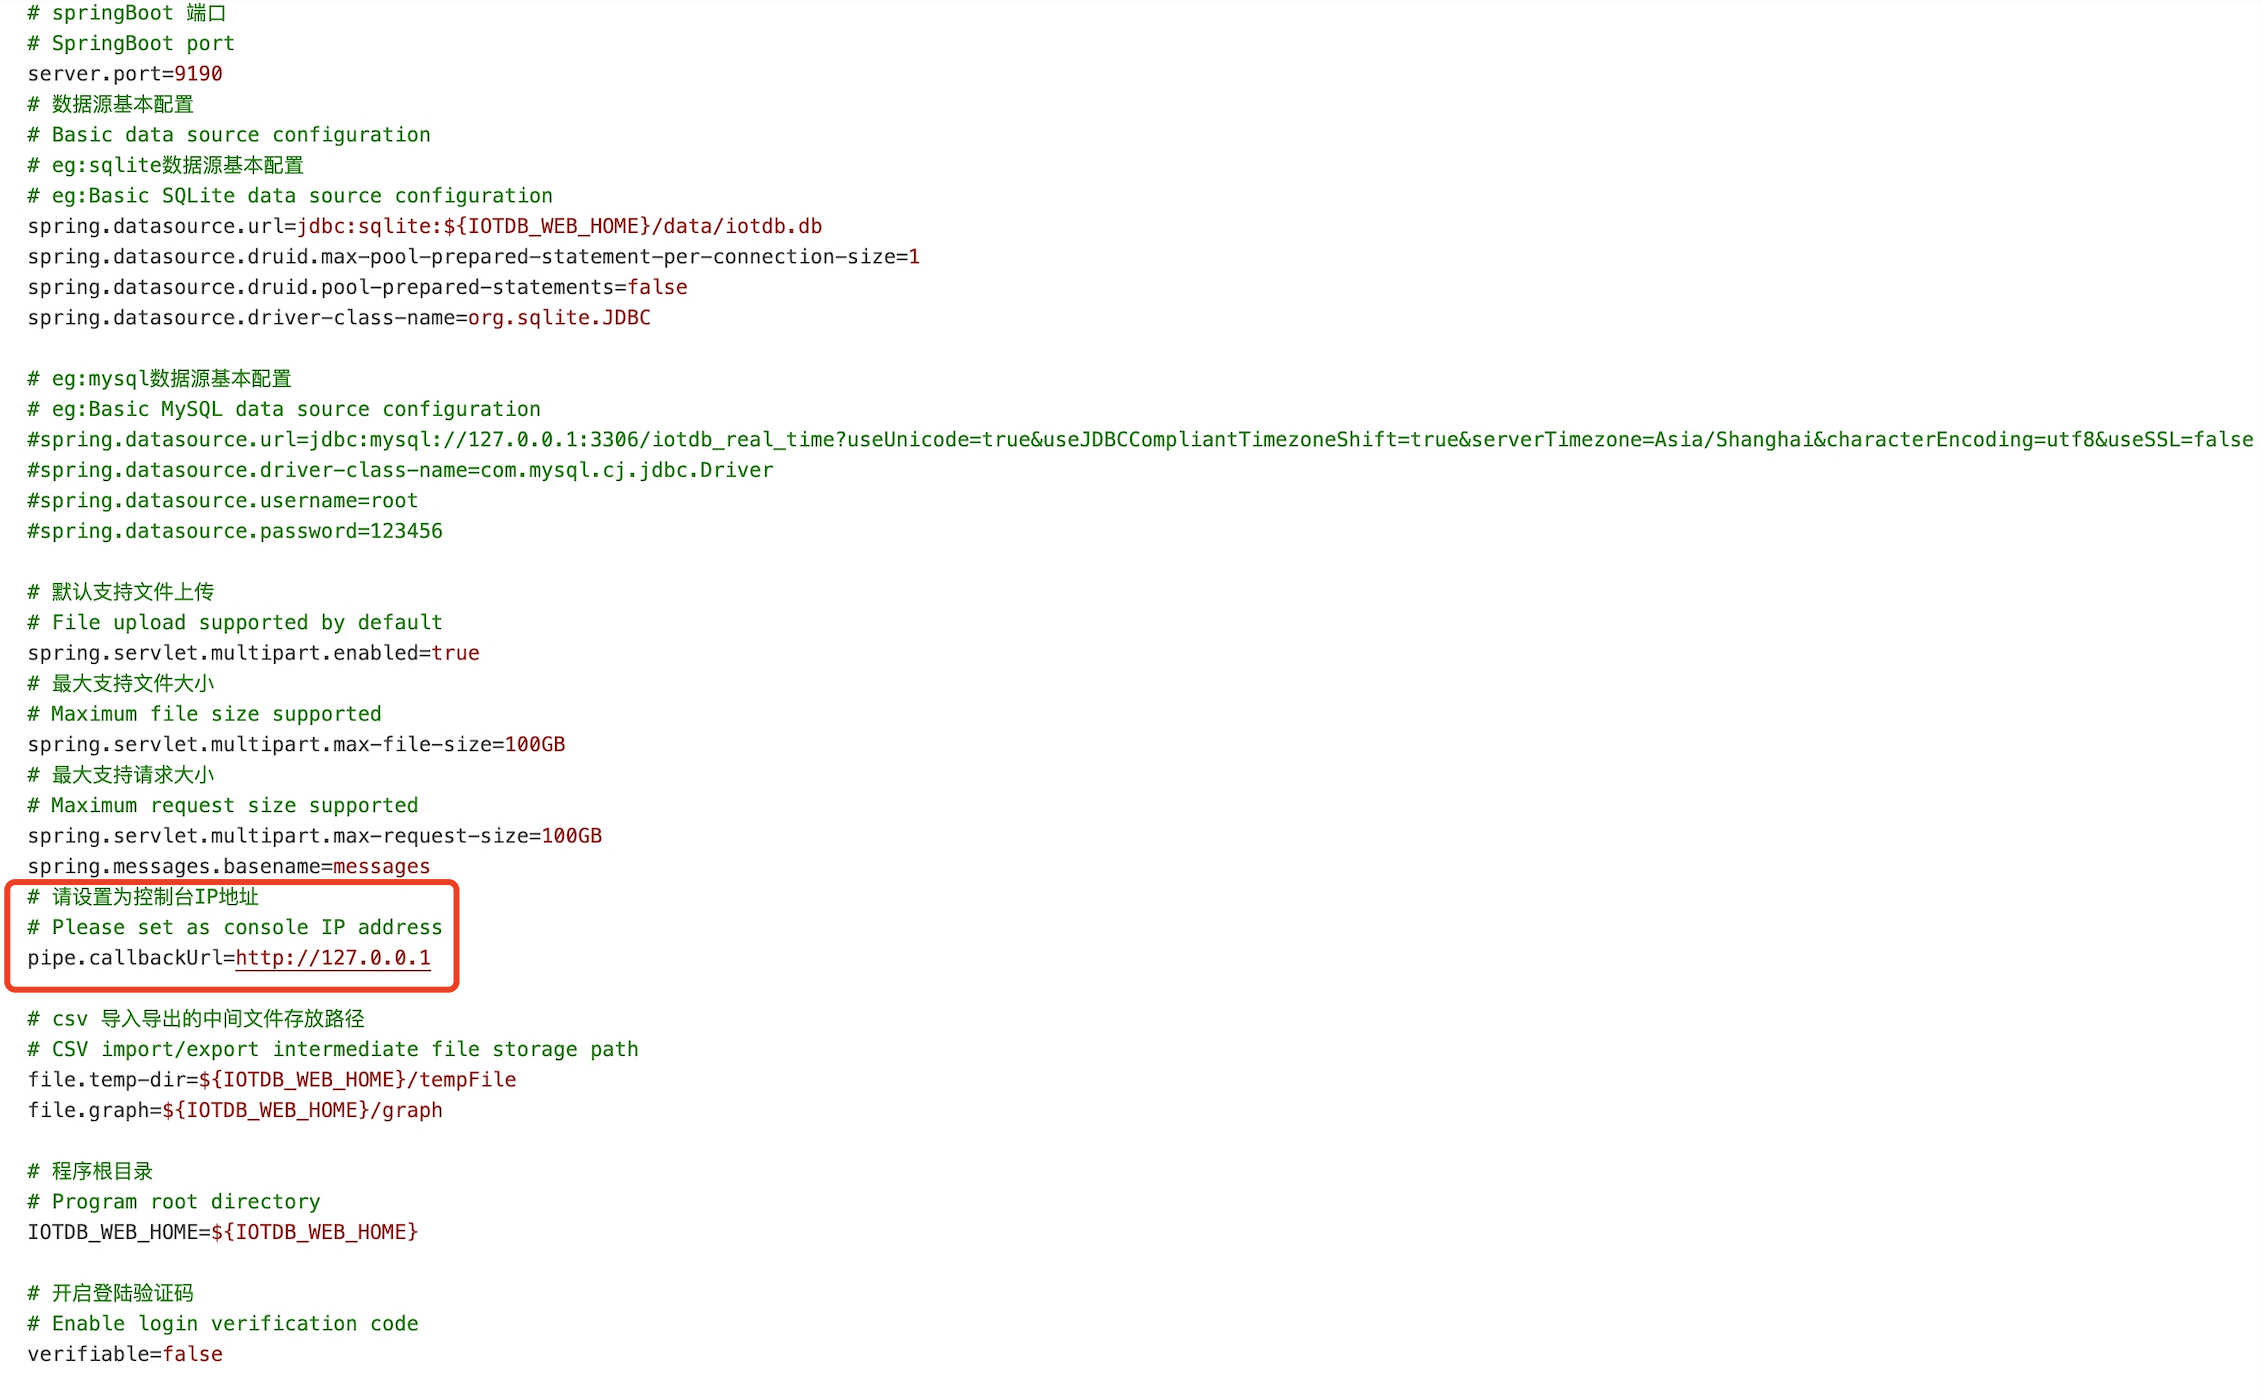
Startup program: Please execute the startup command in the sbin folder of IoTDB Workbench -
<version># Start Workbench in the background start.bat -d
You can use the
jpscommand to check if the startup was successful, as shown in the figure: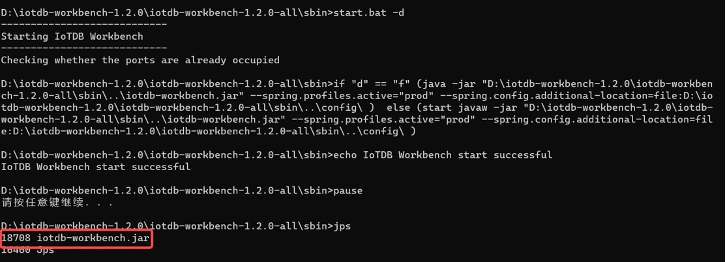
Verification successful: Open “
http://Server IP: Port in configuration file” in the browser to access, for example:“http://127.0.0.1:9190” When the login interface appears, it is considered successful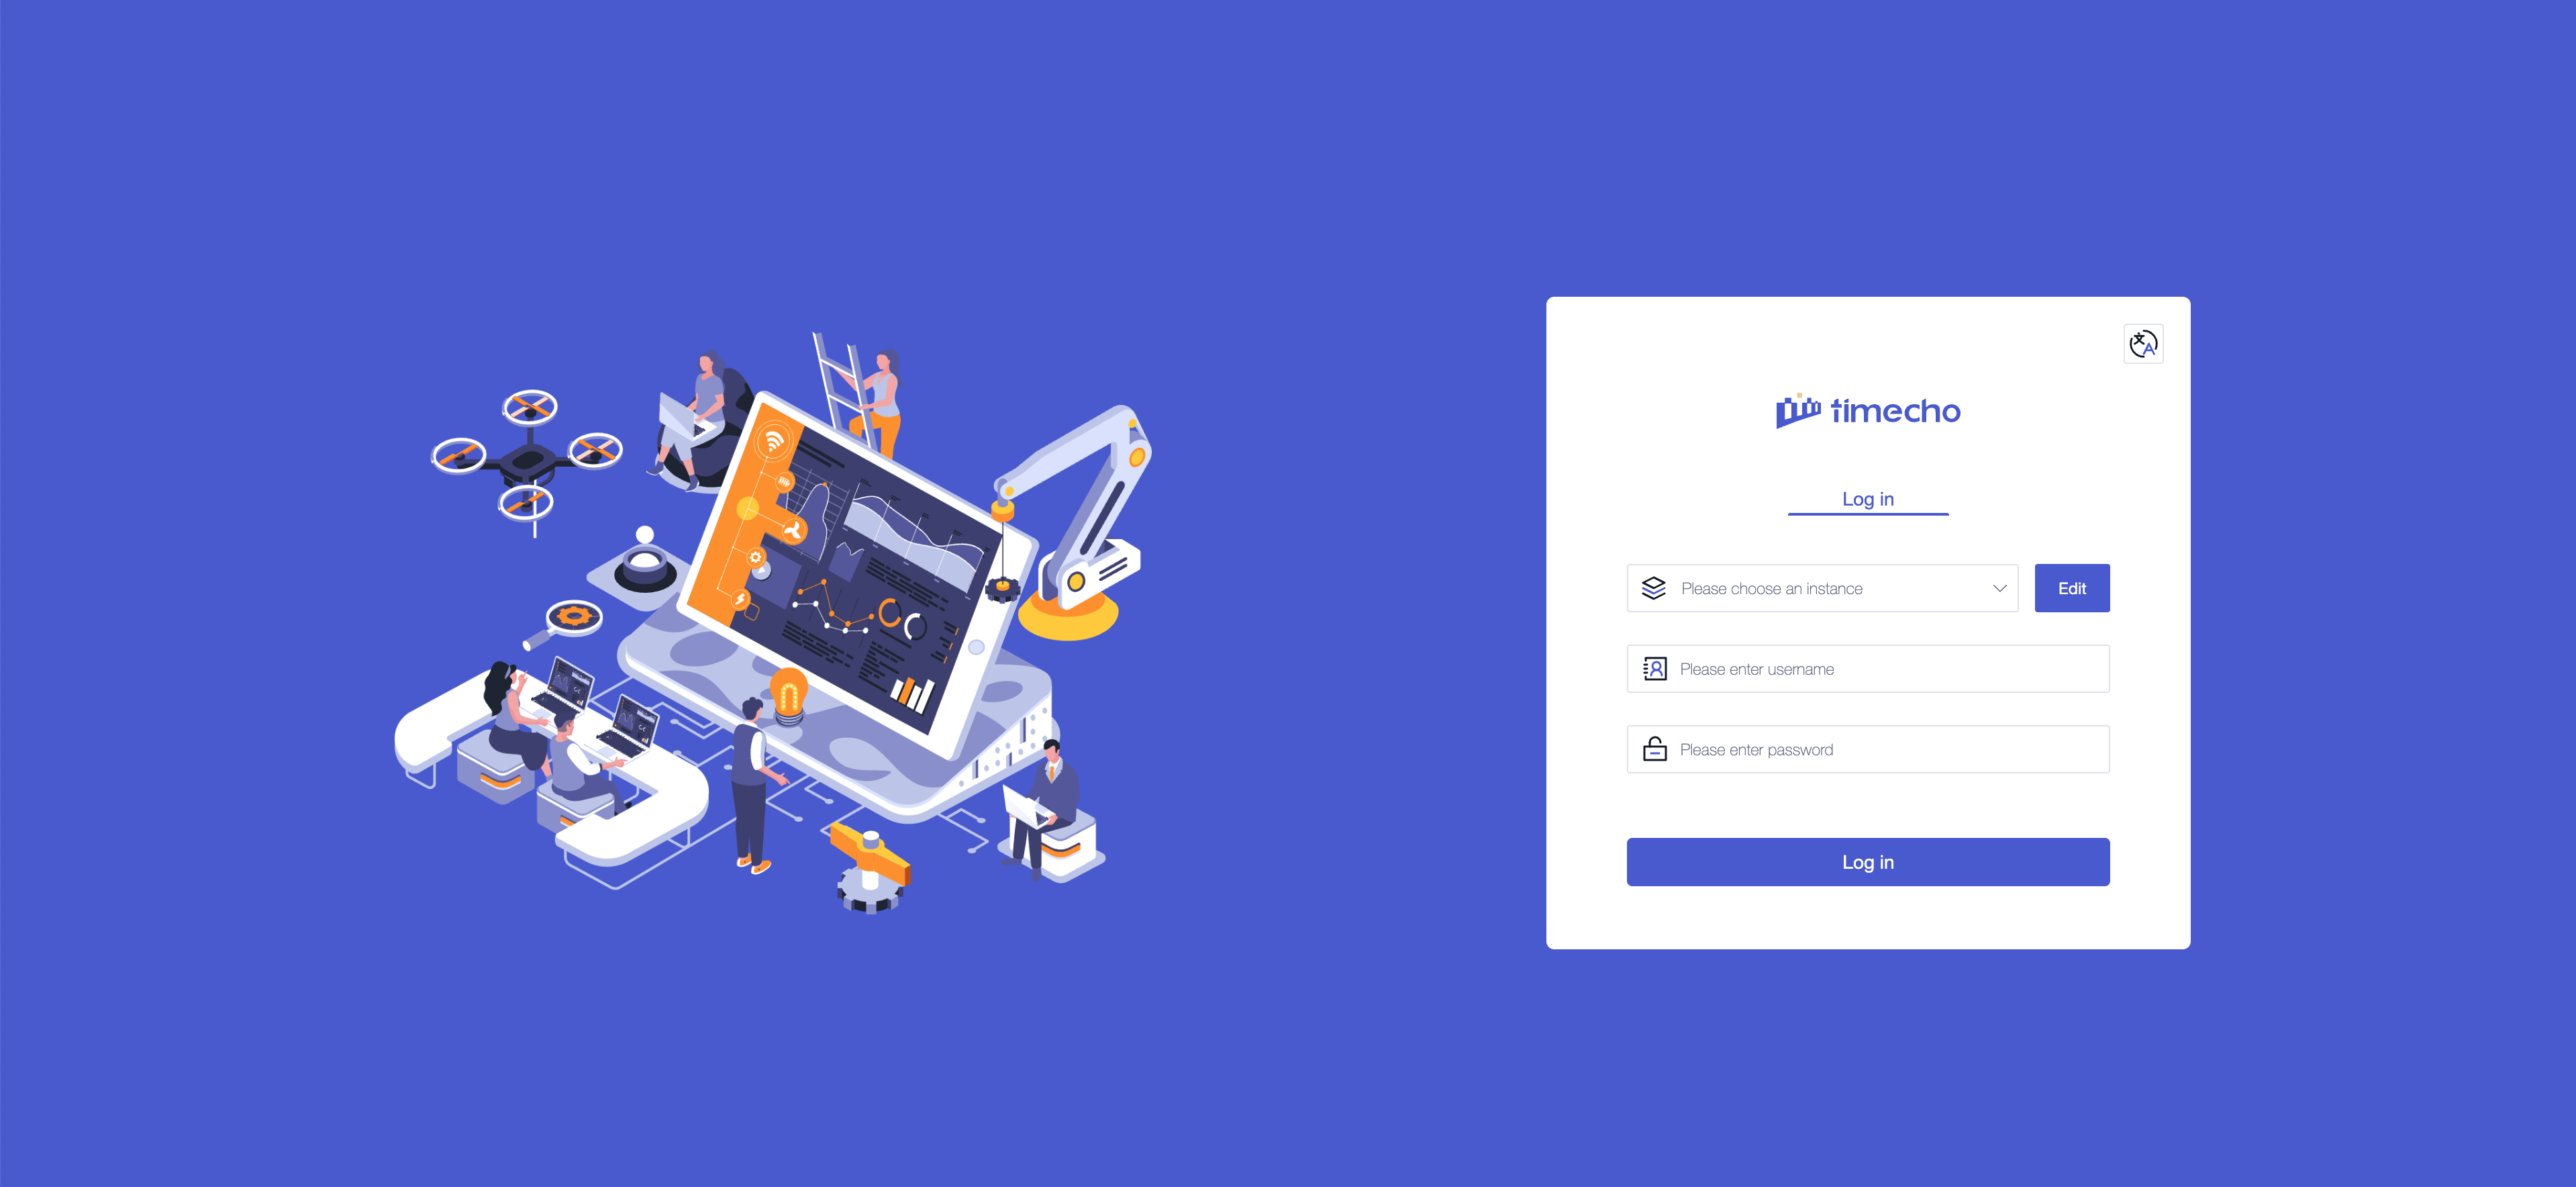
Linux:
Enter the IoTDB Workbench -
<version>directoryModify Workbench configuration: Go to the
configfolder and modify the configuration fileapplication-prod.properties. If you are installing it locally, there is no need to modify it. If you are deploying it on a server, you need to modify the IP addressWorkbench can be deployed on a local or cloud server as long as it can connect to IoTDB
Configuration Before Modification After modification pipe.callbackUrl pipe.callbackUrl= http://127.0.0.1pipe.callbackUrl= http://<Workbench's IP address>Startup program: Please execute the startup command in the sbin folder of IoTDB Workbench -
<version># Start Workbench in the background ./start.sh -d
You can use the
jpscommand to check if the startup was successful, as shown in the figure: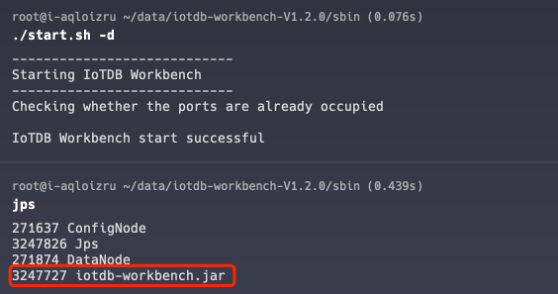
Verification successful: Open “
http://Server IP: Port in configuration file” in the browser to access, for example:“http://127.0.0.1:9190” When the login interface appears, it is considered successful
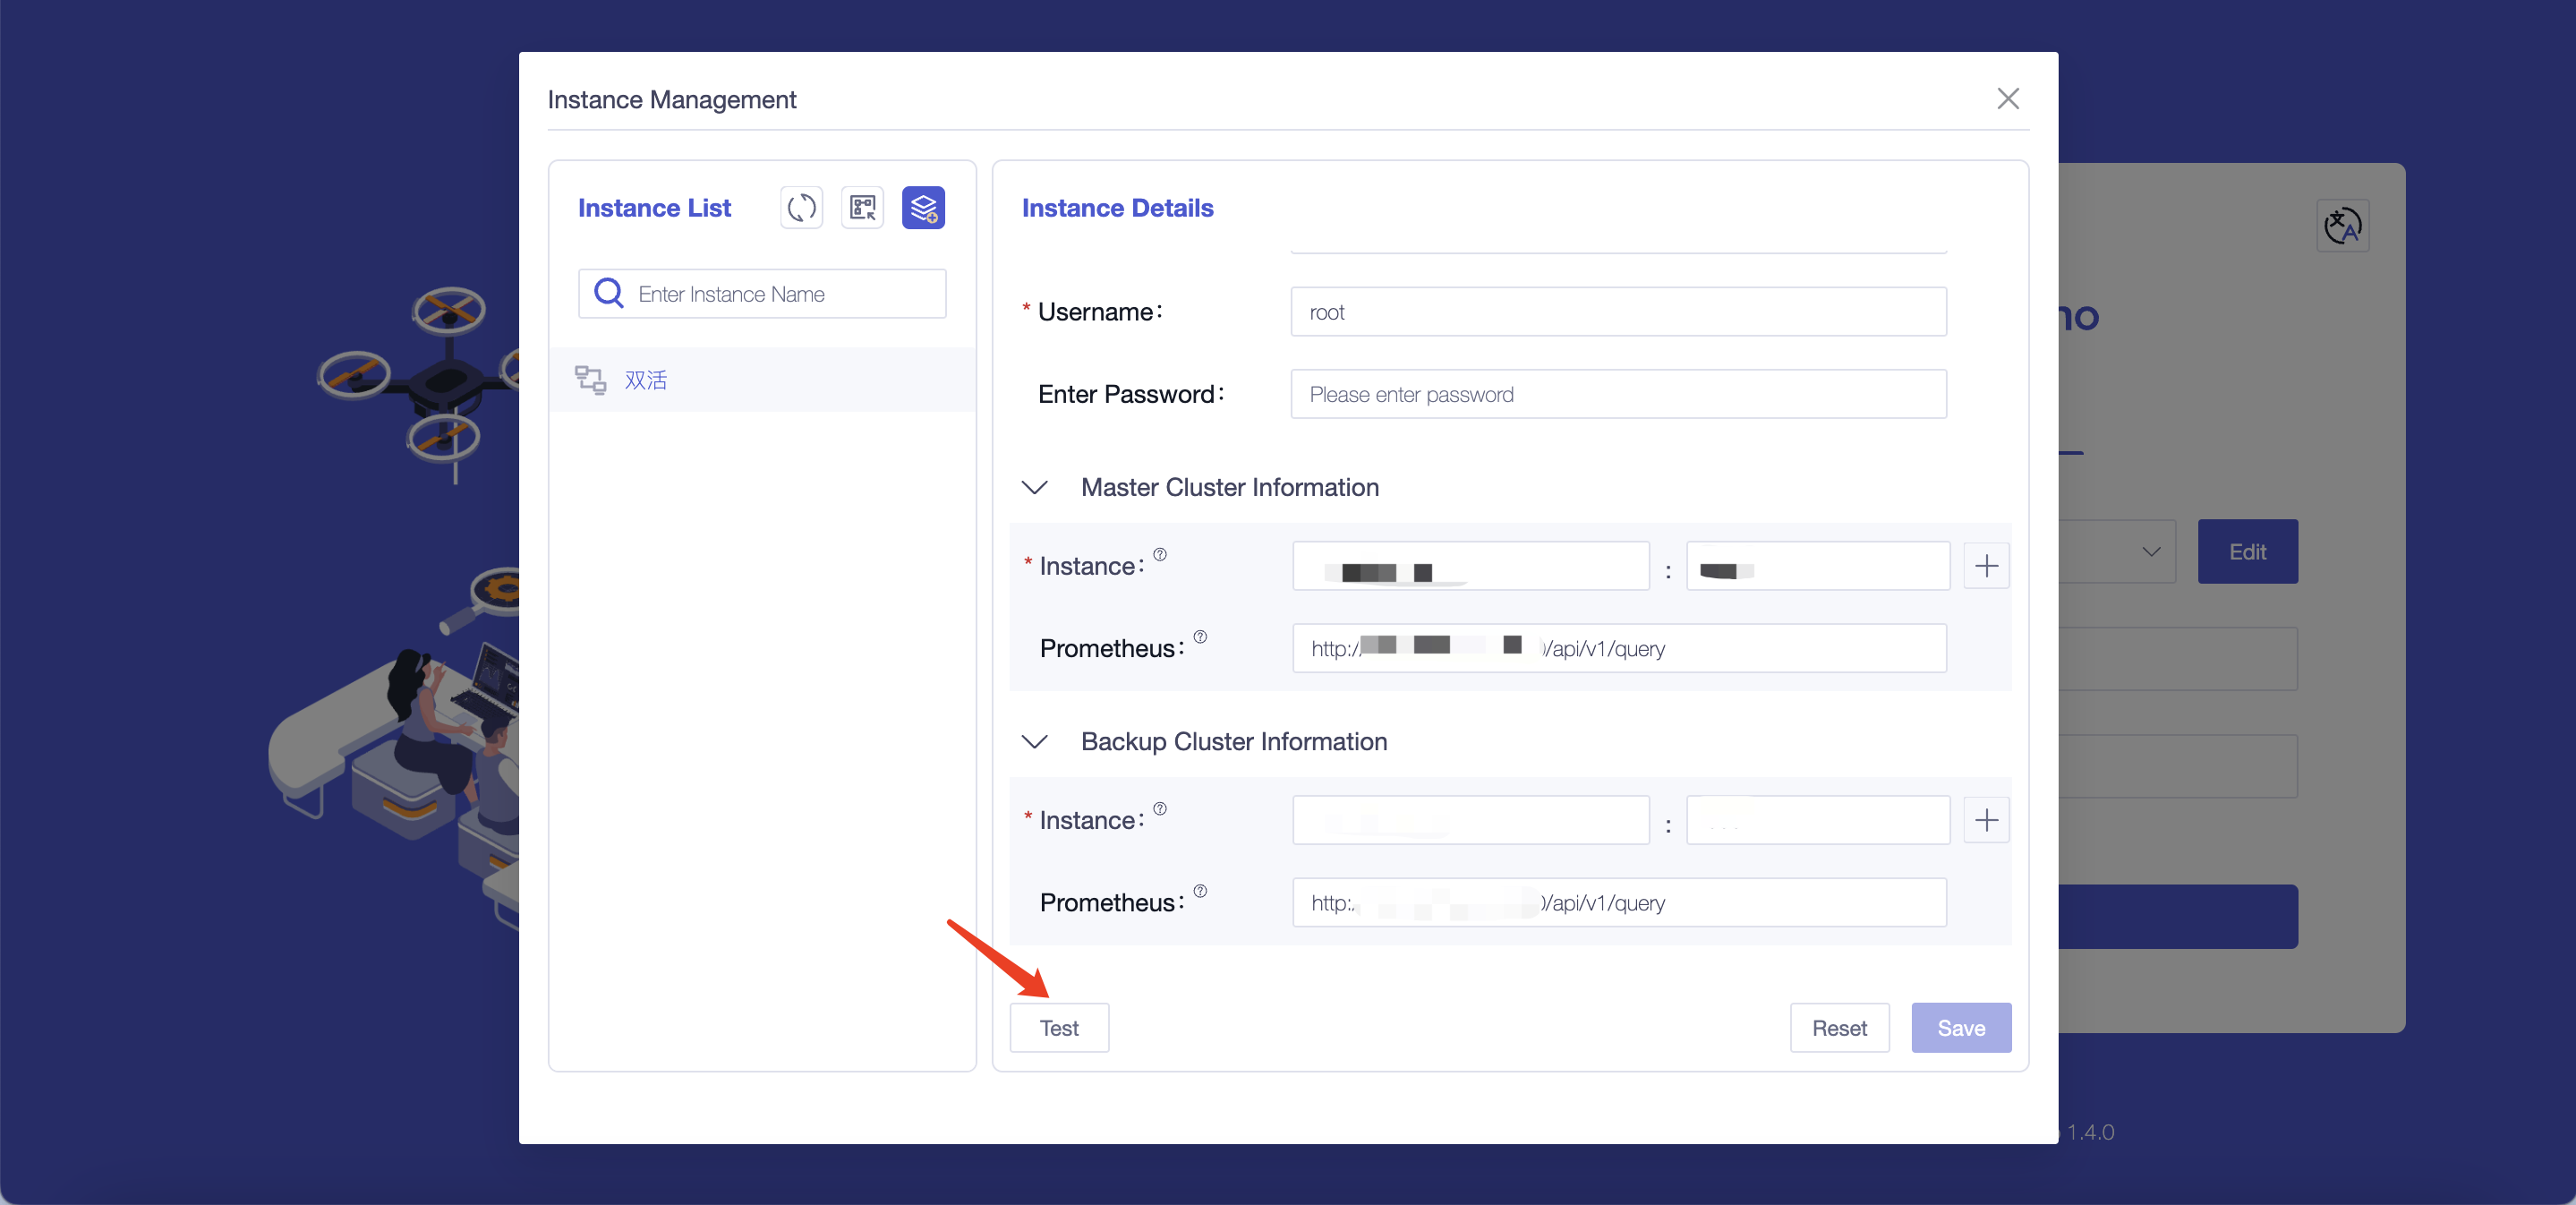
Step 4: Configure Instance Information
Configure instance information: You only need to fill in the following information to connect to the instance
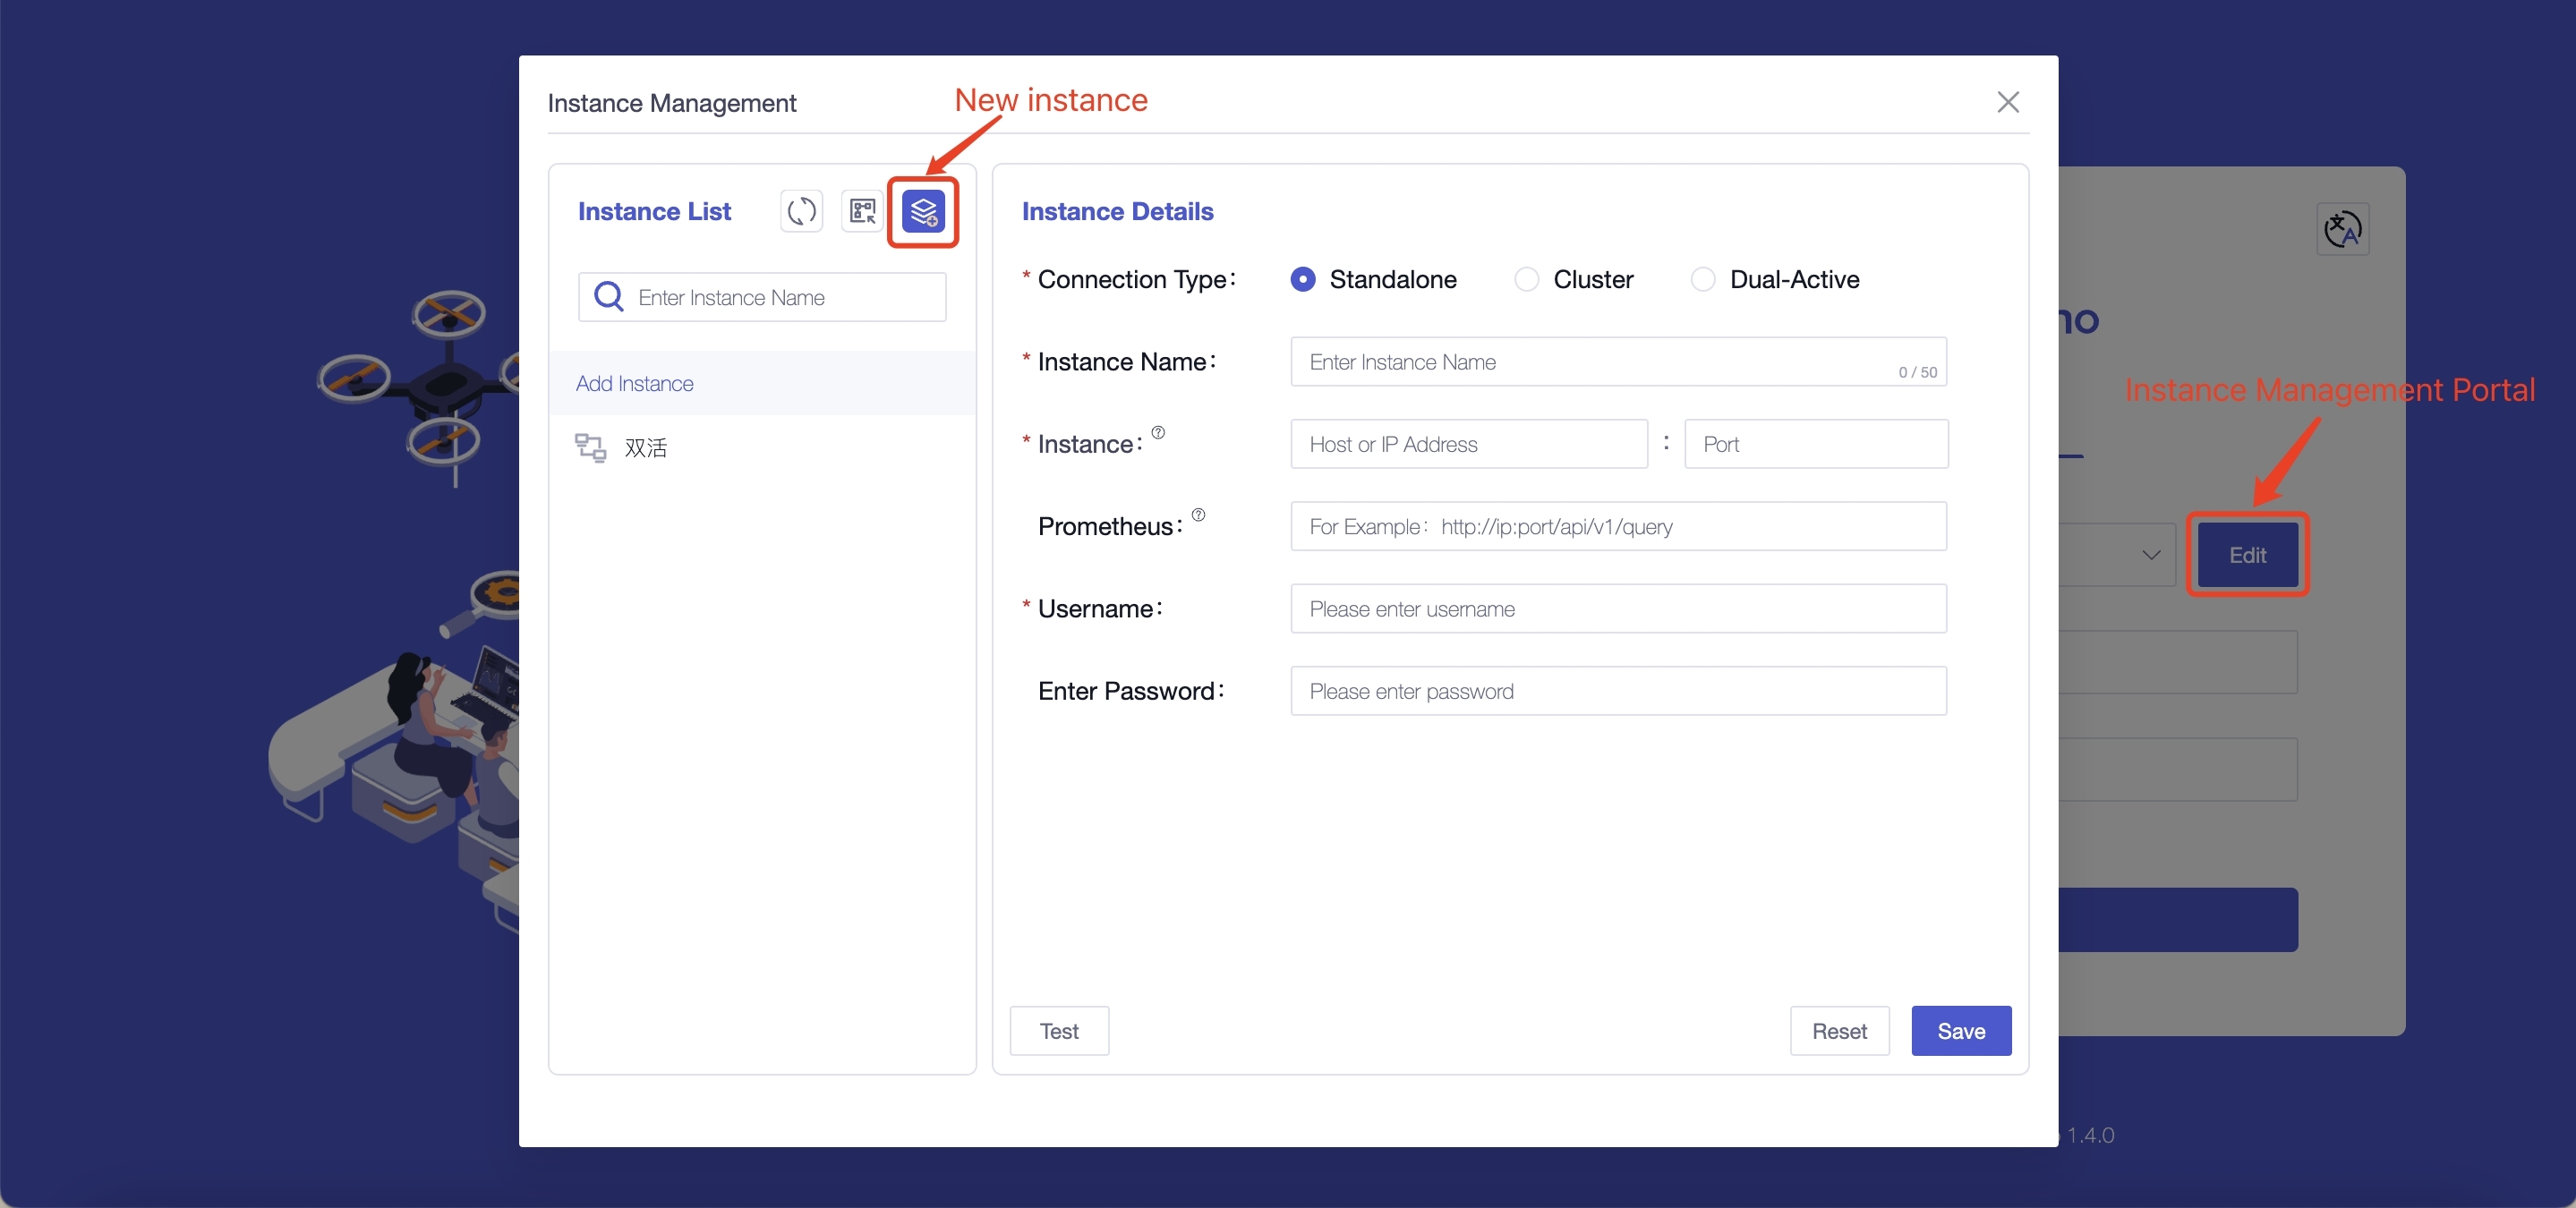
Field Name Is It A Required Field Field Meaning Default Value Connection Type Yes The content filled in for different connection types varies, and supports selecting “single machine, cluster, dual active” - Instance Name Yes You can distinguish different instances based on their names, with a maximum input of 50 characters - Instance Yes Fill in the database address ( dn_rpc_addressfield in theiotdb/conf/iotdb-system.propertiesfile) and port number (dn_rpc_portfield). Note: For clusters and dual active devices, clicking the “+” button supports entering multiple instance information- Prometheus No Fill in http://<Prometheus IP address>:<Prometheus port number>/app/v1/queryto view some monitoring information on the homepage. We recommend that you configure and use it- Username Yes Fill in the username for IoTDB, supporting input of 4 to 32 characters, including uppercase and lowercase letters, numbers, and special characters (! @ # $% ^&* () _+-=) root Enter Password No Fill in the password for IoTDB. To ensure the security of the database, we will not save the password. Please fill in the password yourself every time you connect to the instance or test root Test the accuracy of the information filled in: You can perform a connection test on the instance information by clicking the “Test” button
Appendix: IoTDB and Workbench Version Comparison Table
| Workbench Version Number | Release Note | Supports IoTDB Versions |
|---|---|---|
| V1.4.0 | New tree model display and internationalization | V1.3.2 and above versions |
| V1.3.1 | New analysis methods have been added to the analysis function, and functions such as optimizing import templates have been optimized | V1.3.2 and above versions |
| V1.3.0 | Add database configuration function | V1.3.2 and above versions |
| V1.2.6 | Optimize the permission control function of each module | V1.3.1 and above versions |
| V1.2.5 | The visualization function has added the concept of “commonly used templates”, and all interface optimization and page caching functions have been supplemented | V1.3.0 and above versions |
| V1.2.4 | The calculation function has added the “import and export” function, and the measurement point list has added the “time alignment” field | V1.2.2 and above versions |
| V1.2.3 | New “activation details” and analysis functions added to the homepage | V1.2.2 and above versions |
| V1.2.2 | Optimize the display content and other functions of “measurement point description” | V1.2.2 and above versions |
| V1.2.1 | New “Monitoring Panel” added to the data synchronization interface to optimize Prometheus prompt information | V1.2.2 and above versions |
| V1.2.0 | New Workbench version upgrade | V1.2.0 and above versions |