Monitor Tool
Prometheus
The mapping from metric type to prometheus format
For metrics whose Metric Name is name and Tags are K1=V1, ..., Kn=Vn, the mapping is as follows, where value is a specific value
| Metric Type | Mapping |
|---|---|
| Counter | name_total{cluster=“clusterName”, nodeType=“nodeType”, nodeId=“nodeId”, k1=“V1”, ..., Kn=“Vn”} value |
| AutoGauge、Gauge | name{cluster=“clusterName”, nodeType=“nodeType”, nodeId=“nodeId”, k1=“V1”, ..., Kn=“Vn”} value |
| Histogram | name_max{cluster=“clusterName”, nodeType=“nodeType”, nodeId=“nodeId”, k1=“V1”, ..., Kn=“Vn”} value name_sum{cluster=“clusterName”, nodeType=“nodeType”, nodeId=“nodeId”, k1=“V1”, ..., Kn=“Vn”} value name_count{cluster=“clusterName”, nodeType=“nodeType”, nodeId=“nodeId”, k1=“V1”, ..., Kn=“Vn”} value name{cluster=“clusterName”, nodeType=“nodeType”, nodeId=“nodeId”, k1=“V1”, ..., Kn=“Vn”, quantile=“0.5”} value name{cluster=“clusterName”, nodeType=“nodeType”, nodeId=“nodeId”, k1=“V1”, ..., Kn=“Vn”, quantile=“0.99”} value |
| Rate | name_total{cluster=“clusterName”, nodeType=“nodeType”, nodeId=“nodeId”, k1=“V1”, ..., Kn=“Vn”} value name_total{cluster=“clusterName”, nodeType=“nodeType”, nodeId=“nodeId”, k1=“V1”, ..., Kn=“Vn”, rate=“m1”} value name_total{cluster=“clusterName”, nodeType=“nodeType”, nodeId=“nodeId”, k1=“V1”, ..., Kn=“Vn”, rate=“m5”} value name_total{cluster=“clusterName”, nodeType=“nodeType”, nodeId=“nodeId”, k1=“V1”, ..., Kn=“Vn”, rate=“m15”} value name_total{cluster=“clusterName”, nodeType=“nodeType”, nodeId=“nodeId”, k1=“V1”, ..., Kn=“Vn”, rate=“mean”} value |
| Timer | name_seconds_max{cluster=“clusterName”, nodeType=“nodeType”, nodeId=“nodeId”, k1=“V1”, ..., Kn=“Vn”} value name_seconds_sum{cluster=“clusterName”, nodeType=“nodeType”, nodeId=“nodeId”, k1=“V1”, ..., Kn=“Vn”} value name_seconds_count{cluster=“clusterName”, nodeType=“nodeType”, nodeId=“nodeId”, k1=“V1”, ..., Kn=“Vn”} value name_seconds{cluster=“clusterName”, nodeType=“nodeType”, nodeId=“nodeId”, k1=“V1”, ..., Kn=“Vn”, quantile=“0.5”} value name_seconds{cluster=“clusterName”, nodeType=“nodeType”, nodeId=“nodeId”, k1=“V1”, ..., Kn=“Vn”, quantile=“0.99”} value |
Config File
- Taking DataNode as an example, modify the iotdb-datanode.properties configuration file as follows:
dn_metric_reporter_list=PROMETHEUS
dn_metric_level=CORE
dn_metric_prometheus_reporter_port=9091
Then you can get metrics data as follows
- Start IoTDB DataNodes
- Open a browser or use
curlto visithttp://servier_ip:9091/metrics, you can get the following metric data:
...
# HELP file_count
# TYPE file_count gauge
file_count{name="wal",} 0.0
file_count{name="unseq",} 0.0
file_count{name="seq",} 2.0
...
Prometheus + Grafana
As shown above, IoTDB exposes monitoring metrics data in the standard Prometheus format to the outside world. Prometheus can be used to collect and store monitoring indicators, and Grafana can be used to visualize monitoring indicators.
The following picture describes the relationships among IoTDB, Prometheus and Grafana
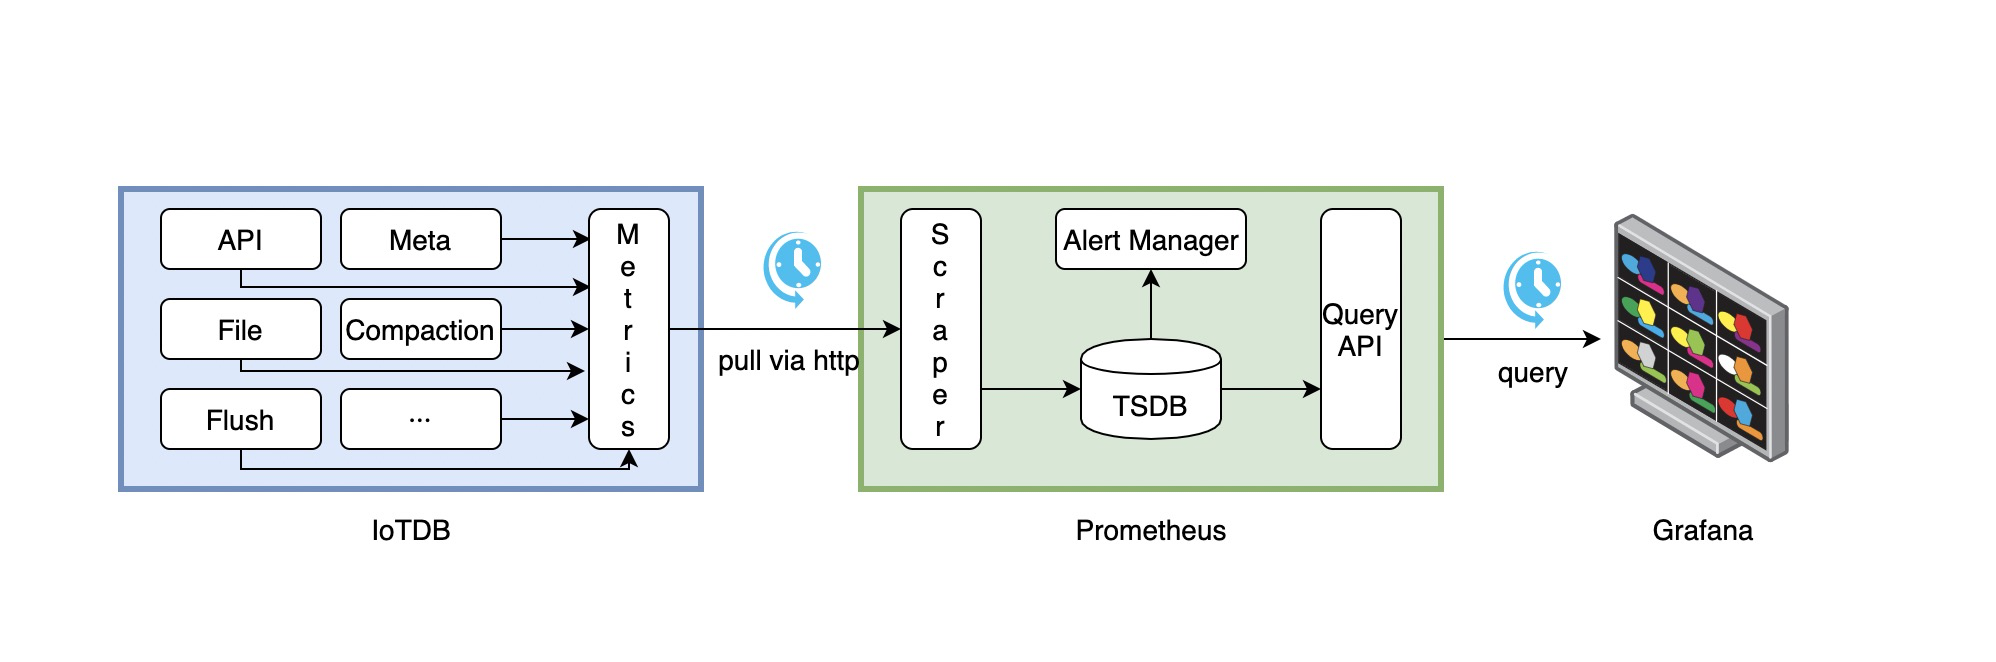
- Along with running, IoTDB will collect its metrics continuously.
- Prometheus scrapes metrics from IoTDB at a constant interval (can be configured).
- Prometheus saves these metrics to its inner TSDB.
- Grafana queries metrics from Prometheus at a constant interval (can be configured) and then presents them on the graph.
So, we need to do some additional works to configure and deploy Prometheus and Grafana.
For instance, you can config your Prometheus as follows to get metrics data from IoTDB:
job_name: pull-metrics
honor_labels: true
honor_timestamps: true
scrape_interval: 15s
scrape_timeout: 10s
metrics_path: /metrics
scheme: http
follow_redirects: true
static_configs:
  - targets:
      - localhost:9091
The following documents may help you have a good journey with Prometheus and Grafana.
Grafana query metrics from Prometheus
Apache IoTDB Dashboard
Apache IoTDB Dashboard is available as a supplement to IoTDB Enterprise Edition, designed for unified centralized operations and management. With it, multiple clusters can be monitored through a single panel. You can access the Dashboard's Json file by contacting Commerce.
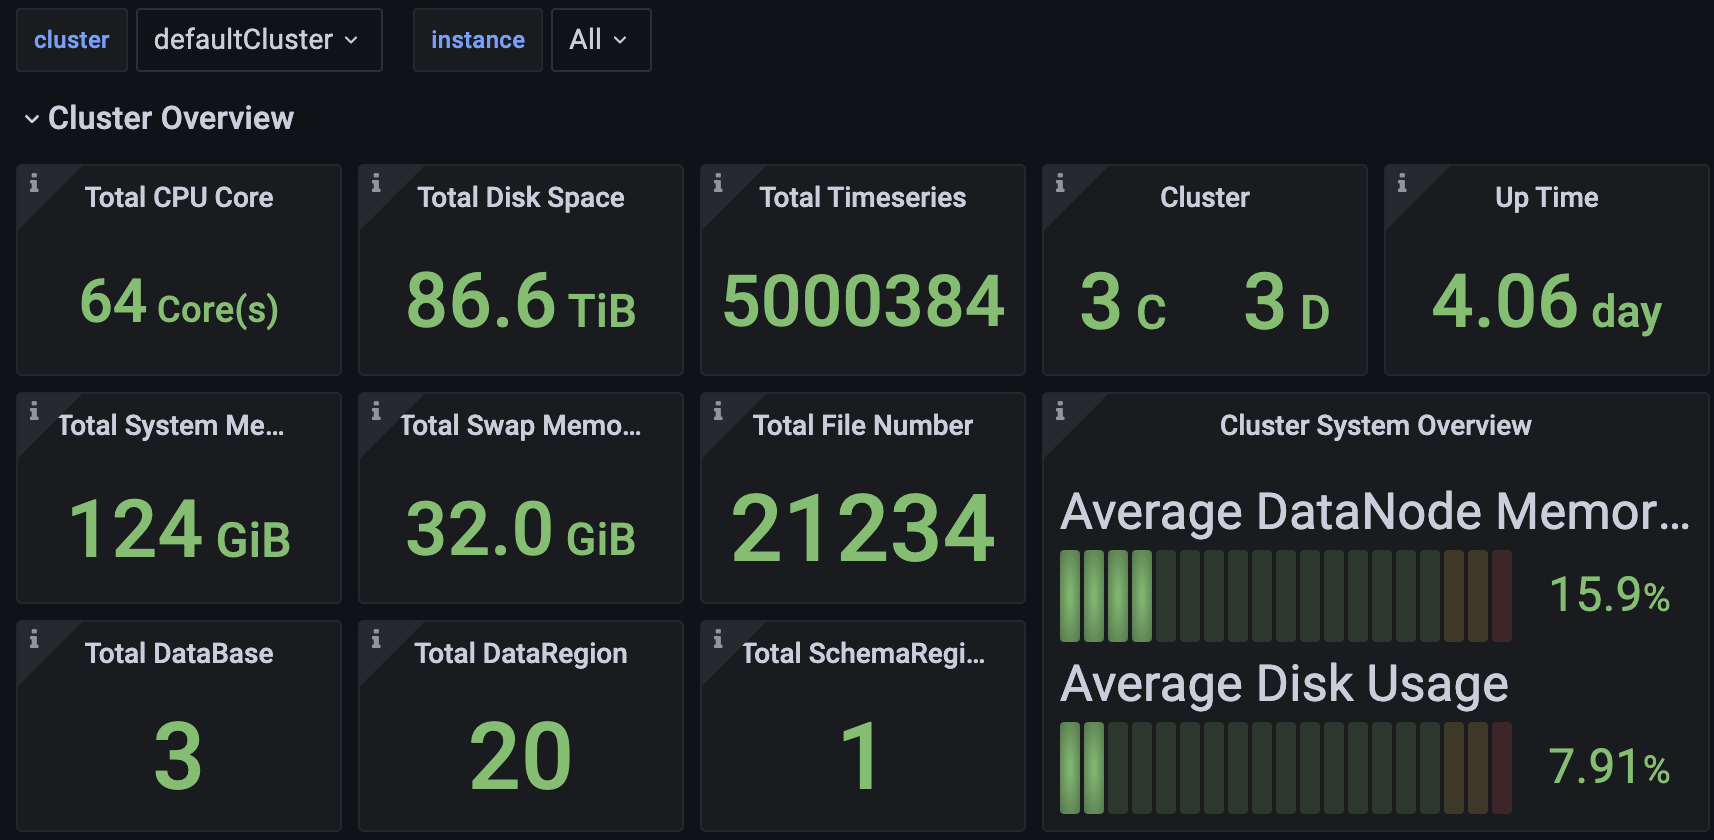
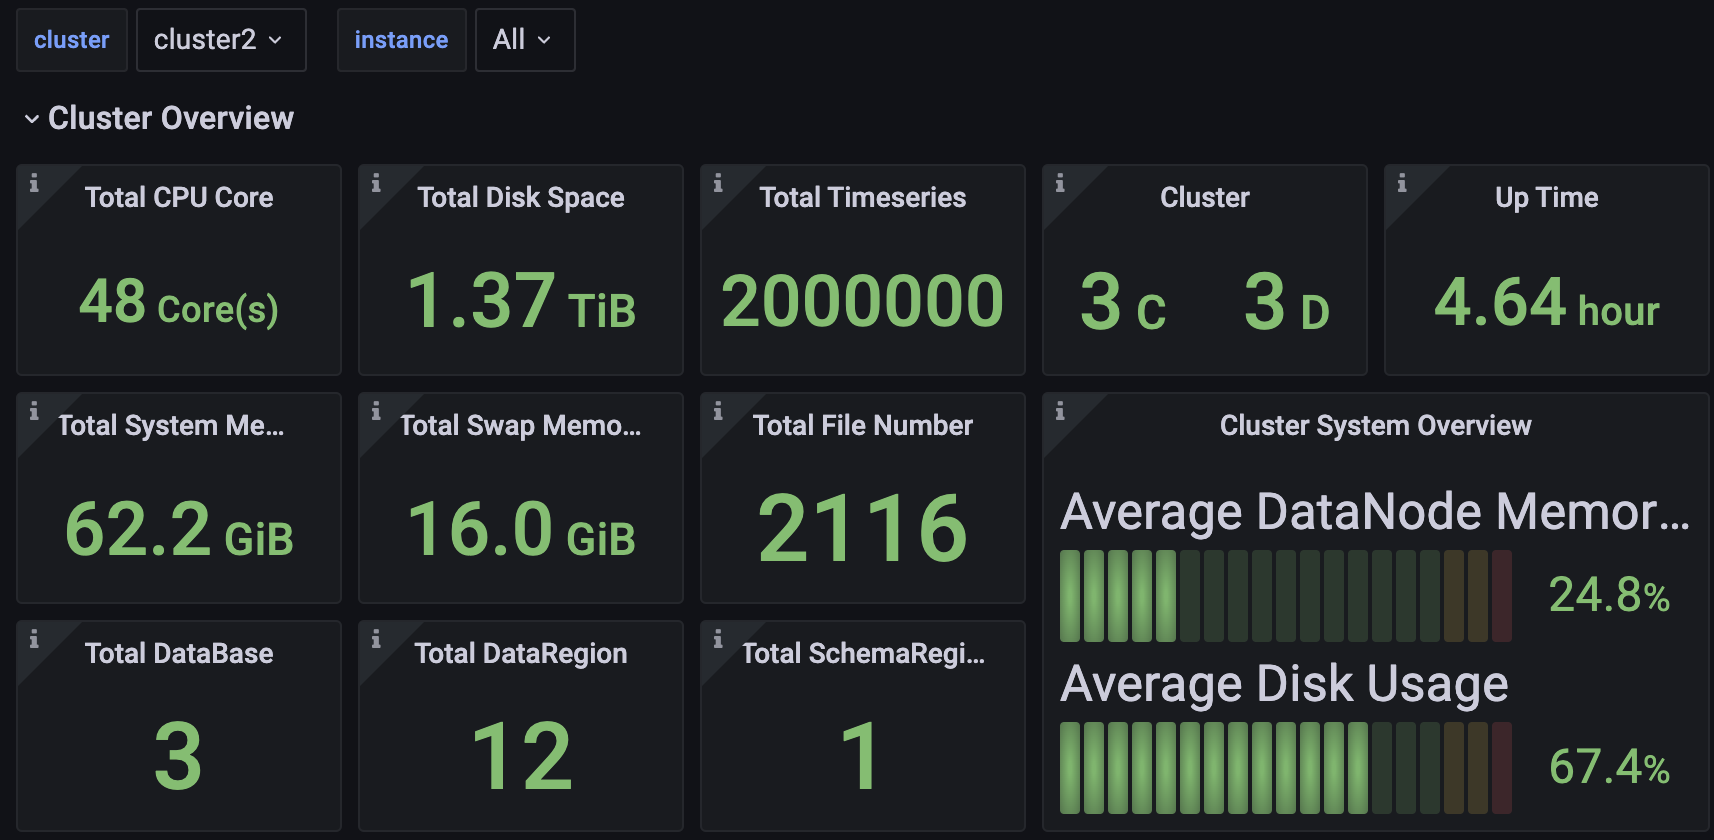
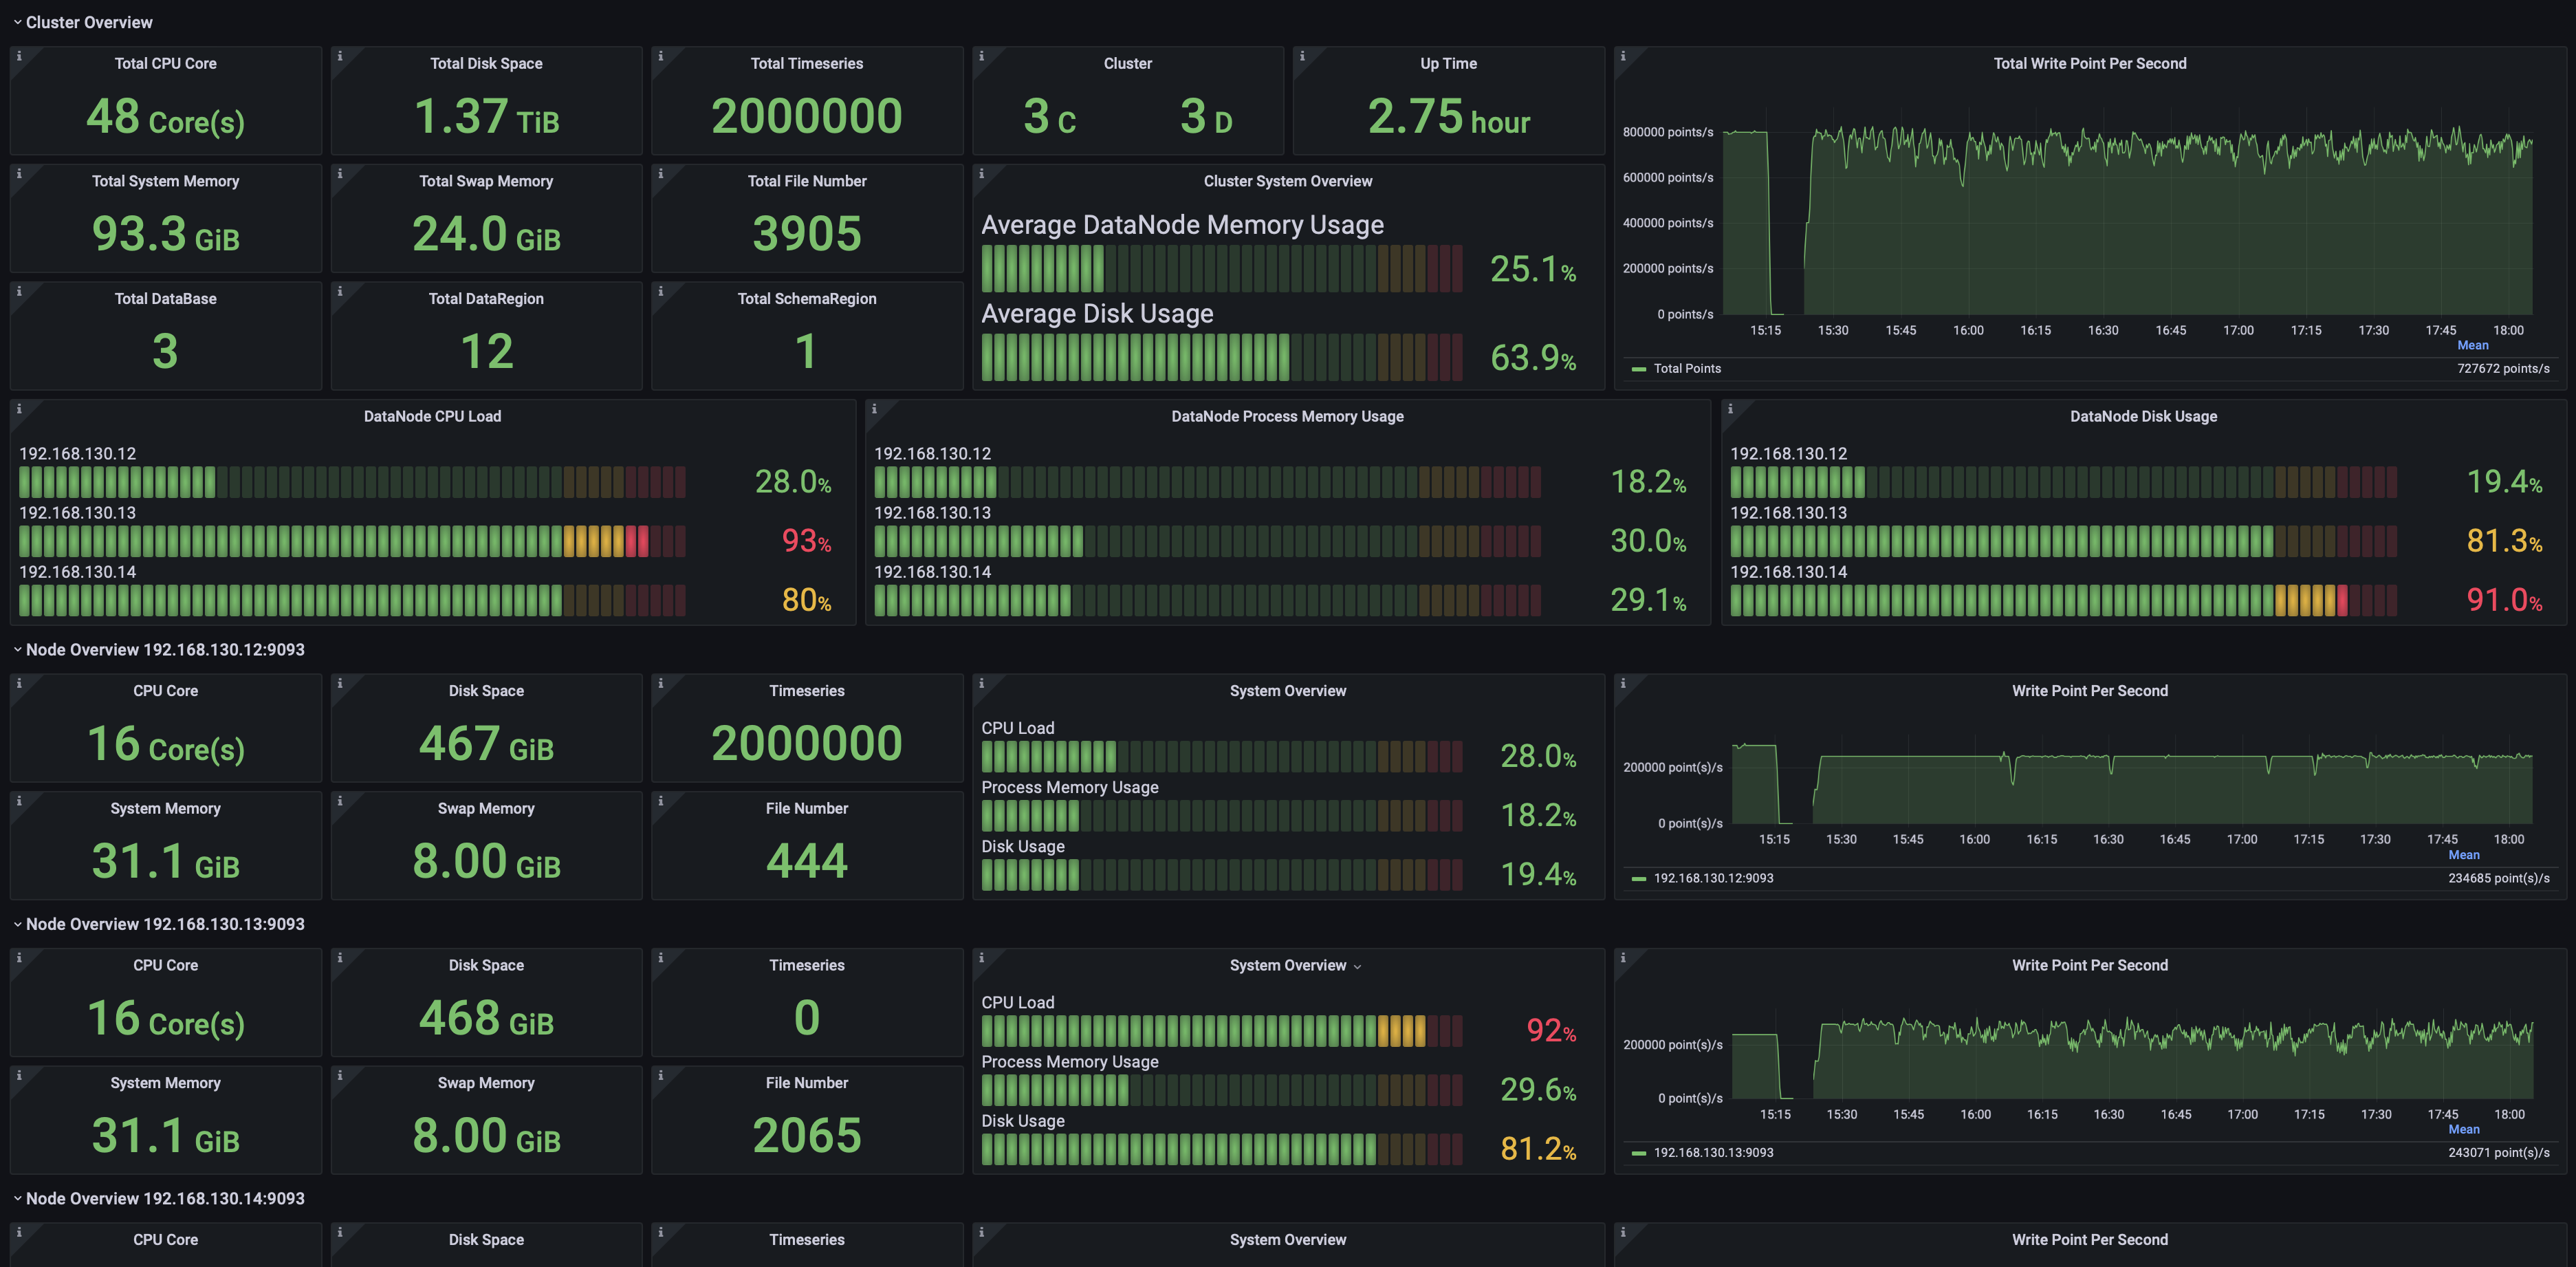
Cluster Overview
Including but not limited to:
- Total cluster CPU cores, memory space, and hard disk space.
- Number of ConfigNodes and DataNodes in the cluster.
- Cluster uptime duration.
- Cluster write speed.
- Current CPU, memory, and disk usage across all nodes in the cluster.
- Information on individual nodes.
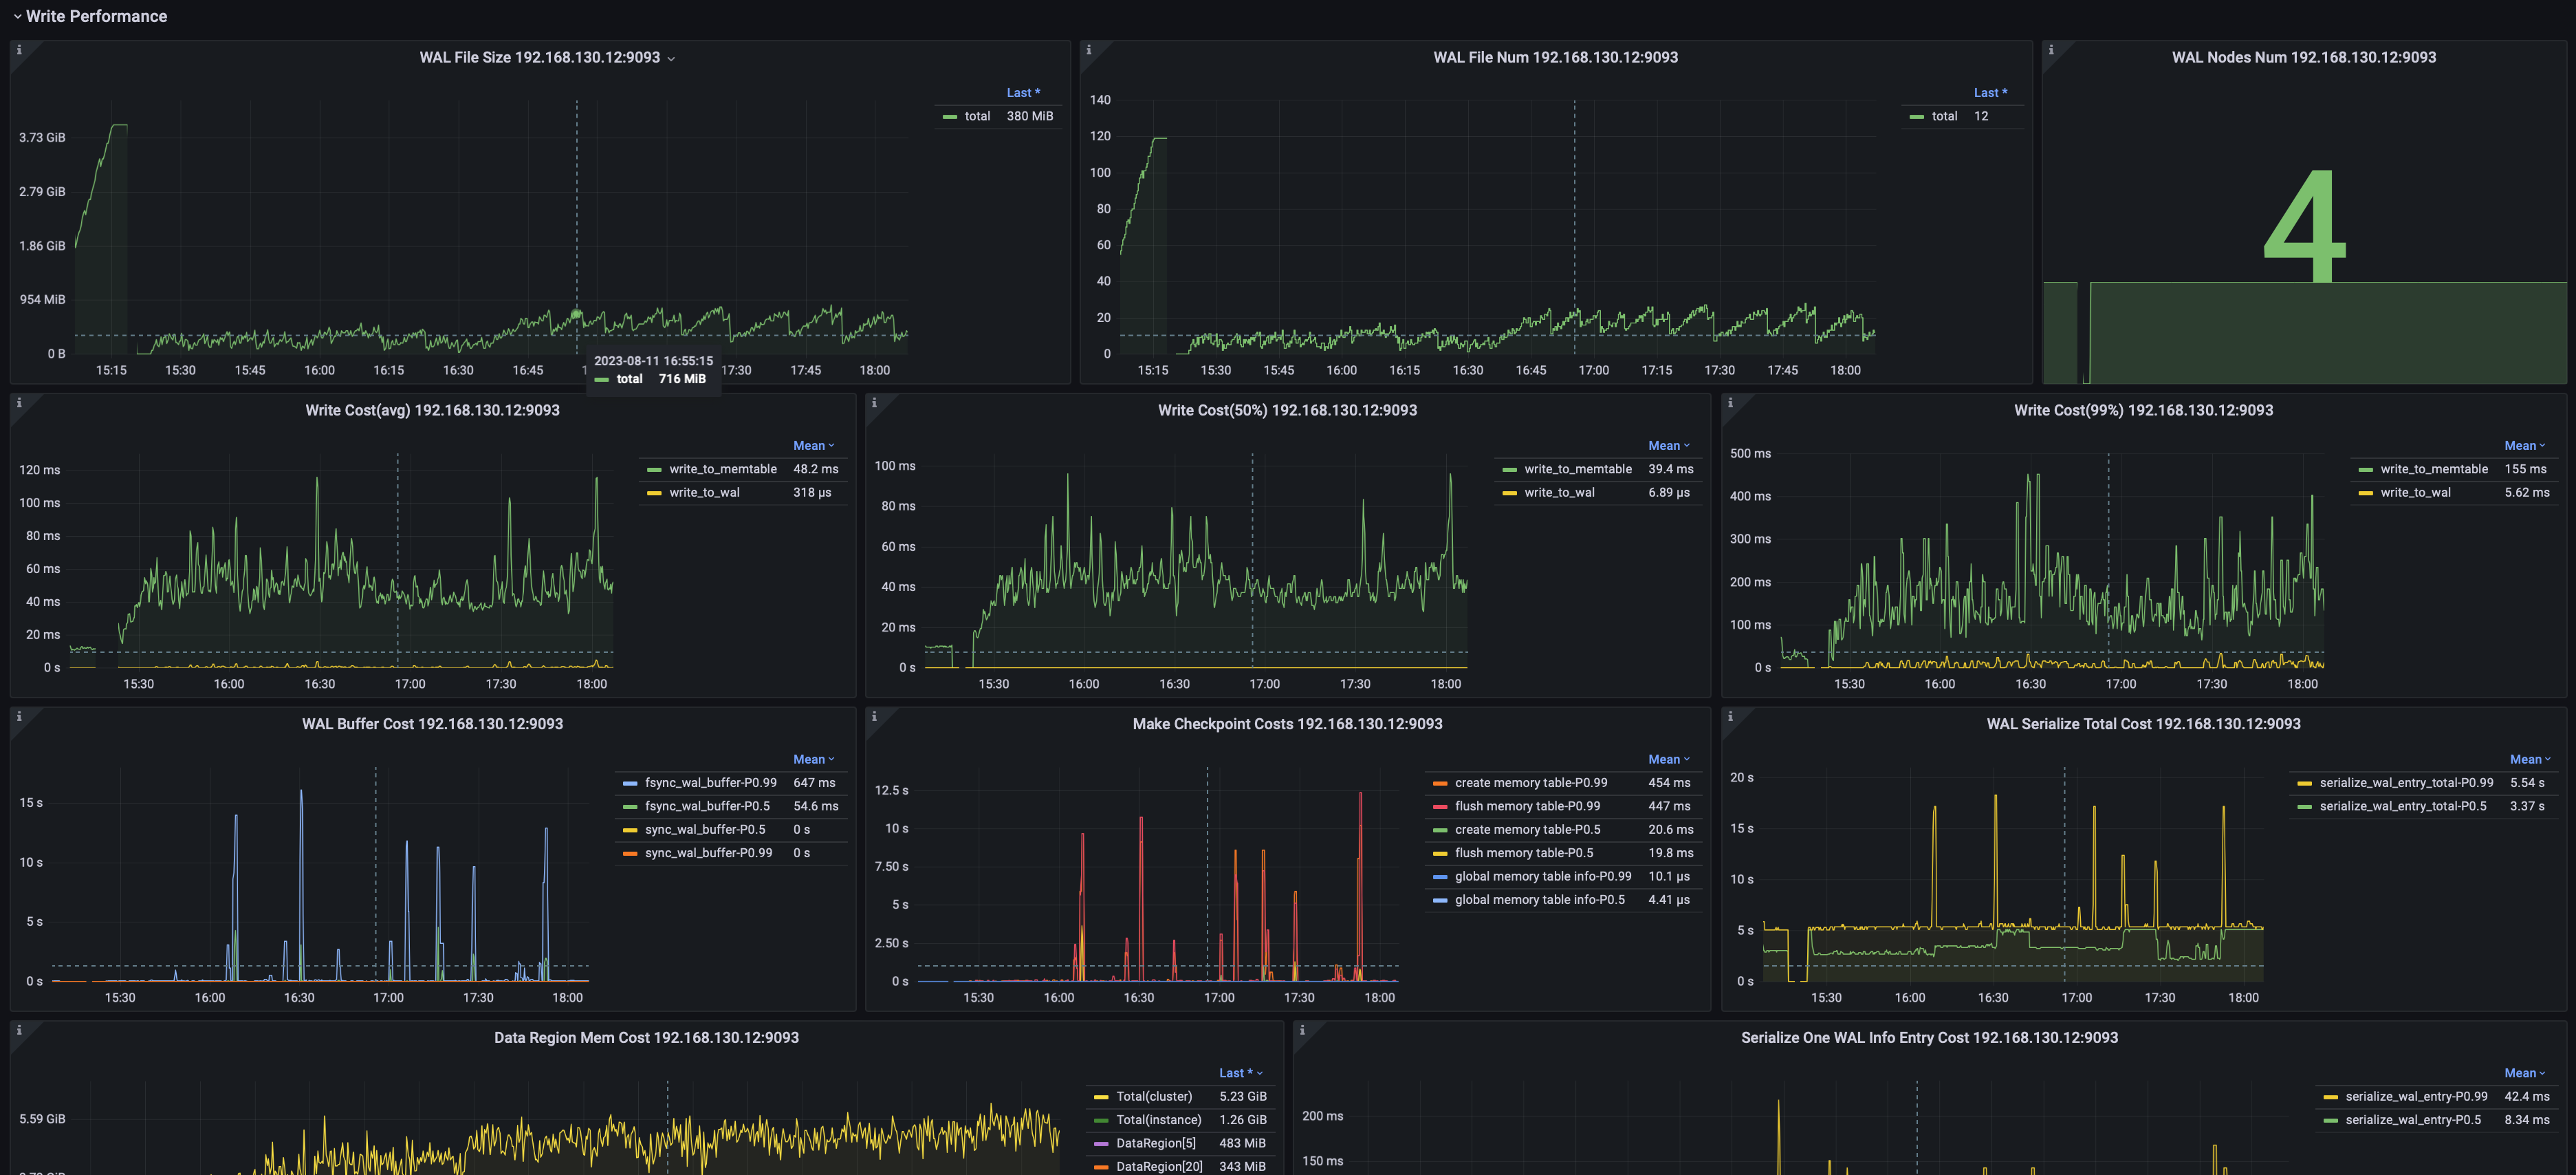
Data Writing
Including but not limited to:
- Average write latency, median latency, and the 99% percentile latency.
- Number and size of WAL files.
- Node WAL flush SyncBuffer latency.
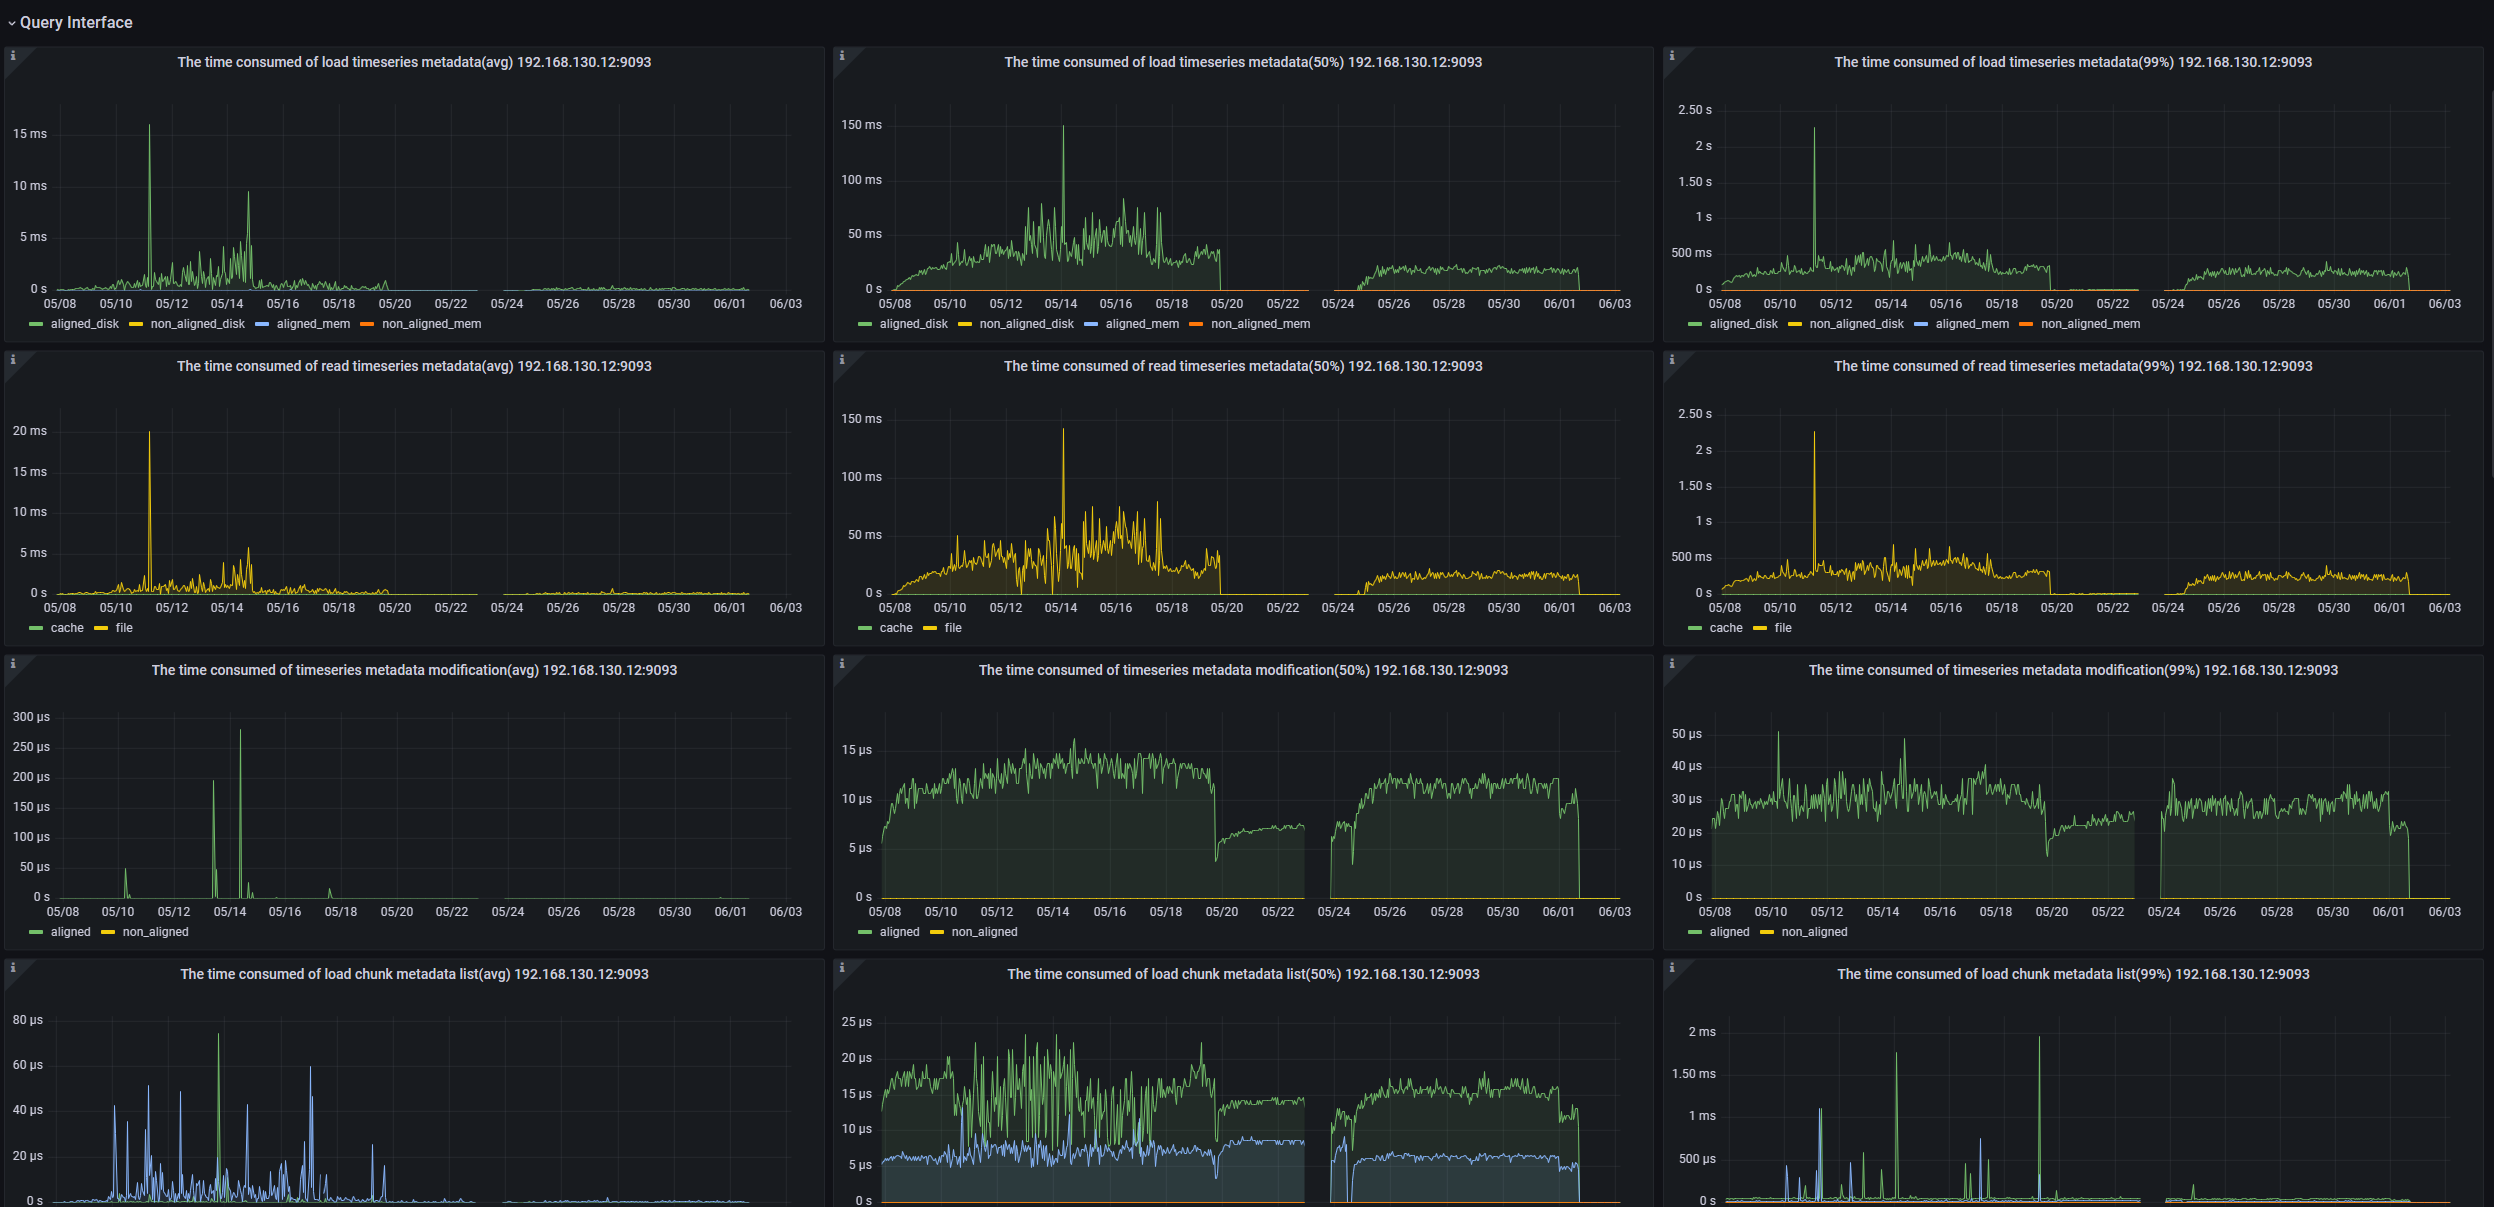
Data Querying
Including but not limited to:
- Node query load times for time series metadata.
- Node read duration for time series.
- Node edit duration for time series metadata.
- Node query load time for Chunk metadata list.
- Node edit duration for Chunk metadata.
- Node filtering duration based on Chunk metadata.
- Average time to construct a Chunk Reader.
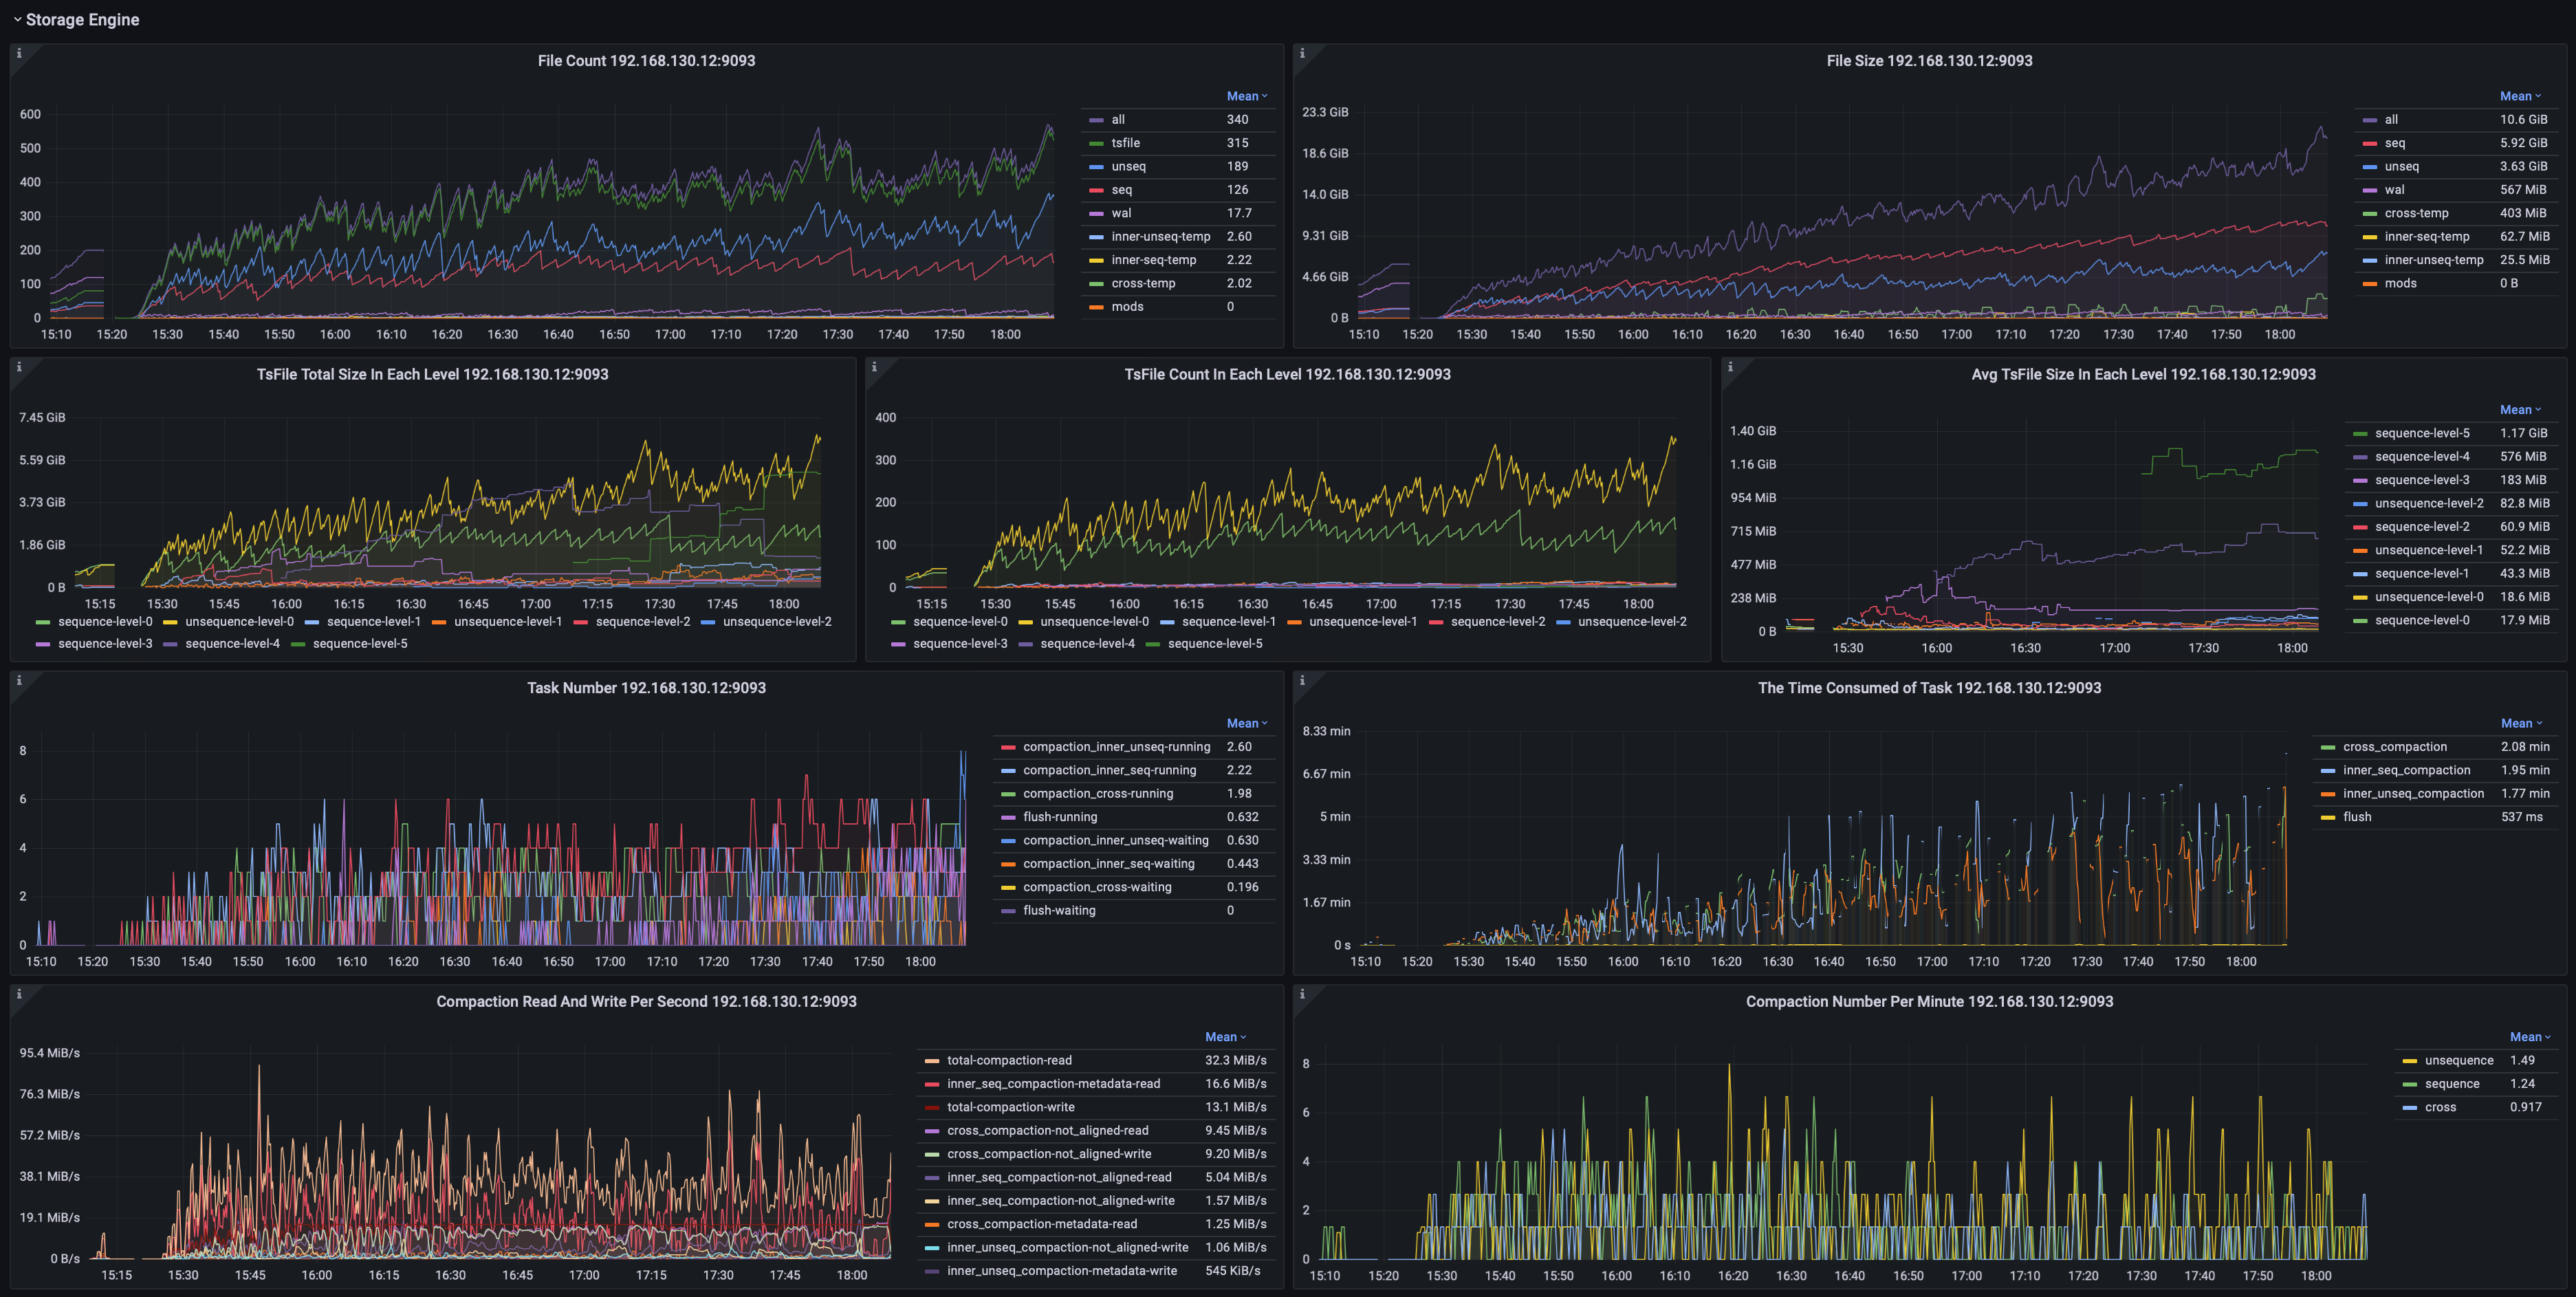
Storage Engine
Including but not limited to:
- File count and sizes by type.
- The count and size of TsFiles at various stages.
- Number and duration of various tasks.
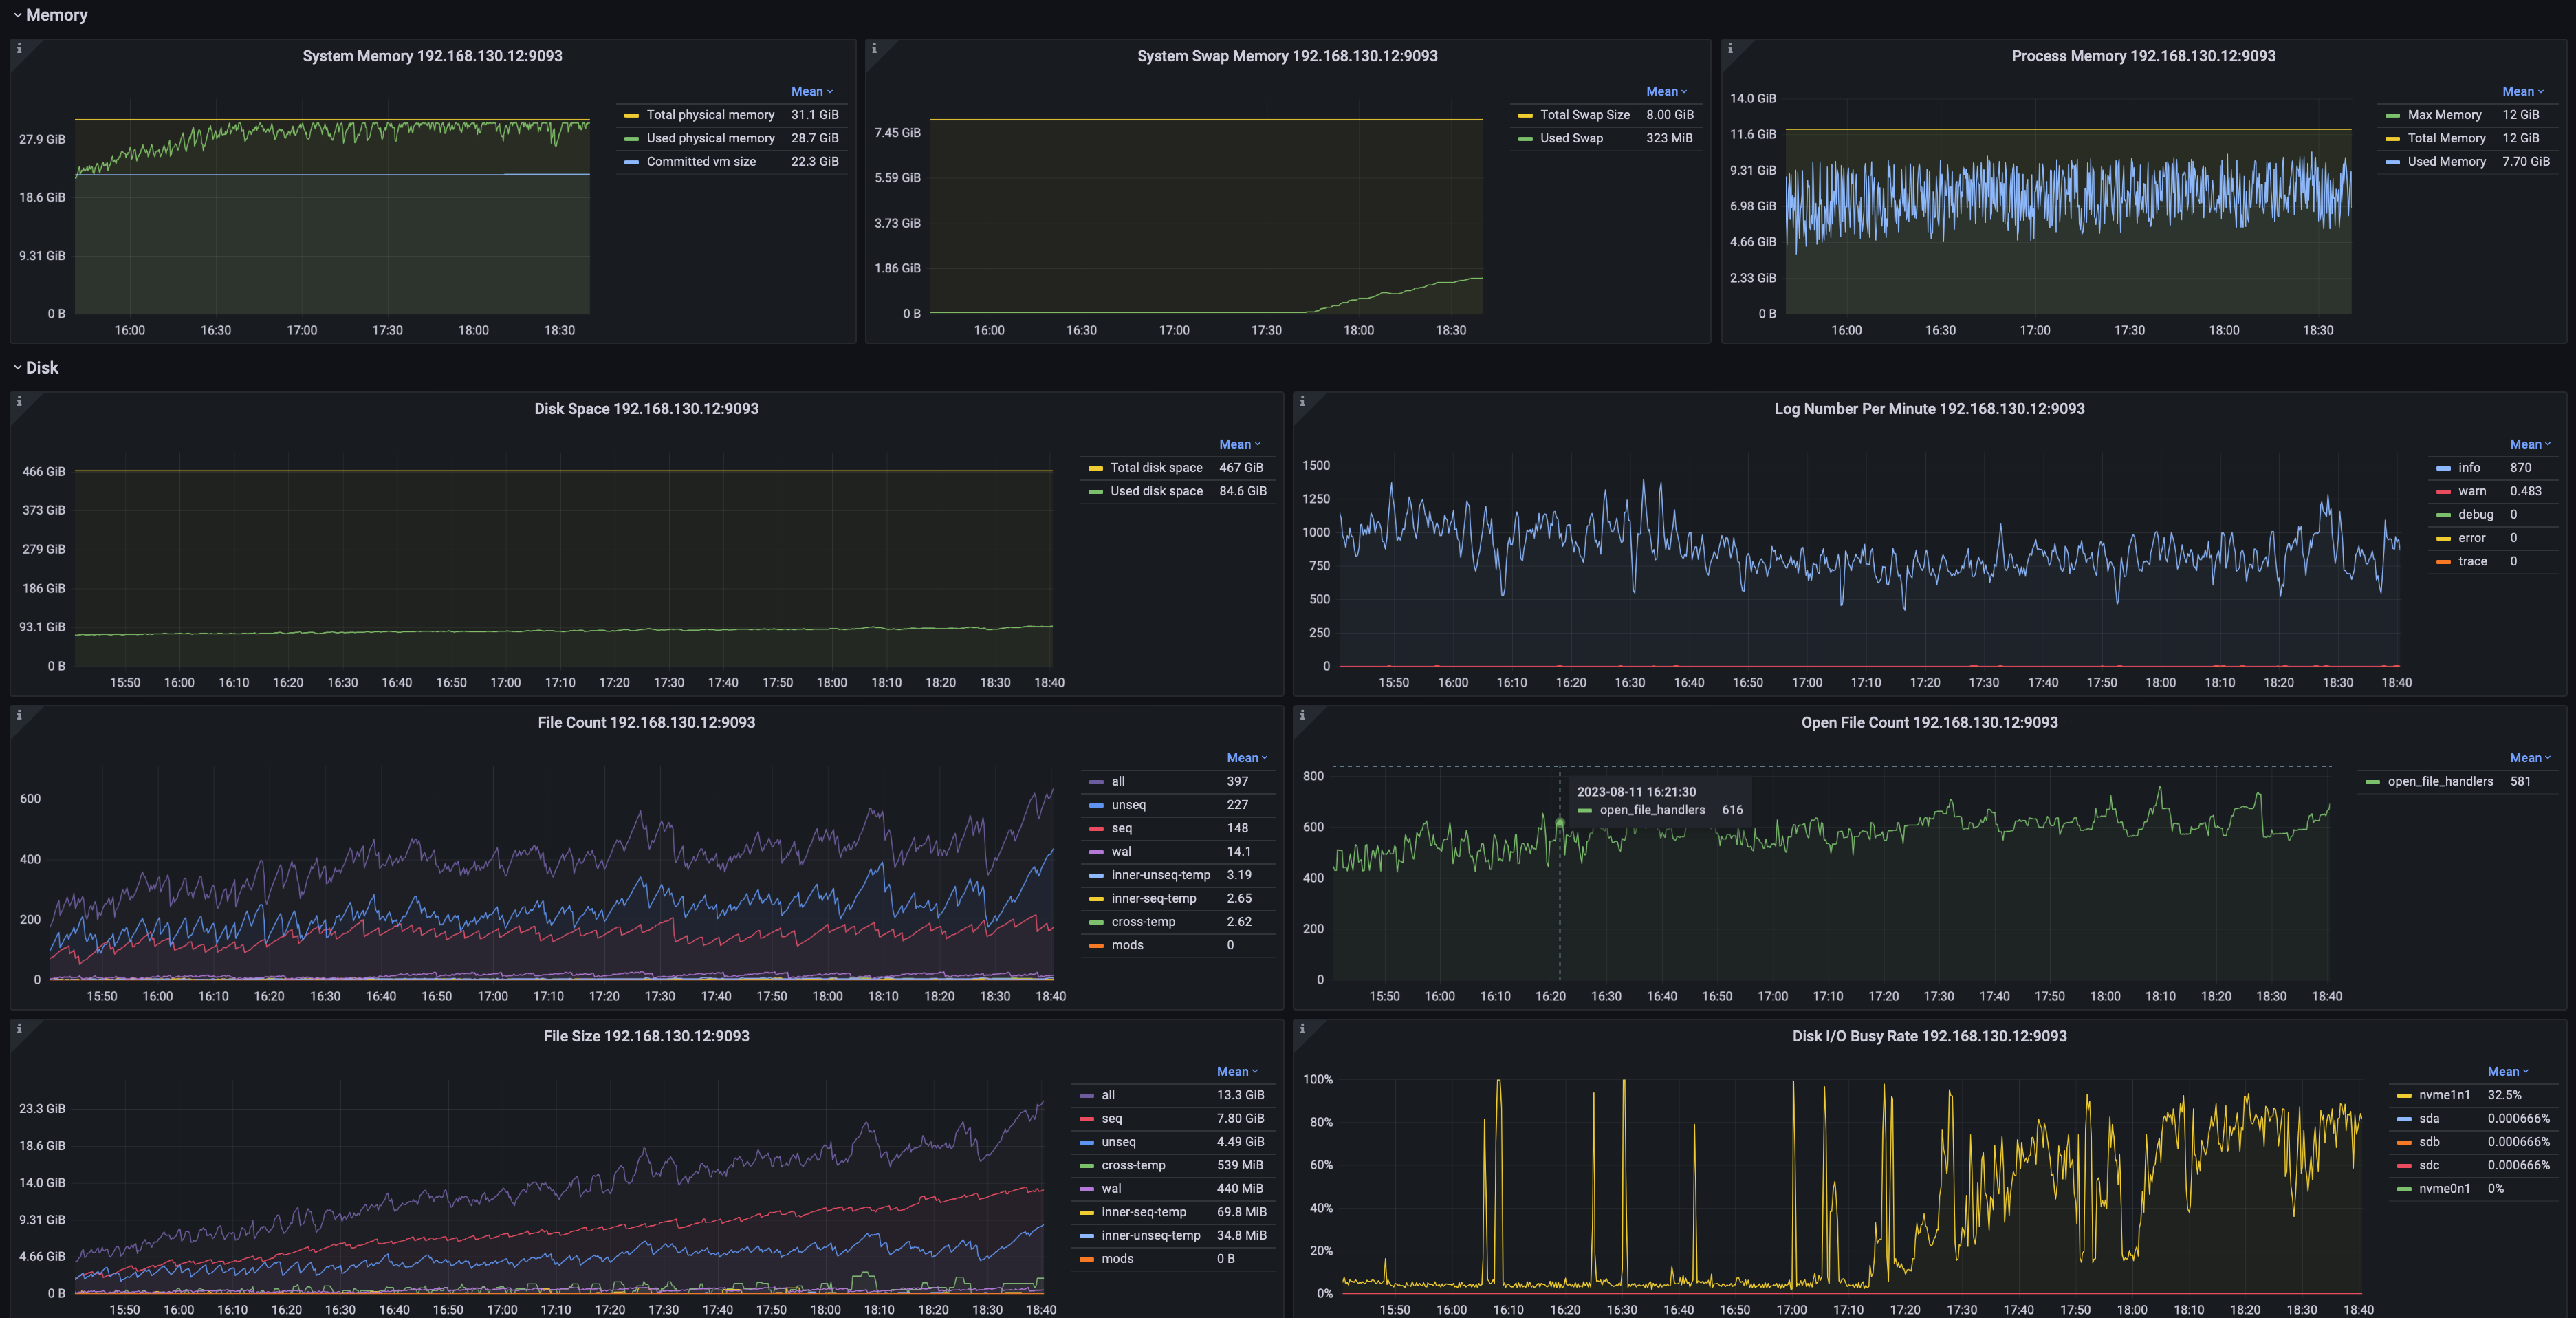
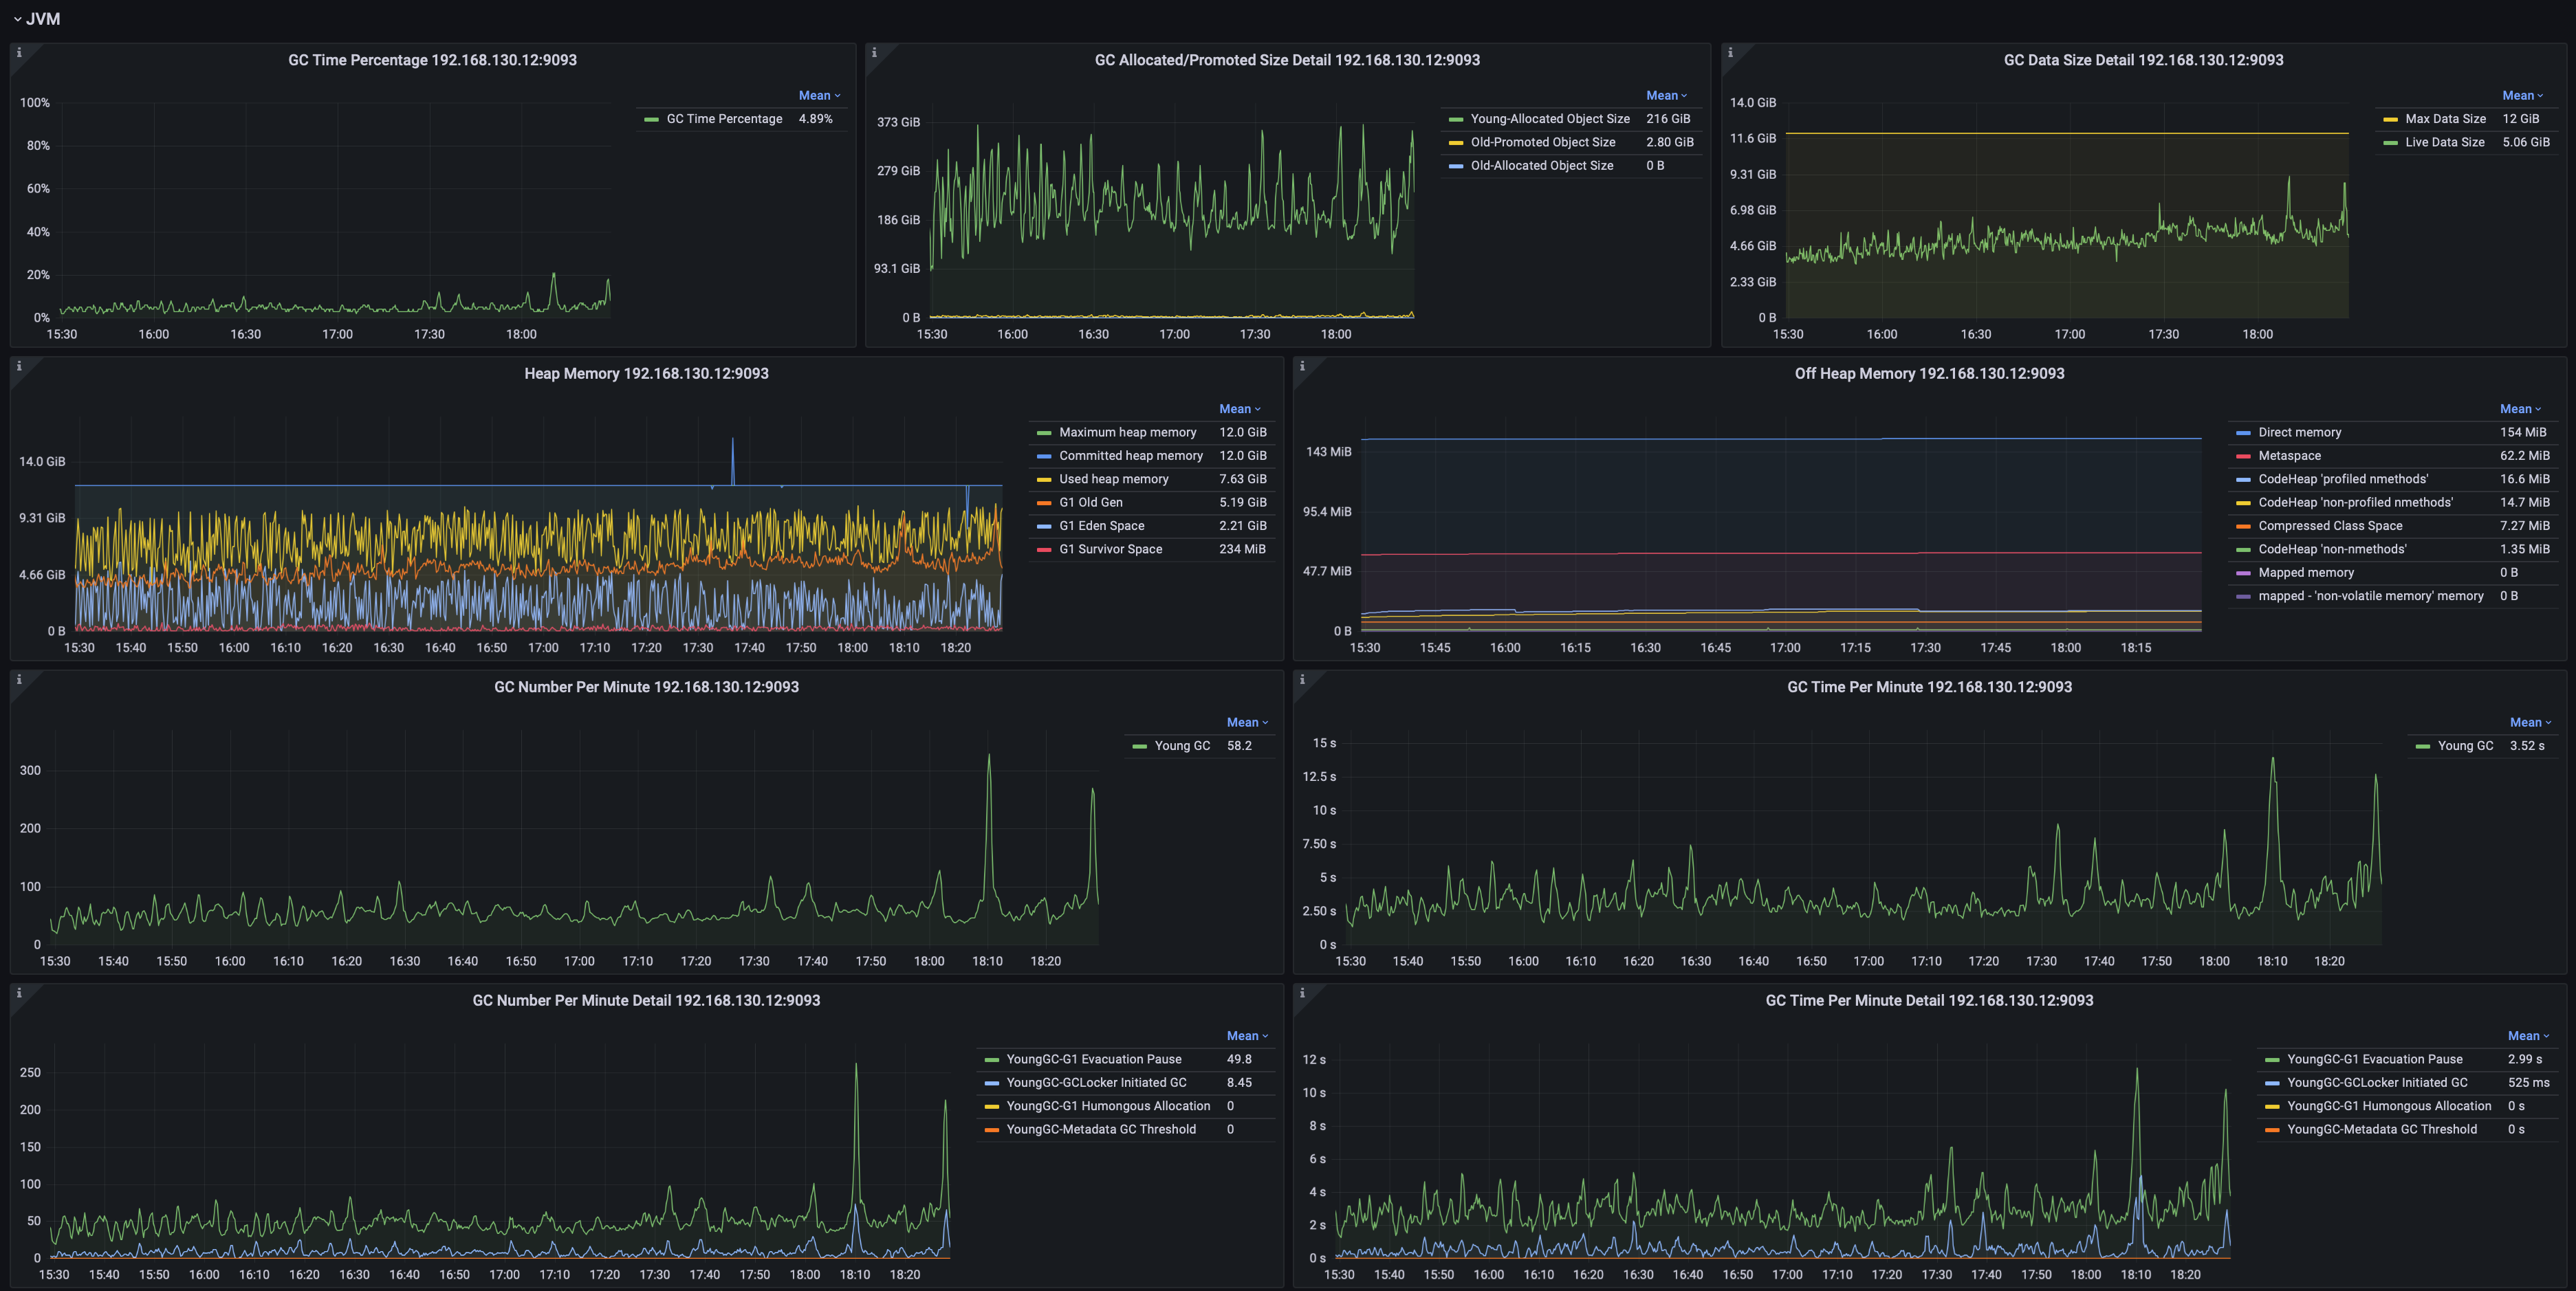
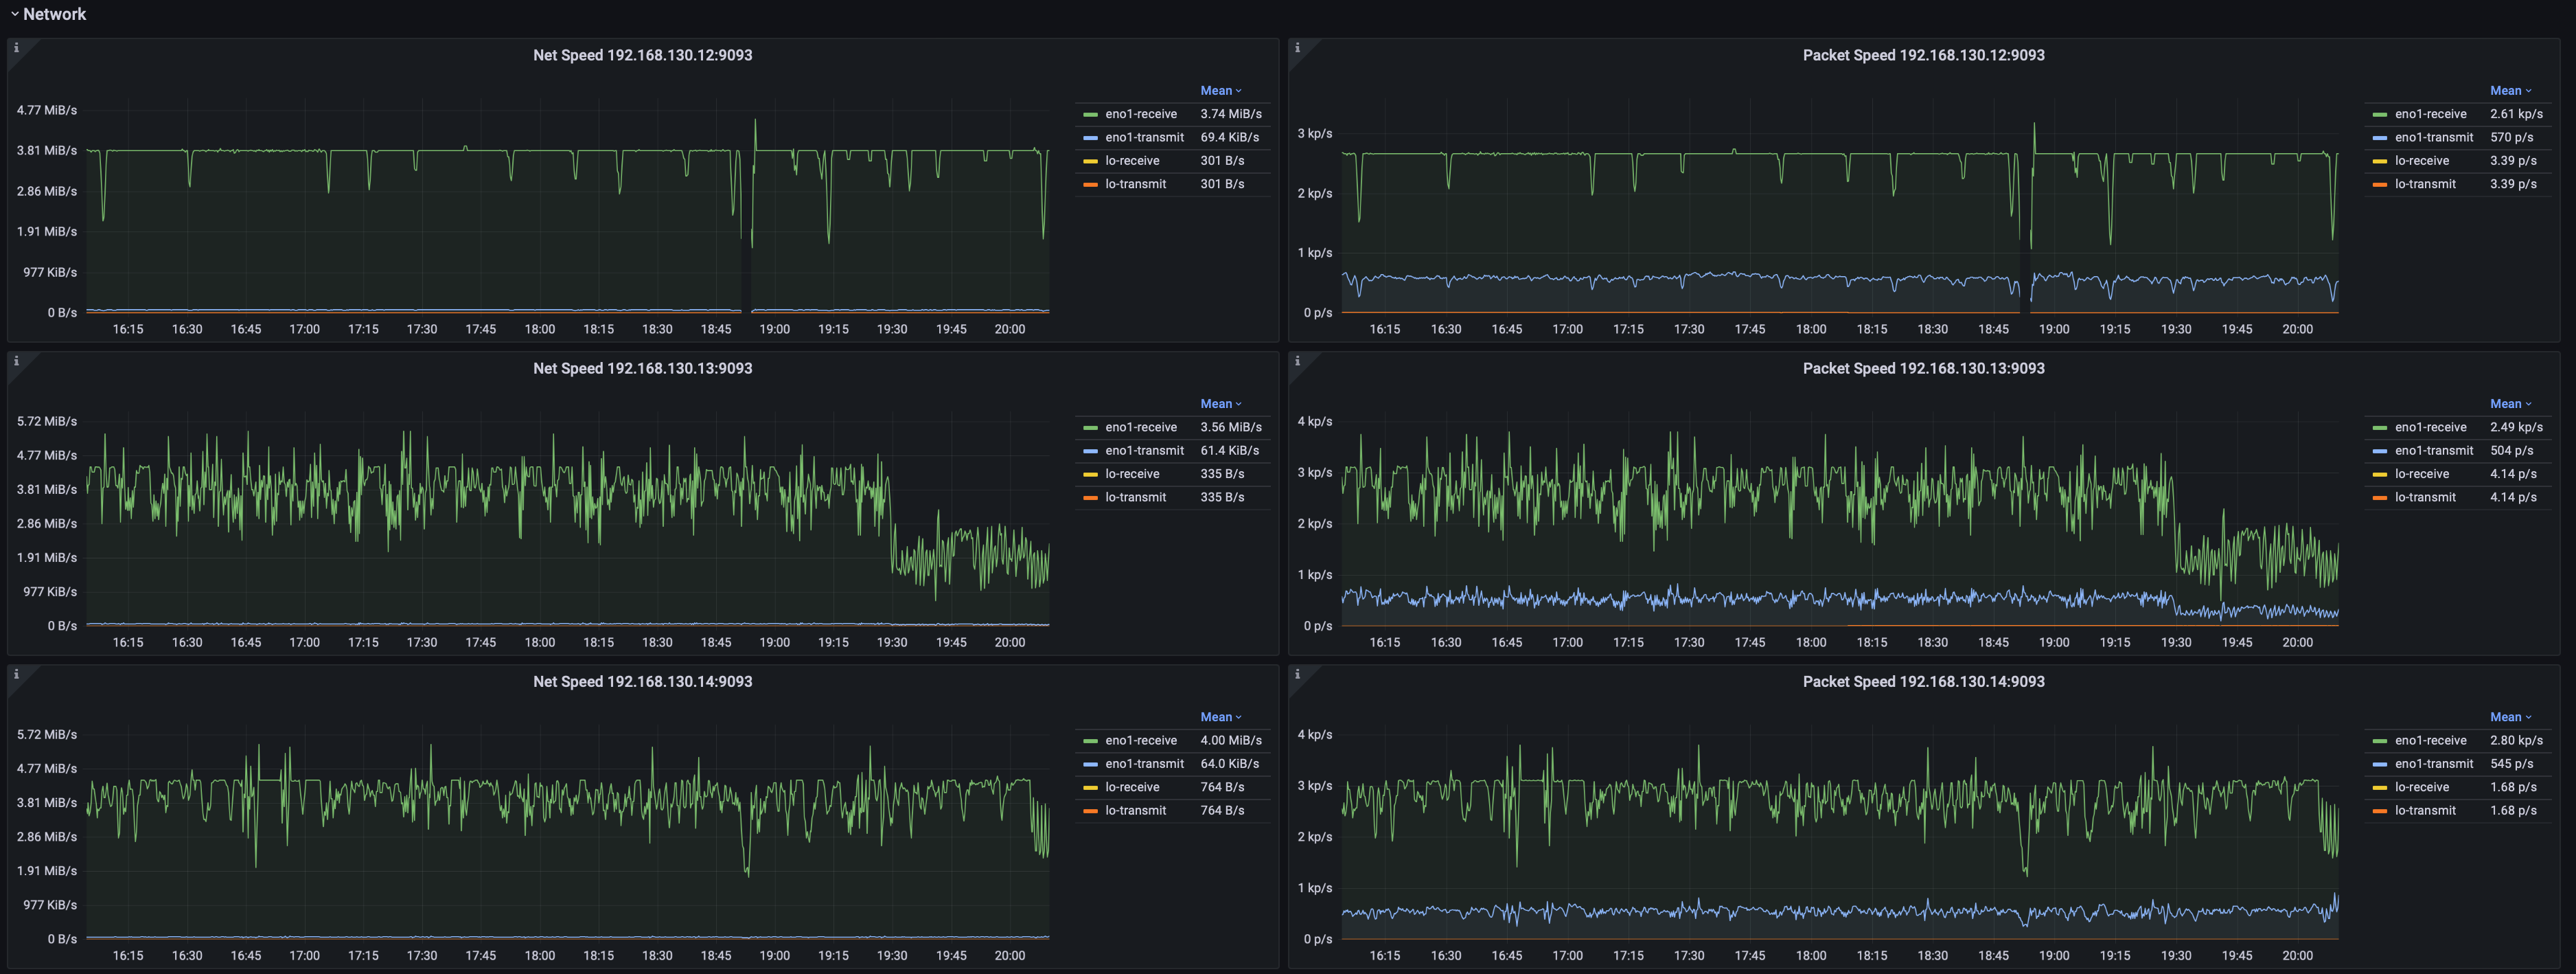
System Monitoring
Including but not limited to:
- System memory, swap memory, and process memory.
- Disk space, file count, and file sizes.
- JVM GC time percentage, GC occurrences by type, GC volume, and heap memory usage across generations.
- Network transmission rate, packet sending rate