title: Use weex-toolkit type: tools order: 5.1 version: 2.1
weex-toolkit
weex-toolkit is an official command line tool to help developers to create, debug and build their Weex project.
Install
$ npm install -g weex-toolkit
You can use the weex -v command to confirm that the installation is successful.
If you have never installed node.js, you should go node.js.org to download and install it. The node version needs to be upper 6.0. You can try n to manage your node versions.
If you meet some errors when installing, please go weex-toolkit issues or weex-toolkit faq to find some solution or have a discuss with us.
Commands
create
# create a new project with an official template
$ weex create my-project

# create a new project straight from a github template
$ weex create username/repo my-project
Create a new project with an official template or from other remote, also you can create your own weex template, more detail you can see How-to-create-your-own-template.
preview
weex-toolkit supports previewing your Weex file(.vue) in a watch mode. You only need specify your file path.
$ weex preview src/foo.vue
The browser automatically opens the preview page and you can see the layout and effects of your weex page. If you have a Playground App in your mobile devices, you can scan the QR code at the opened page.
Try the command below, you’ll preview the whole directory files.
$ weex preview src --entry src/foo.vue
You need to specify the folder path to preview and the entry file (passed in via --entry).
compile
Use weex compile o compile a single weex file or a weex file in an entire folder.
$ weex compile [source] [dist] [options]
options
| Option | Description |
|---|---|
-w, --watch | watch we file changes auto build them and refresh debugger page! [default true] |
-d,--devtool [devtool] | set webpack devtool mode |
-e,--ext [ext] | set enabled extname for compiler default is vue |
-m, --min | set jsbundle uglify or not. [default false] |
You can use like this:
$ weex compile src dest --devtool source-map -m
platform
Use weex platform [add|remove|update] [ios|android] to add, remove or update your ios / android project templates.
# add weex platform
$ weex platform add [ios|android]

# remove weex platform
$ weex platform remove [ios|android]

# update weex platform
$ weex platform update [ios|android]

# list weex platform
$ weex platform list
Use weex platform list to show what platforms your application supported.
run
You can use weex-toolkit to run project on android/ios/web.
# run weex Android project
$ weex run android

# run weex iOS project
$ weex run ios

# run weex web
$ weex run web
debug
** Weex devtools ** is a custom devtools for Weex that implements Chrome Debugging Protocol, it is designed to help you quickly inspect your app and debug your JS bundle source in a Chrome web page, both android and iOS platform are supported. So you can use weex-devtools feature by weex-toolkit.
usage
weex debug [we_file|bundles_dir] [options]
| Option | Description |
|---|---|
-V, --verbose | display logs of debugger server |
-v, --version | display version |
-p, --port [port] | set debugger server port |
-e, --entry [entry] | set the entry bundlejs path when you specific the bundle server root path |
-m, --mode [mode] | set build mode [transformer or loader] |
-w, --watch | watch we file changes auto build them and refresh debugger page [default true] |
--ip [ip] | set the host ip of debugger server |
--loglevel [loglevel] | set log level |
--min | set jsbundle uglify or not. [default false] |
--remotedebugport [remotedebugport] | set the remote debug port,default 9222 |
Features
Connect devices
$ weex debug
This command will start debug server and launch a chrome opening DeviceList page. this page will display a QR code, you can use Playground scan it for starting debug or integrate [Weex devtools](#Integrate devtool) into your application.

Debug with .vue file
$ weex debug your_weex.vue
Click the button you can use your app or weex playground app to preview your pages.
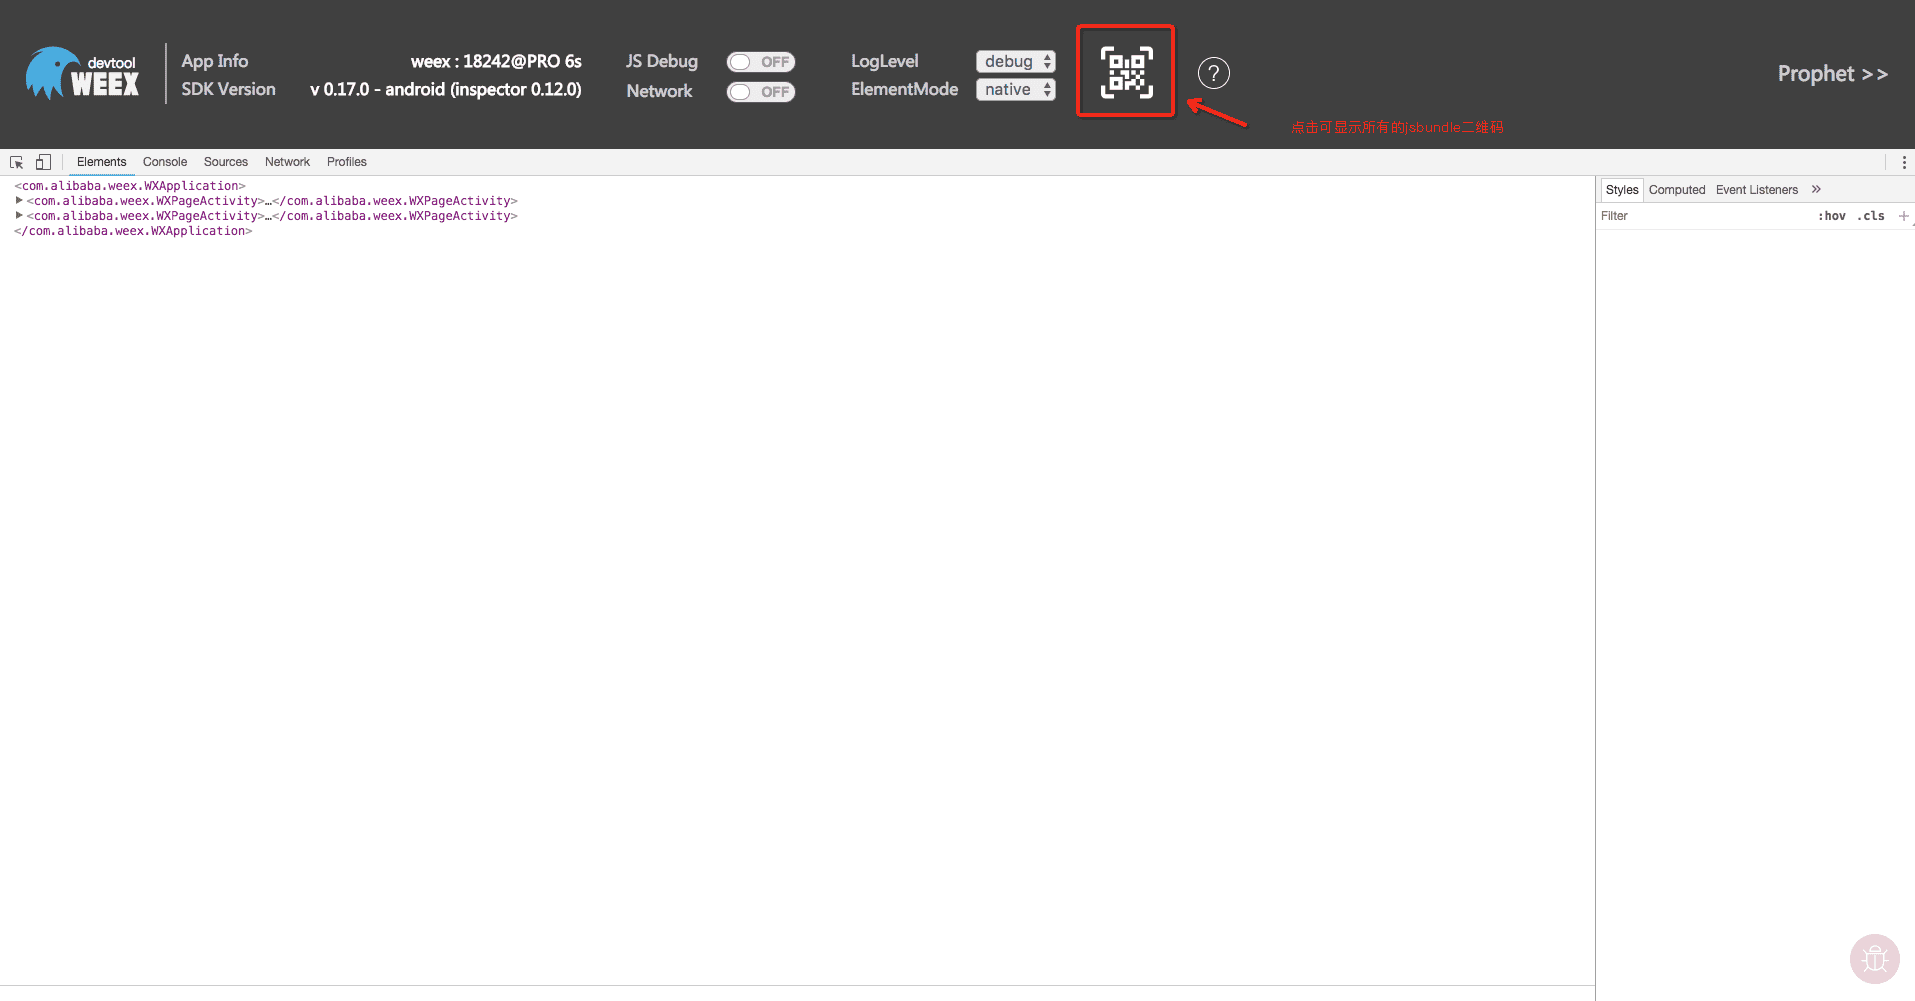
Inspector
Inspector feature to view the page's VDOM / Native Tree structure
Note: If you do not need this feature as far as possible to maintain the closed state, open the browser Inspector interface will increase the page communication, more affect performance.
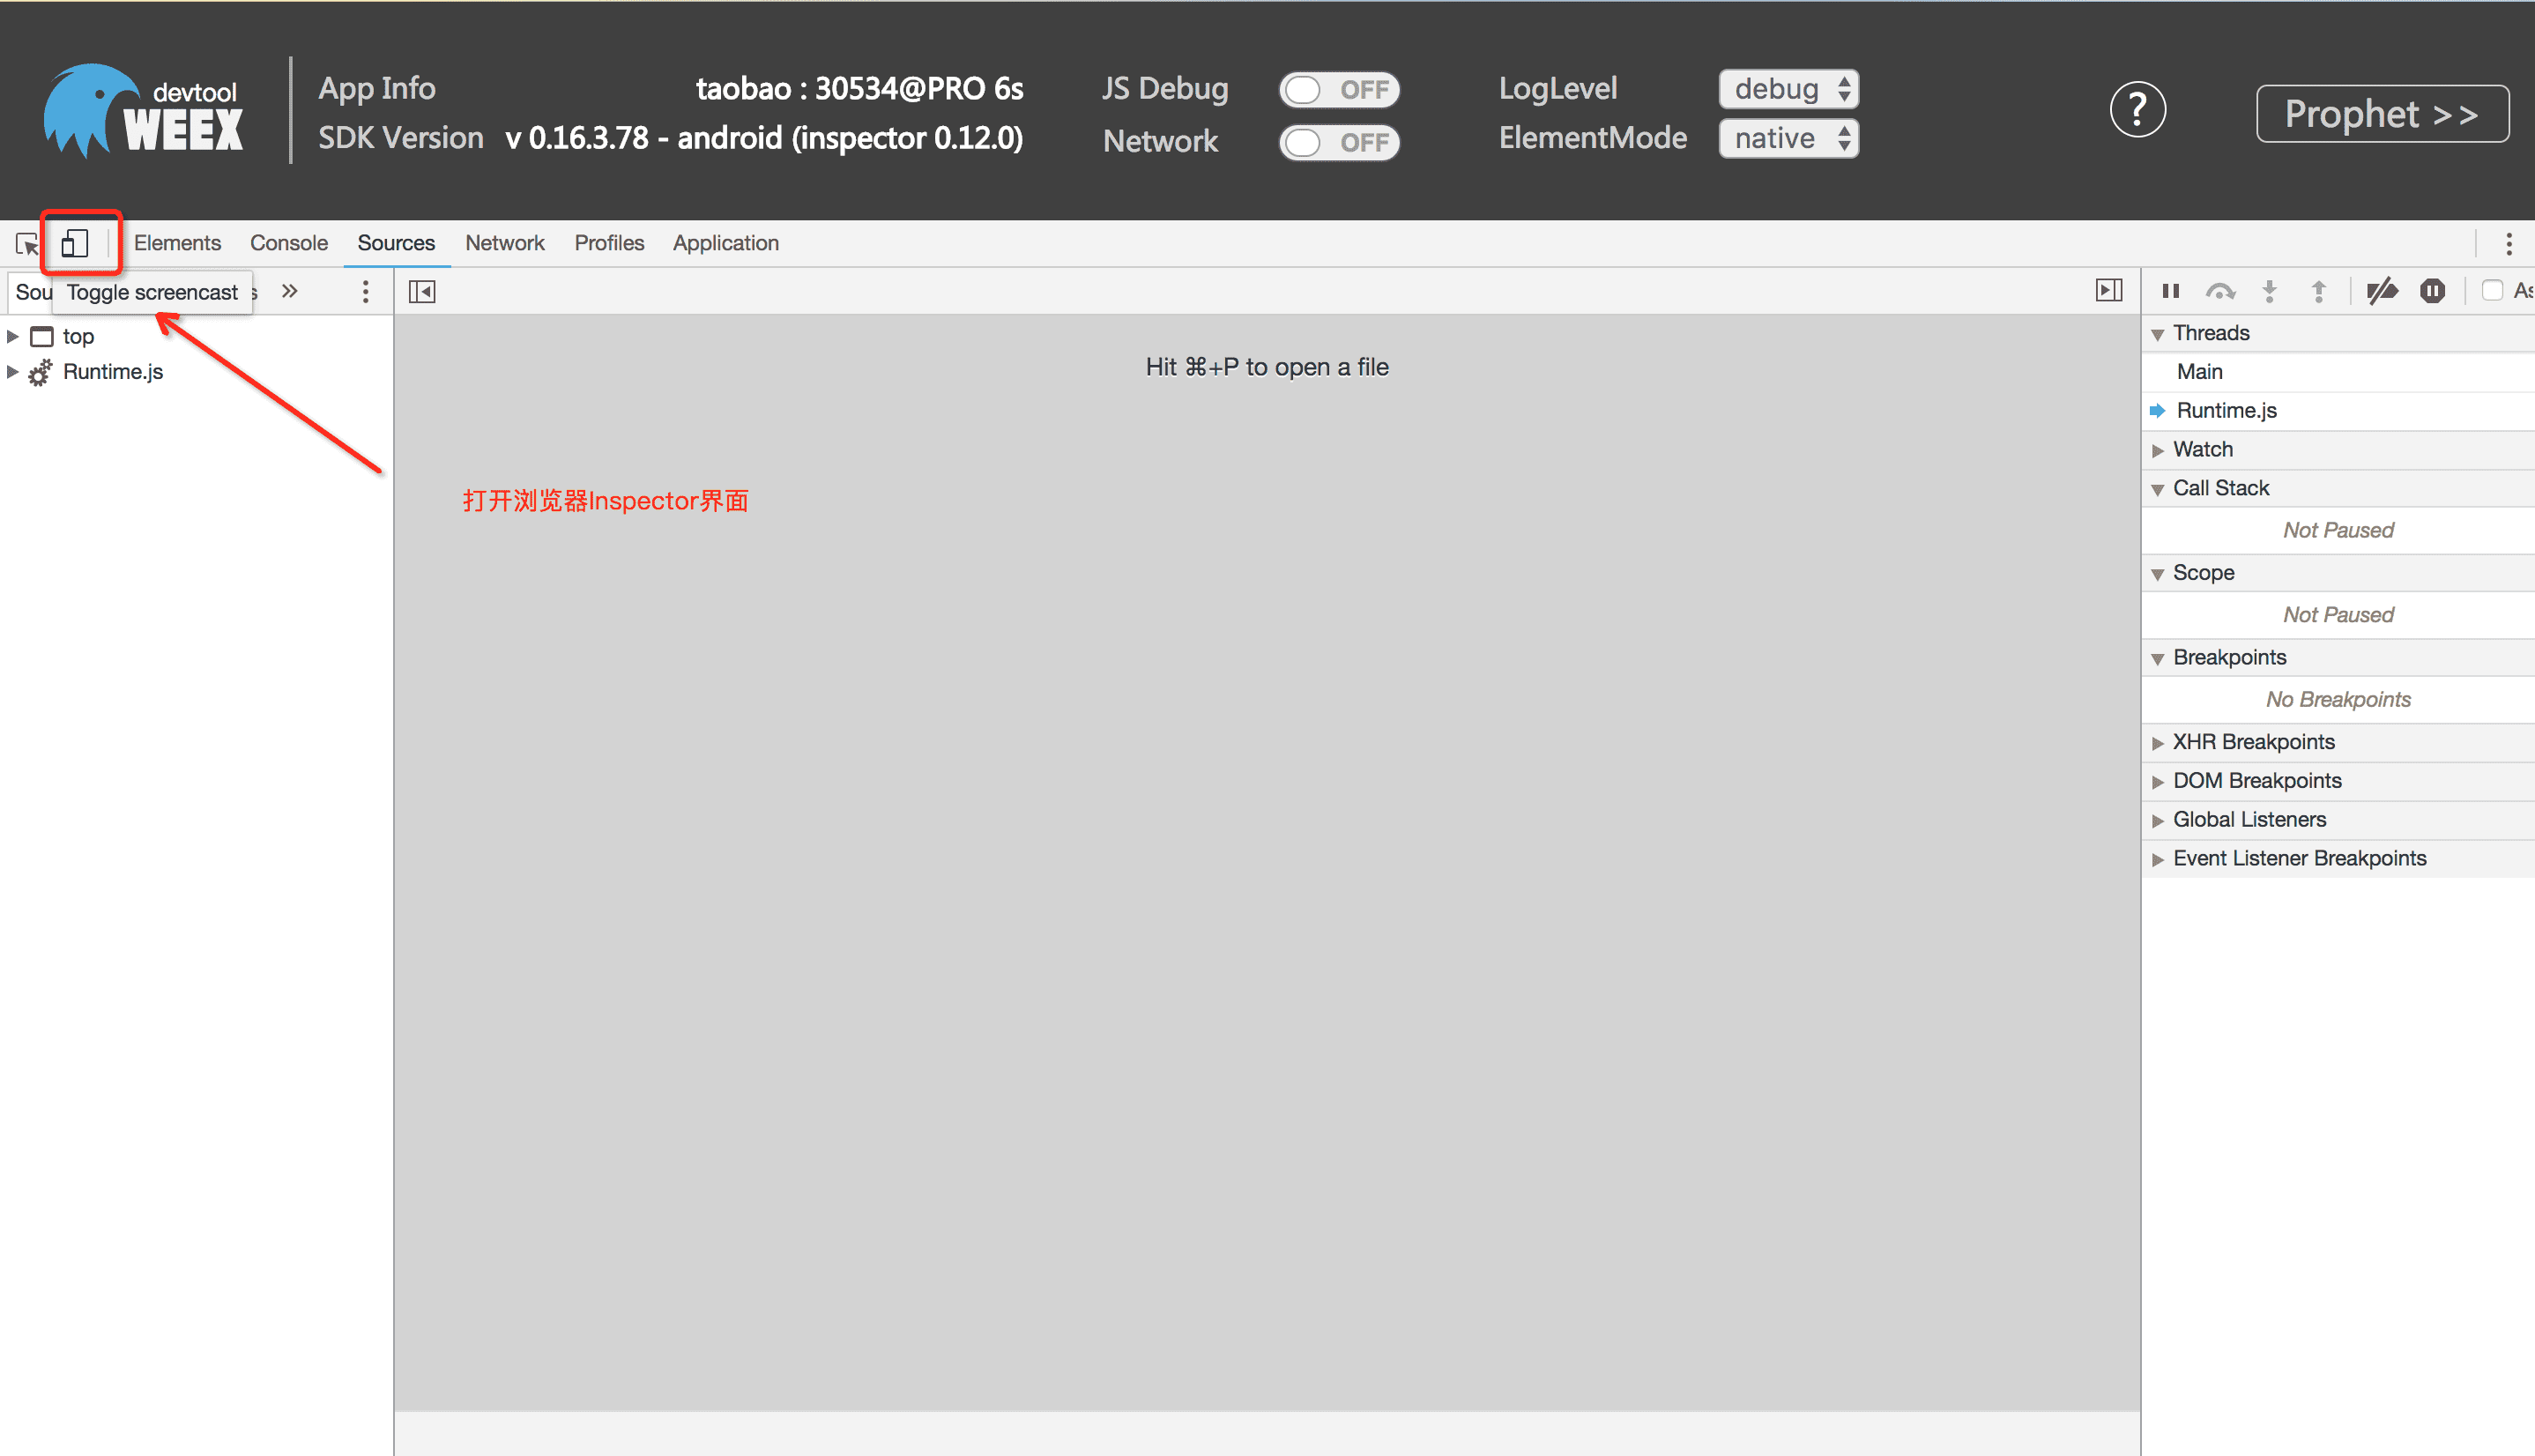

Breakpoint
JS Debug feature support you to set breakpoint on your jsbundle and debugging with it.
You can find your jsbundle in the source folder of the Runtime.js directory. If you do not see the Runtime.js directory, check if the weex-debugger tool is completely installed or try to restart the debug tool.

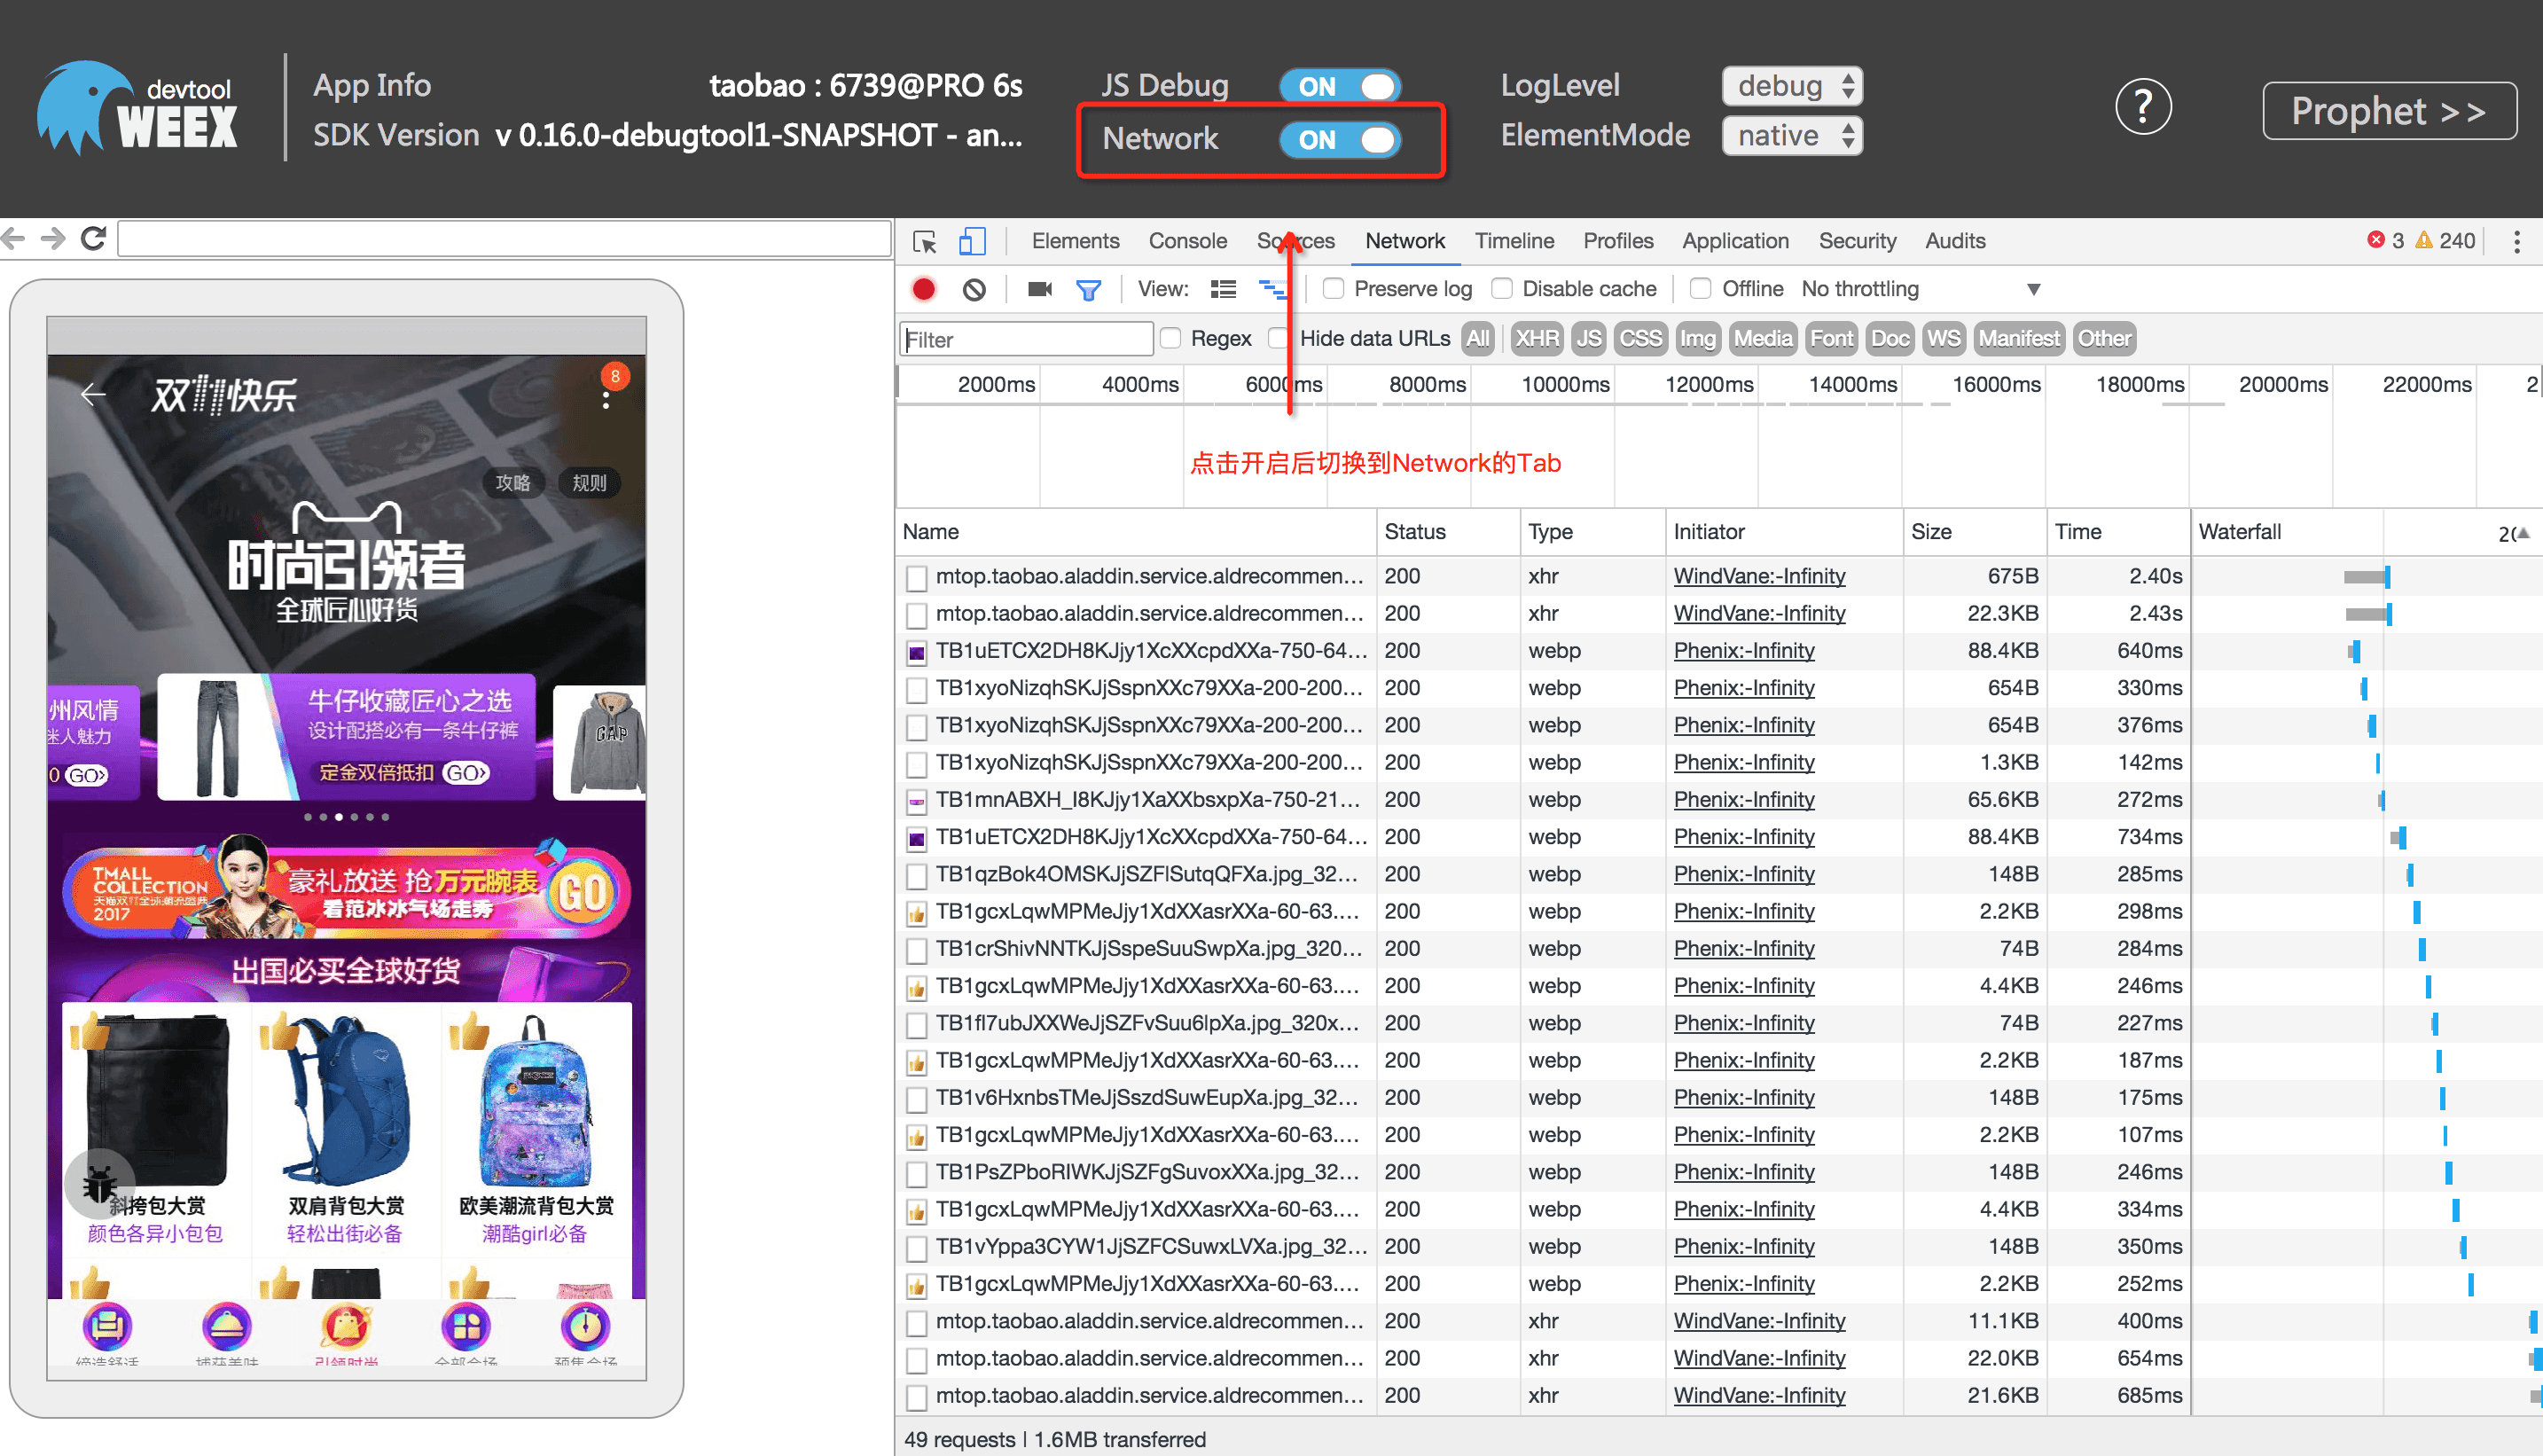
NetWork
The Network feature collects network request information from weex applications.
Loglevel & ElementMode
The LogLevel and ElementMode feature are used to adjust the output configuration of the debugger.

Prophet
The Prophet feature is used to view weex's load timing diagram and page performance metrics.
Click on the upper right corner of the Prophet to view the timing diagram (iOS is not supported, the performance data can be viewed in the log performance), as follows: 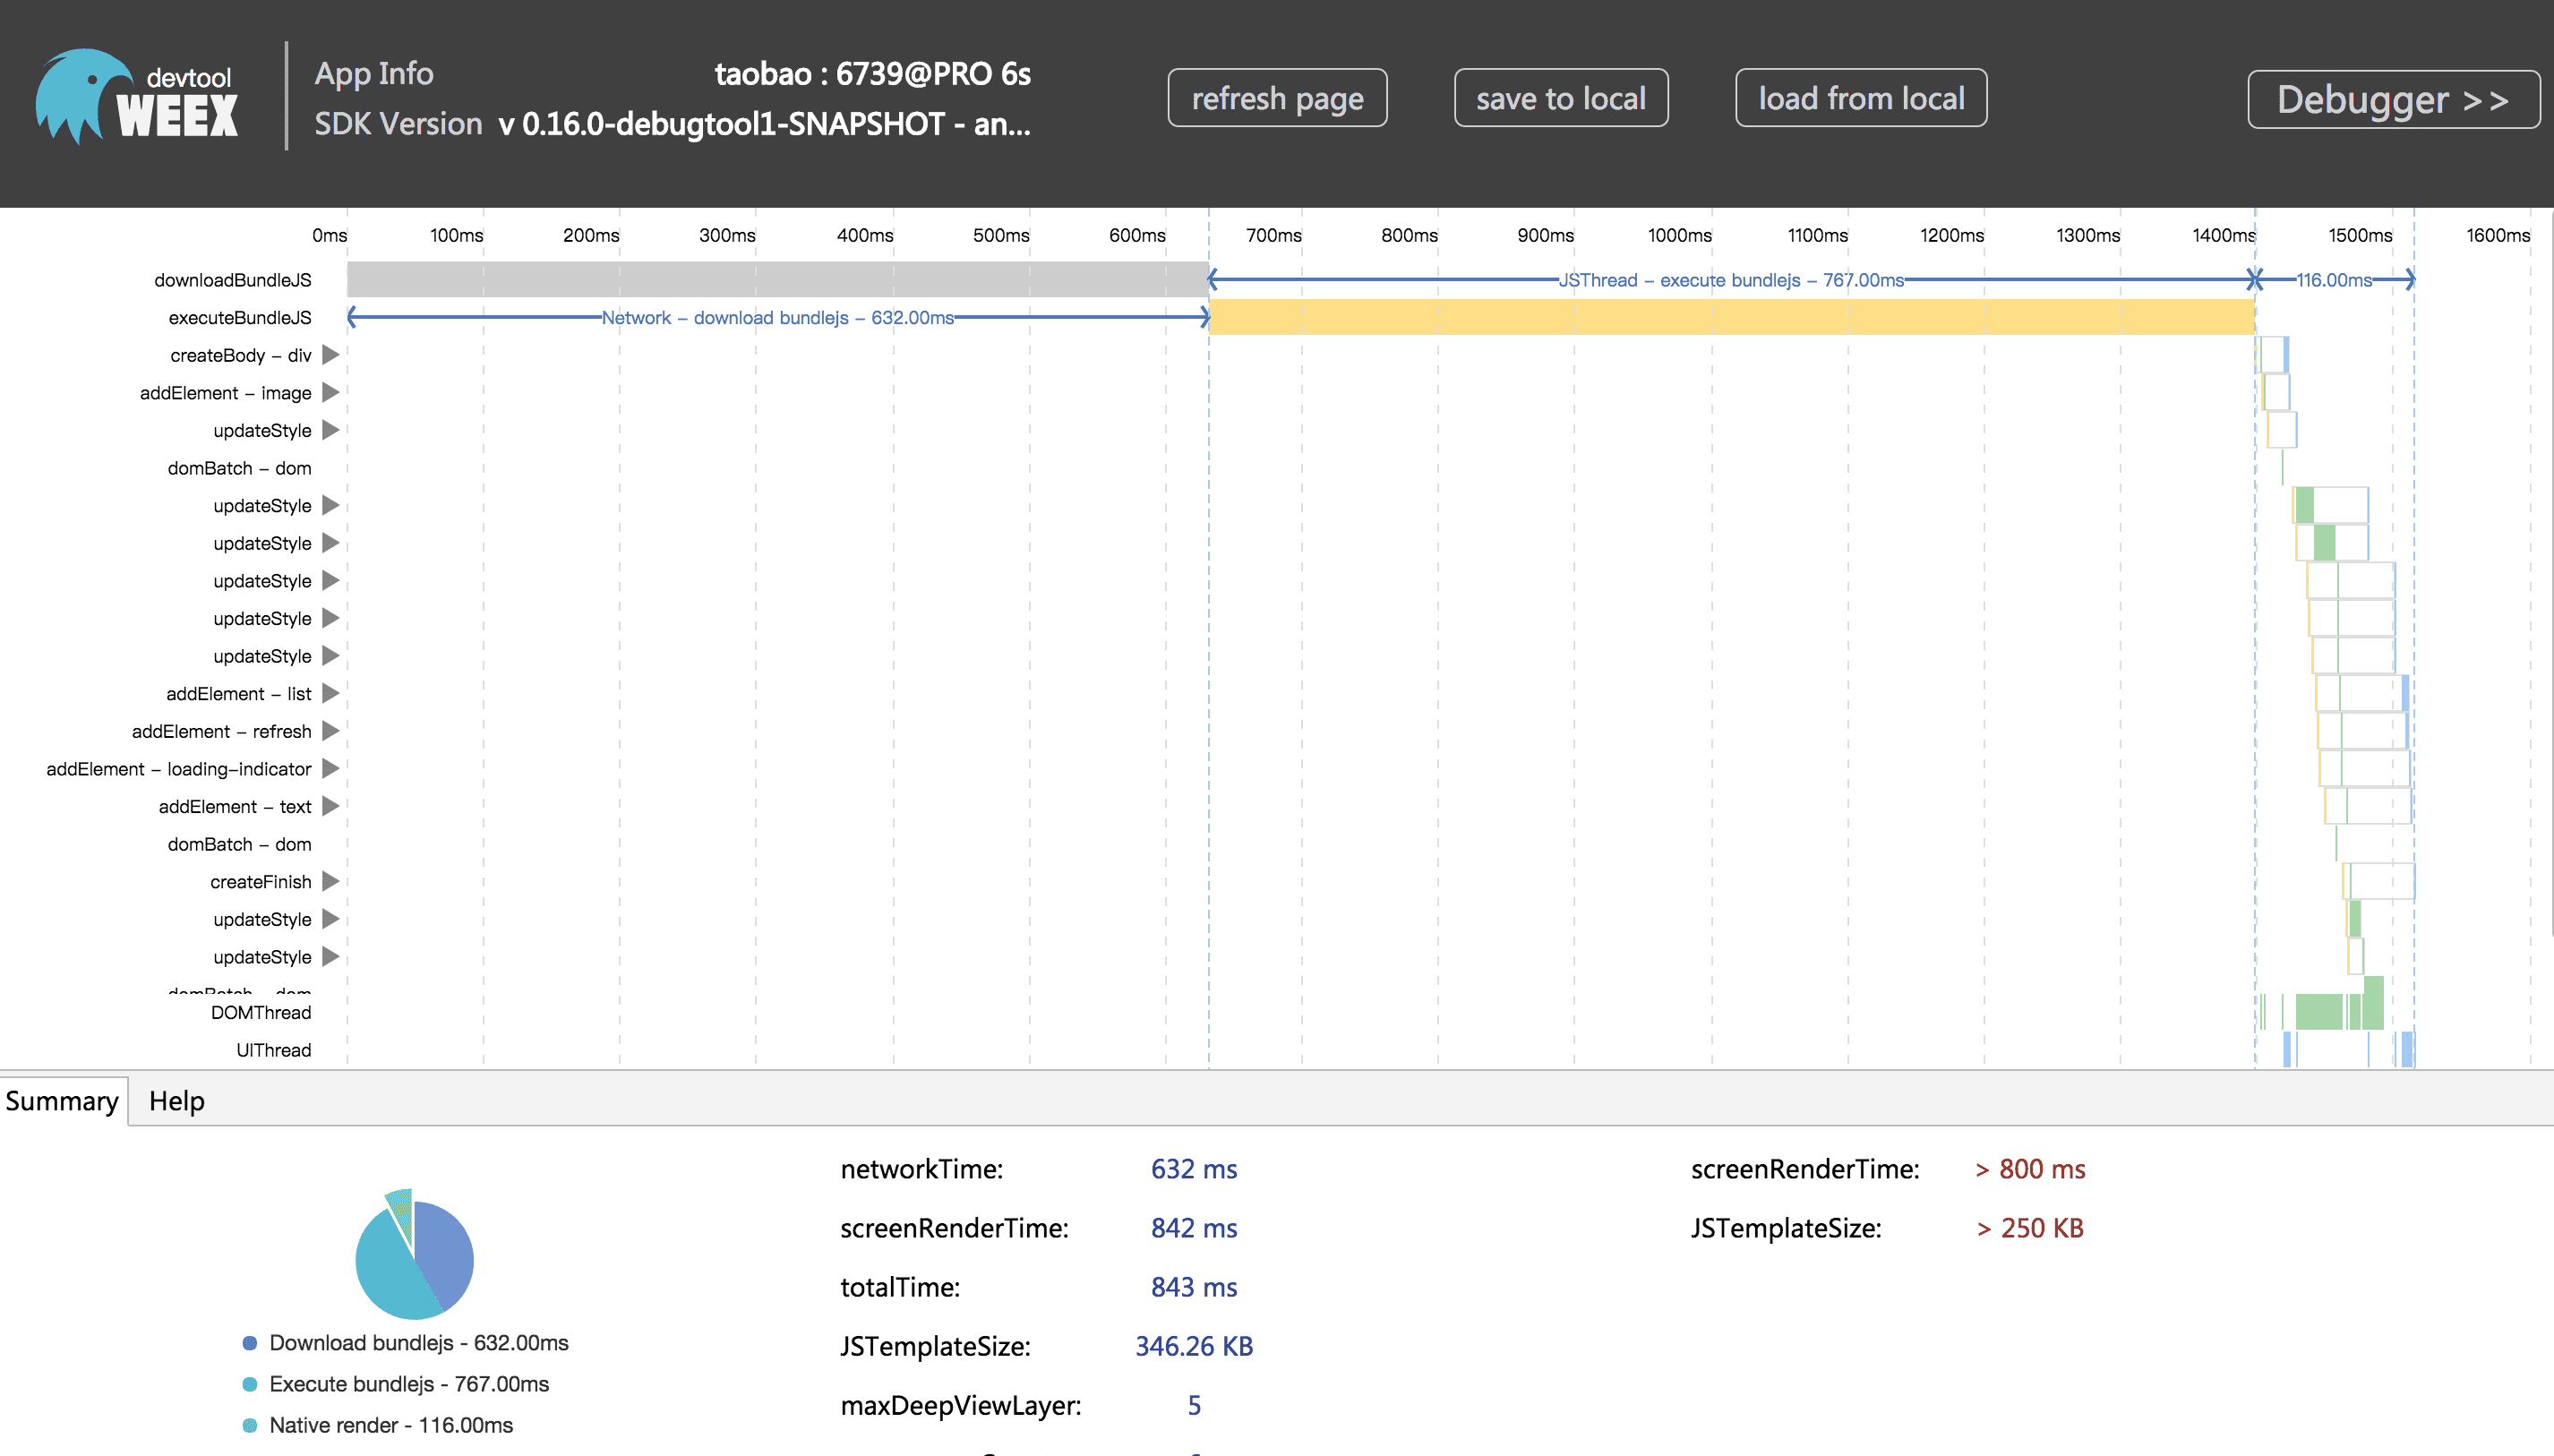
Integrate devtool
- Android
- See the doc Weex devtools (Android), it will lead you to config and use it step by step.
- iOS
- See the doc Weex devtools (iOS), it will lead you to config and use it step by step.