| # Drools + SpringBoot + Runtime metrics |
| |
| ## Description |
| |
| This example demonstrates how to enable and consume the runtime metrics monitoring feature in Kogito. |
| |
| ### Prerequisites |
| |
| You will need: |
| - Java 11+ installed |
| - Environment variable JAVA_HOME set accordingly |
| - Maven 3.8.6+ installed |
| - Docker 19+ (only if you want to run the integration tests and/or you want to use the `docker-compose` script provided in this example). |
| |
| ### How to enable the feature |
| |
| Import the following dependency in your `pom.xml`: |
| |
| ```XML |
| <dependency> |
| <groupId>org.kie.kogito</groupId> |
| <artifactId>kogito-addons-springboot-monitoring-prometheus</artifactId> |
| </dependency> |
| ``` |
| |
| ### Architecture |
| |
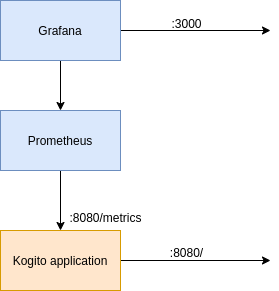
| Once you compile your Springboot project, a dashboard for each available endpoint will be generated under the path `target/classes/META-INF/resources/monitoring/dashboards/`. You can then inject those grafana dashboards during the deployment of the grafana instance. |
| |
| The use case is summarized in the following schema: |
| |
|  |
| |
| To summarize, the kogito app will expose by default an endpoint `/metrics` with the prometheus variables, and a prometheus instance will simply fetch the data from there. |
| |
| ### Dashboards |
| |
| Kogito currently exports two types of dashboards depending on the model used on the endpoint: |
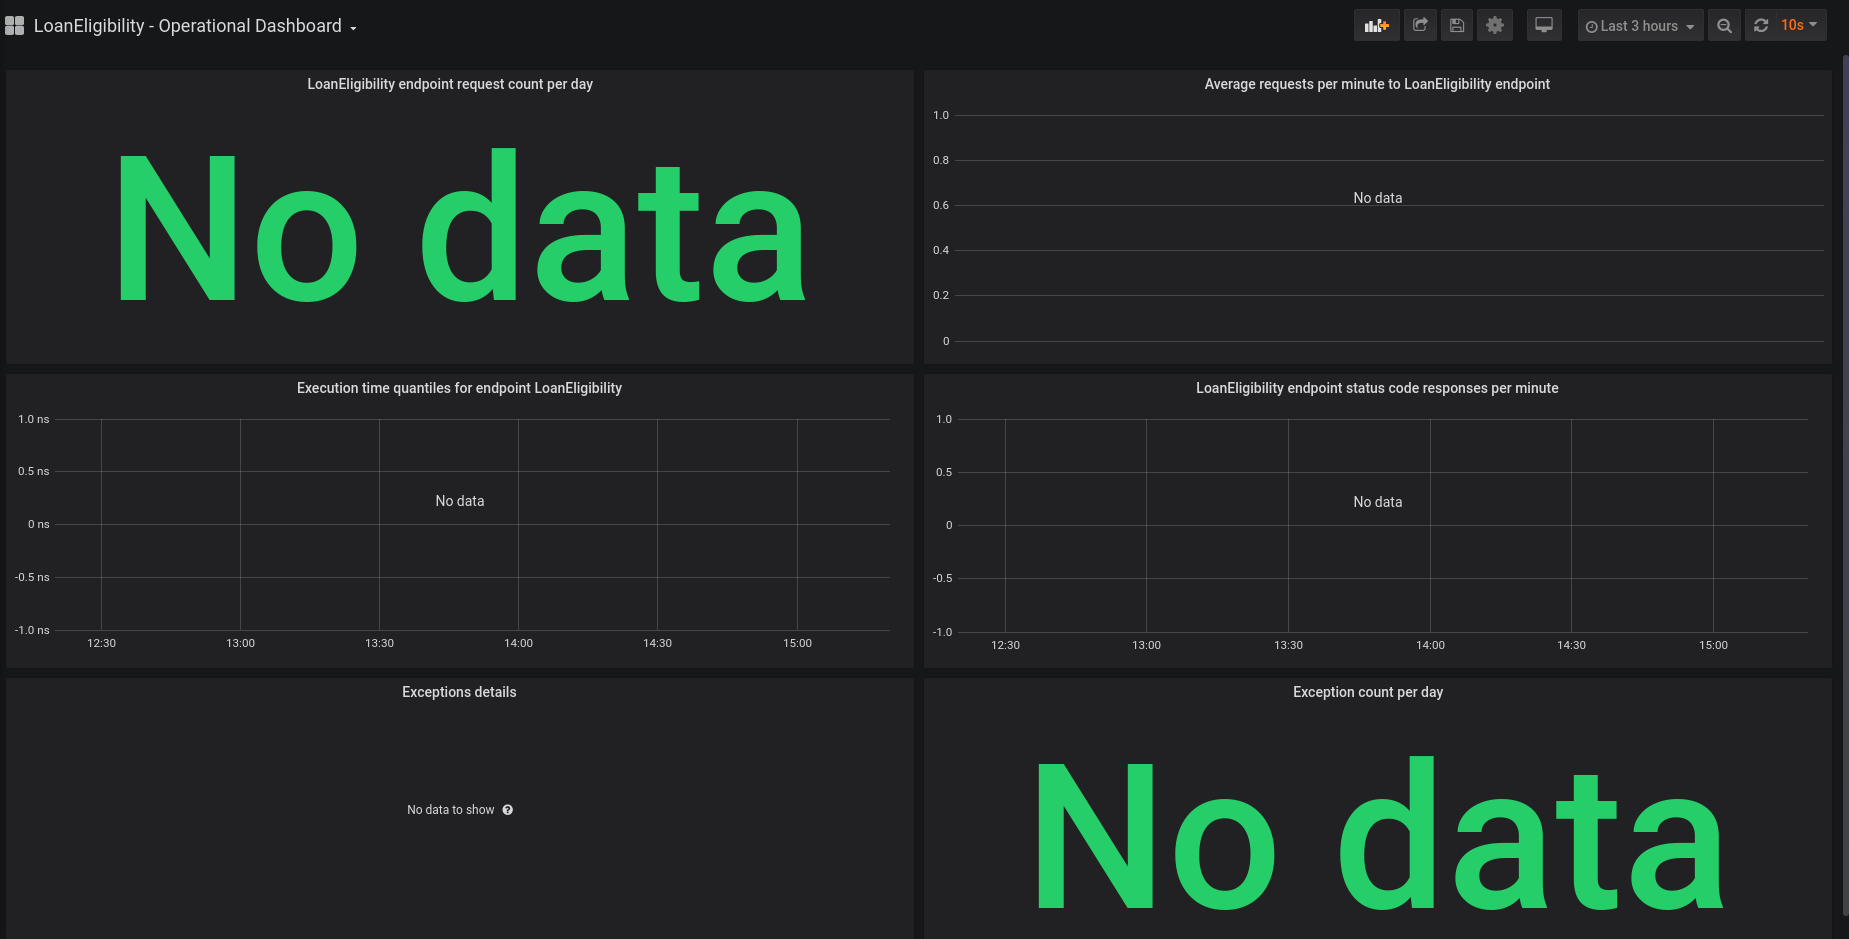
| 1. Operational dashboard: this dashboard is generated for DMN and DRL endpoints and it contains |
| * Total number of requests on the endpoint. |
| * Average per minute of the number of requests on the endpoint. |
| * Quantiles on the elapsed time to evaluate the requests. |
| * Exception details. |
|  |
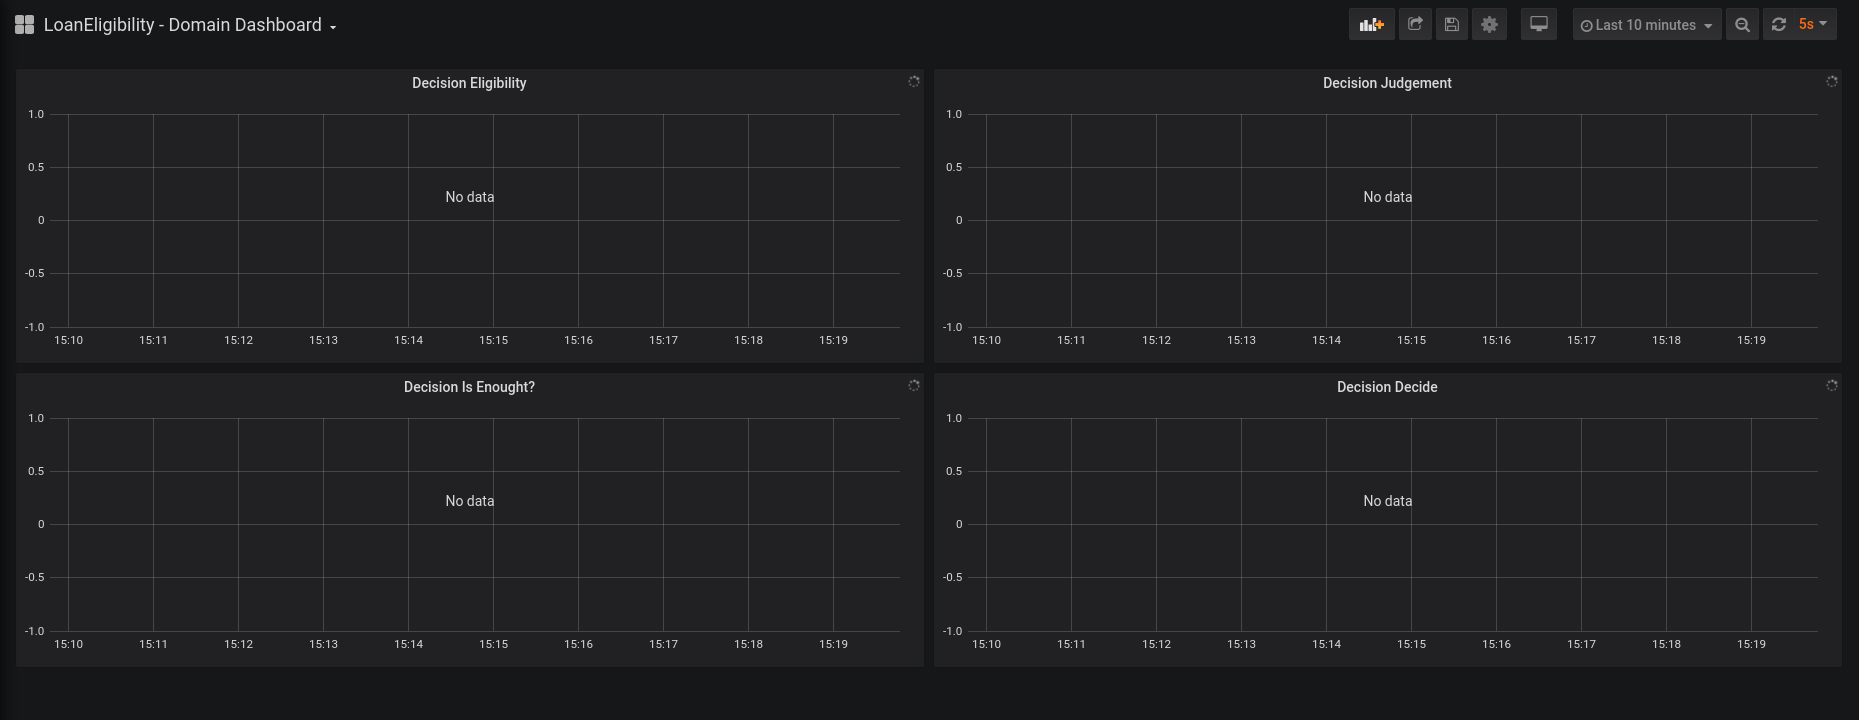
| 2. Domain specific dashboard: currently this dashboard is exported only for DMN endpoints. In particular, the domain specific dashboard contains a graph for each type of decision in the DMN model. At the moment, only the built-in types `number`, `string` and `boolean` are supported: |
| * if the output of the decision is a number, the graph contains the quantiles for that metric (on a sliding window of 3 minutes). |
| * If the output is a boolean or a string, the graph contains the number of occurrences for each output (10 minutes average). |
|  |
| |
| You can use these default dashboards, or you can personalize them and use your custom dashboards. |
| |
| #### Custom dashboards |
| User may add custom dashboards defined as `json` files. Format specification and details are provided in the [Official documentation](https://grafana.com/docs/grafana/latest/dashboards/json-model/) page. |
| There are some conventions to be followed to successfully add such dashboards inside a `Kogito` project: |
| |
| 1. dashboard files must be stored inside `/src/main/resources/META-INF/dashboards` directory |
| 2. dashboard file names must start with `domain-dashoboard` (for domain specific dashboards) or `operational-dashboard` (for operational ones) |
| 3. dashboard file names must end with `.json` |
| 4. dashboard file names should not conflict with auto-generated ones |
| 5. the `title` attribute of custom dashboards should not conflict with auto-generated ones. |
| |
| Custom dashboards will be available in the grafana panel, together with auto-generated ones. |
| |
| ### Compile and Run in Local Dev Mode |
| |
| It is possible to use `docker-compose` to demonstrate how to inject the generated dashboards in the volume of the grafana container: |
| 1. Run `mvn clean package` to build the project and generate dashboards. A docker image tagged `org.kie.kogito.examples/dmn-drools-springboot-metrics-example:1.0` will be built (docker must be installed on your system). |
| 2. Run `docker-compose up` to start the applications. |
| |
| The volumes of the grafana container are properly set in the `docker-compose.yml` file, so that the dashboards are properly loaded at startup. |
| |
| ## Example Usage |
| |
| Once the service is up and running, you can use the following example to interact with the service. |
| |
| ### POST /hello |
| |
| Post "hello": |
| |
| ```sh |
| curl -H "Content-Type: application/json" -X POST -d '{"strings":["world"]}' http://localhost:8080/hello |
| ``` |
| |
| the service will return `["hello", "world"]` |
| |
| ### POST /LoanEligibility |
| |
| Post: |
| |
| ```sh |
| curl -X POST 'http://localhost:8080/LoanEligibility' -H 'Content-Type: application/json' \ |
| -d '{ |
| "Client": {"age": 43,"salary": 1950, "existing payments": 100}, |
| "Loan": {"duration": 15,"installment": 180}, |
| "SupremeDirector" : "Yes", |
| "Bribe": 1000 |
| }' |
| ``` |
| |
| the service will return the decision results. |
| |
| If you are using the `docker-compose` script we provided, go to `localhost:3000` and have a look at your dashboards. |