This example demonstrates how to enable and consume the runtime metrics monitoring feature in Kogito.
You will need:
docker-compose script provided in this example).Import the following dependency in your pom.xml:
<dependency>
 <groupId>org.kie.kogito</groupId>
 <artifactId>kogito-addons-quarkus-monitoring-prometheus</artifactId>
</dependency>
Once you compile your Quarkus project, a dashboard for each available endpoint will be generated under the path target/classes/META-INF/resources/monitoring/dashboards/. You can then inject those grafana dashboards during the deployment of the grafana instance.
The use case is summarized in the following schema:
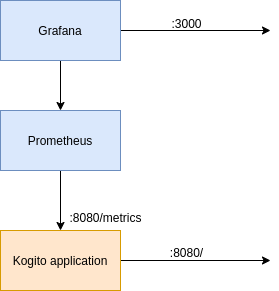
To summarize, the kogito app will expose by default an endpoint /metrics with the prometheus variables, and a prometheus instance will simply fetch the data from there.
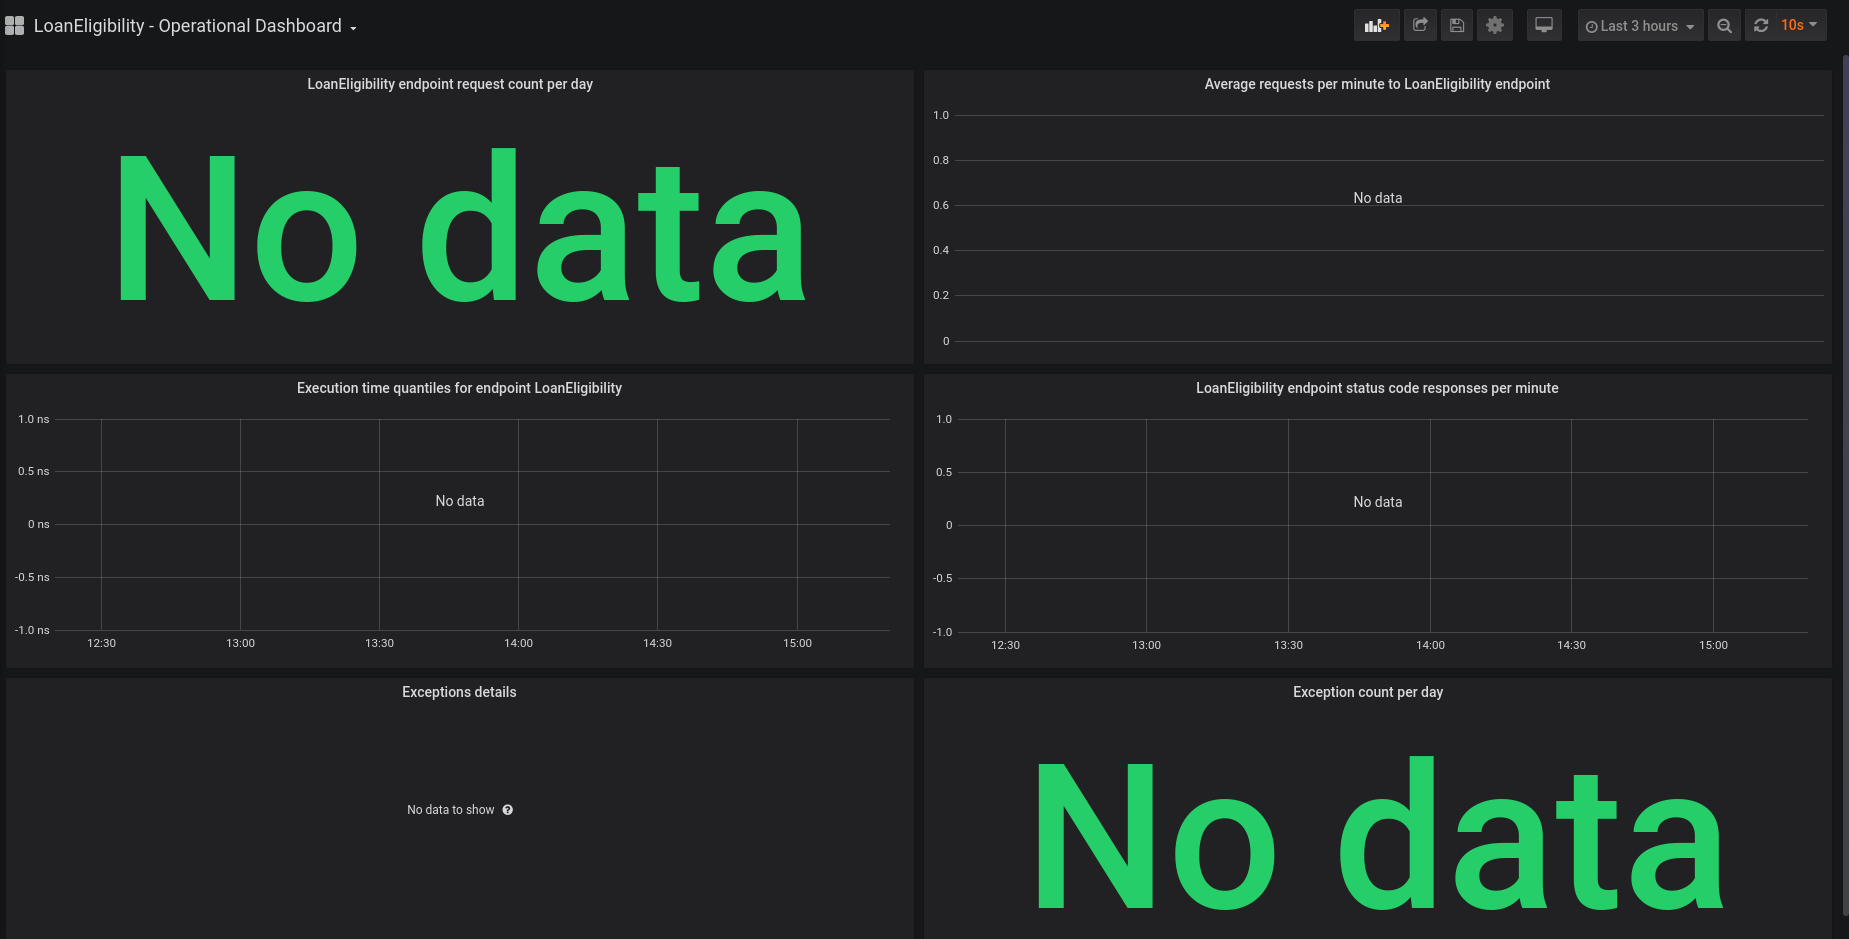
Kogito currently exports two types of dashboards depending on the model used on the endpoint:
number, string and boolean are supported: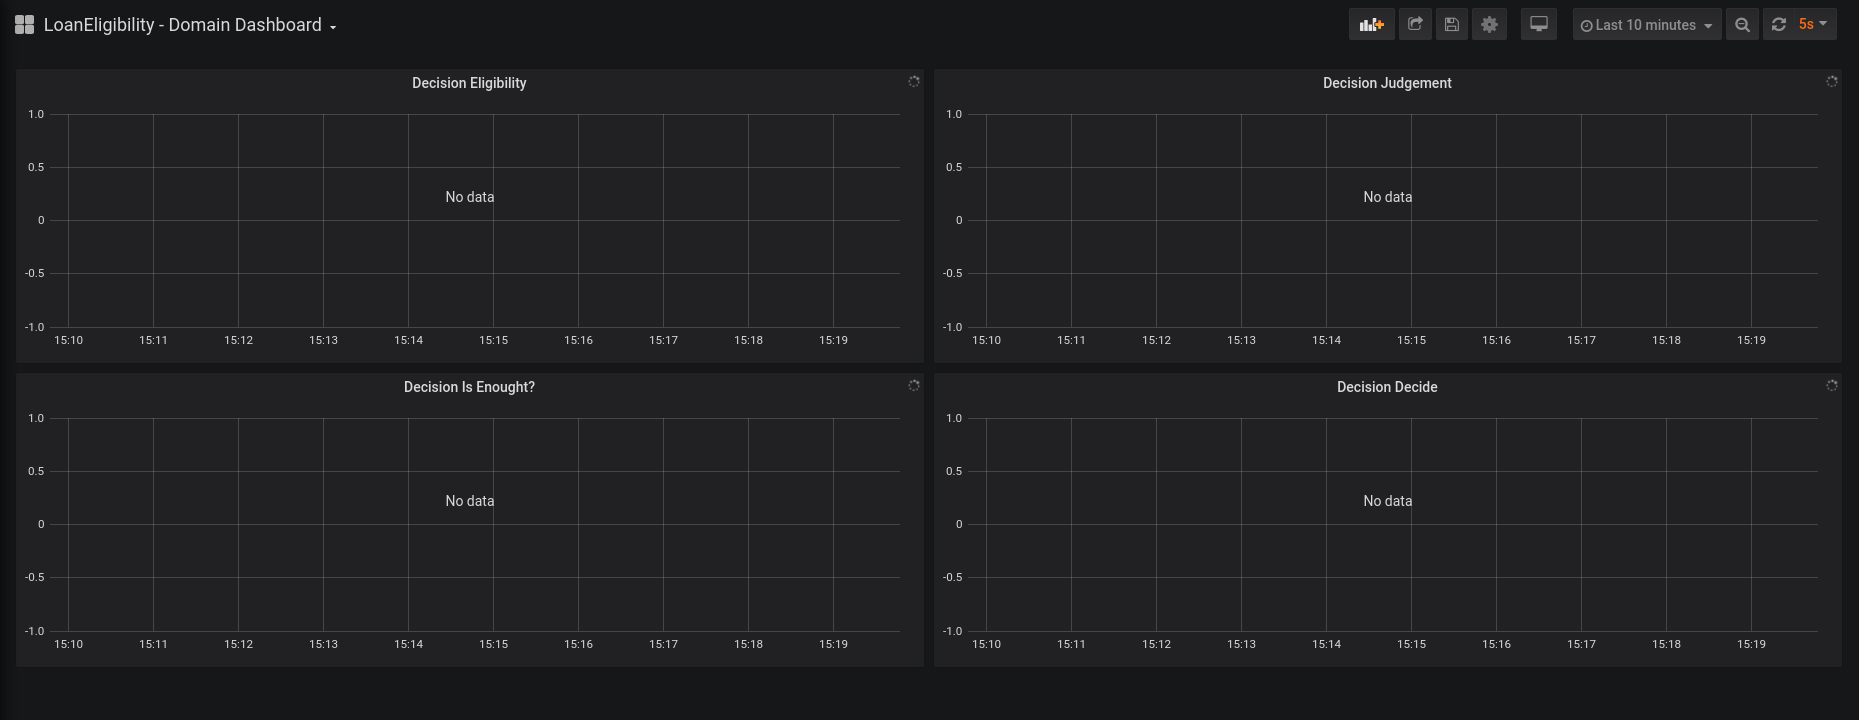
You can use these default dashboards, or you can personalize them and use your custom dashboards.
User may add custom dashboards defined as json files. Format specification and details are provided in the Official documentation page. There are some conventions to be followed to successfully add such dashboards inside a Kogito project:
/src/main/resources/META-INF/dashboards directorydomain-dashoboard (for domain specific dashboards) or operational-dashboard (for operational ones).jsontitle attribute of custom dashboards should not conflict with auto-generated ones.Custom dashboards will be available in the grafana panel, together with auto-generated ones.
It is possible to use docker-compose to demonstrate how to inject the generated dashboards in the volume of the grafana container:
mvn clean package to build the project and generate dashboards. A docker image tagged org.kie.kogito.examples/dmn-drools-quarkus-metrics-example:1.0 will be built (docker must be installed on your system).docker-compose up to start the applications.The volumes of the grafana container are properly set in the docker-compose.yml file, so that the dashboards are properly loaded at startup.
Once the service is up and running, you can use the following example to interact with the service.
Post “hello”:
curl -H "Content-Type: application/json" -X POST -d '{"strings":["world"]}' http://localhost:8080/hello
the service will return ["hello", "world"]
Post:
curl -X POST 'http://localhost:8080/LoanEligibility' -H 'Content-Type: application/json' \
    -d '{
        "Client": {"age": 43,"salary": 1950, "existing payments": 100},
        "Loan": {"duration": 15,"installment": 180},
        "SupremeDirector" : "Yes",
        "Bribe": 1000
    }'
the service will return the decision results.
If you are using the docker-compose script we provided, go to localhost:3000 and have a look at your dashboards.