layout: doc_page
Greetings! We see you‘ve taken an interest in Druid. That’s awesome! Hopefully this tutorial will help clarify some core Druid concepts. We will go through one of the Real-time Examples, and issue some basic Druid queries. The data source we'll be working with is the Twitter spritzer stream. If you are ready to explore Druid, brave its challenges, and maybe learn a thing or two, read on!
Setting Up
There are two ways to setup Druid: download a tarball, or build it from source.
Download a Tarball
We‘ve built a tarball that contains everything you’ll need. You'll find it here. Download this bad boy to a directory of your choosing.
You can extract the awesomeness within by issuing:
tar -zxvf druid-services-0.X.X.tar.gz
Not too lost so far right? That's great! If you cd into the directory:
cd druid-services-0.X.X
You should see a bunch of files:
- run_example_server.sh
- run_example_client.sh
- LICENSE, config, examples, lib directories
Clone and Build from Source
The other way to setup Druid is from source via git. To do so, run these commands:
git clone git@github.com:metamx/druid.git
cd druid
git checkout druid-0.X.X
./build.sh
You should see a bunch of files:
DruidCorporateCLA.pdf	README			common			examples		indexer			pom.xml			server
DruidIndividualCLA.pdf	build.sh		doc			group_by.body		install			publications		services
LICENSE			client			eclipse_formatting.xml	index-common		merger			realtime
You can find the example executables in the examples/bin directory:
- run_example_server.sh
- run_example_client.sh
Running Example Scripts
Let's start doing stuff. You can start a Druid Realtime node by issuing:
./run_example_server.sh
Select “twitter”.
You‘ll need to register a new application with the twitter API, which only takes a minute. Go to this link and fill out the form and submit. Don’t worry, the home page and callback url can be anything. This will generate keys for the Twitter example application. Take note of the values for consumer key/secret and access token/secret.
Enter your credentials when prompted.
Once the node starts up you will see a bunch of logs about setting up properties and connecting to the data source. If everything was successful, you should see messages of the form shown below. If you see crazy exceptions, you probably typed in your login information incorrectly.
2013-05-17 23:04:40,934 INFO [main] org.mortbay.log - Started SelectChannelConnector@0.0.0.0:8080
2013-05-17 23:04:40,935 INFO [main] com.metamx.common.lifecycle.Lifecycle$AnnotationBasedHandler - Invoking start method[public void com.metamx.druid.http.FileRequestLogger.start()] on object[com.metamx.druid.http.FileRequestLogger@42bb0406].
2013-05-17 23:04:41,578 INFO [Twitter Stream consumer-1[Establishing connection]] twitter4j.TwitterStreamImpl - Connection established.
2013-05-17 23:04:41,578 INFO [Twitter Stream consumer-1[Establishing connection]] io.druid.examples.twitter.TwitterSpritzerFirehoseFactory - Connected_to_Twitter
2013-05-17 23:04:41,578 INFO [Twitter Stream consumer-1[Establishing connection]] twitter4j.TwitterStreamImpl - Receiving status stream.
Periodically, you'll also see messages of the form:
2013-05-17 23:04:59,793 INFO [chief-twitterstream] io.druid.examples.twitter.TwitterSpritzerFirehoseFactory - nextRow() has returned 1,000 InputRows
These messages indicate you are ingesting events. The Druid real time-node ingests events in an in-memory buffer. Periodically, these events will be persisted to disk. Persisting to disk generates a whole bunch of logs:
2013-05-17 23:06:40,918 INFO [chief-twitterstream] com.metamx.druid.realtime.plumber.RealtimePlumberSchool - Submitting persist runnable for dataSource[twitterstream]
2013-05-17 23:06:40,920 INFO [twitterstream-incremental-persist] com.metamx.druid.realtime.plumber.RealtimePlumberSchool - DataSource[twitterstream], Interval[2013-05-17T23:00:00.000Z/2013-05-18T00:00:00.000Z], persisting Hydrant[FireHydrant{index=com.metamx.druid.index.v1.IncrementalIndex@126212dd, queryable=com.metamx.druid.index.IncrementalIndexSegment@64c47498, count=0}]
2013-05-17 23:06:40,937 INFO [twitterstream-incremental-persist] com.metamx.druid.index.v1.IndexMerger - Starting persist for interval[2013-05-17T23:00:00.000Z/2013-05-17T23:07:00.000Z], rows[4,666]
2013-05-17 23:06:41,039 INFO [twitterstream-incremental-persist] com.metamx.druid.index.v1.IndexMerger - outDir[/tmp/example/twitter_realtime/basePersist/twitterstream/2013-05-17T23:00:00.000Z_2013-05-18T00:00:00.000Z/0/v8-tmp] completed index.drd in 11 millis.
2013-05-17 23:06:41,070 INFO [twitterstream-incremental-persist] com.metamx.druid.index.v1.IndexMerger - outDir[/tmp/example/twitter_realtime/basePersist/twitterstream/2013-05-17T23:00:00.000Z_2013-05-18T00:00:00.000Z/0/v8-tmp] completed dim conversions in 31 millis.
2013-05-17 23:06:41,275 INFO [twitterstream-incremental-persist] com.metamx.druid.index.v1.CompressedPools - Allocating new chunkEncoder[1]
2013-05-17 23:06:41,332 INFO [twitterstream-incremental-persist] com.metamx.druid.index.v1.IndexMerger - outDir[/tmp/example/twitter_realtime/basePersist/twitterstream/2013-05-17T23:00:00.000Z_2013-05-18T00:00:00.000Z/0/v8-tmp] completed walk through of 4,666 rows in 262 millis.
2013-05-17 23:06:41,334 INFO [twitterstream-incremental-persist] com.metamx.druid.index.v1.IndexMerger - Starting dimension[htags] with cardinality[634]
2013-05-17 23:06:41,381 INFO [twitterstream-incremental-persist] com.metamx.druid.index.v1.IndexMerger - Completed dimension[htags] in 49 millis.
2013-05-17 23:06:41,382 INFO [twitterstream-incremental-persist] com.metamx.druid.index.v1.IndexMerger - Starting dimension[lang] with cardinality[19]
2013-05-17 23:06:41,398 INFO [twitterstream-incremental-persist] com.metamx.druid.index.v1.IndexMerger - Completed dimension[lang] in 17 millis.
2013-05-17 23:06:41,398 INFO [twitterstream-incremental-persist] com.metamx.druid.index.v1.IndexMerger - Starting dimension[utc_offset] with cardinality[32]
2013-05-17 23:06:41,413 INFO [twitterstream-incremental-persist] com.metamx.druid.index.v1.IndexMerger - Completed dimension[utc_offset] in 15 millis.
2013-05-17 23:06:41,413 INFO [twitterstream-incremental-persist] com.metamx.druid.index.v1.IndexMerger - outDir[/tmp/example/twitter_realtime/basePersist/twitterstream/2013-05-17T23:00:00.000Z_2013-05-18T00:00:00.000Z/0/v8-tmp] completed inverted.drd in 81 millis.
2013-05-17 23:06:41,425 INFO [twitterstream-incremental-persist] com.metamx.druid.index.v1.IndexIO$DefaultIndexIOHandler - Converting v8[/tmp/example/twitter_realtime/basePersist/twitterstream/2013-05-17T23:00:00.000Z_2013-05-18T00:00:00.000Z/0/v8-tmp] to v9[/tmp/example/twitter_realtime/basePersist/twitterstream/2013-05-17T23:00:00.000Z_2013-05-18T00:00:00.000Z/0]
2013-05-17 23:06:41,426 INFO [twitterstream-incremental-persist]
... ETC
The logs are about building different columns, probably not the most exciting stuff (they might as well be in Vulcan) if are you learning about Druid for the first time. Nevertheless, if you are interested in the details of our real-time architecture and why we persist indexes to disk, I suggest you read our “White Paper”:http://static.druid.io/docs/druid.pdf.
Okay, things are about to get real (-time). To query the real-time node you've spun up, you can issue:
./run_example_client.sh
Select “twitter” once again. This script issues GroupByQueries to the twitter data we've been ingesting. The query looks like this:
{
    "queryType": "groupBy",
    "dataSource": "twitterstream",
    "granularity": "all",
    "dimensions": ["lang", "utc_offset"],
    "aggregations":[
      { "type": "count", "name": "rows"},
      { "type": "doubleSum", "fieldName": "tweets", "name": "tweets"}
    ],
    "filter": { "type": "selector", "dimension": "lang", "value": "en" },
    "intervals":["2012-10-01T00:00/2020-01-01T00"]
}
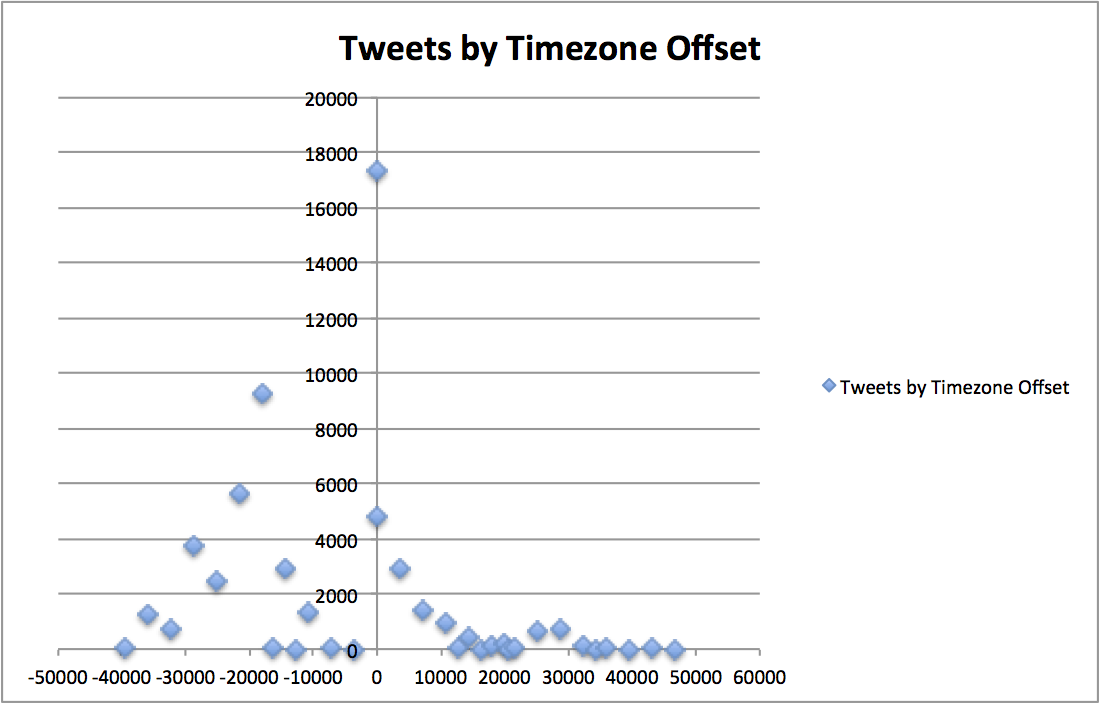
This is a groupBy query, which you may be familiar with from SQL. We are grouping, or aggregating, via the dimensions field: [“lang”, “utc_offset”]. We are filtering via the “lang” dimension, to only look at english tweets. Our aggregations are what we are calculating: a row count, and the sum of the tweets in our data.
The result looks something like this:
[
    {
        "version": "v1",
        "timestamp": "2012-10-01T00:00:00.000Z",
        "event": {
            "utc_offset": "-10800",
            "tweets": 90,
            "lang": "en",
            "rows": 81
        }
    },
    {
        "version": "v1",
        "timestamp": "2012-10-01T00:00:00.000Z",
        "event": {
            "utc_offset": "-14400",
            "tweets": 177,
            "lang": "en",
            "rows": 154
        }
    },
...
This data, plotted in a time series/distribution, looks something like this:
This groupBy query is a bit complicated and we'll return to it later. For the time being, just make sure you are getting some blocks of data back. If you are having problems, make sure you have curl installed. Control+C to break out of the client script.
Querying Druid
In your favorite editor, create the file:
time_boundary_query.body
Druid queries are JSON blobs which are relatively painless to create programmatically, but an absolute pain to write by hand. So anyway, we are going to create a Druid query by hand. Add the following to the file you just created:
{

  "queryType"  : "timeBoundary",
  "dataSource" : "twitterstream"
}
The “TimeBoundaryQuery”:TimeBoundaryQuery.html is one of the simplest Druid queries. To run the query, you can issue:
curl -X POST 'http://localhost:8080/druid/v2/?pretty' -H 'content-type: application/json' -d @time_boundary_query.body
We get something like this JSON back:
{
  "timestamp" : "2013-06-10T19:09:00.000Z",
  "result" : {
    "minTime" : "2013-06-10T19:09:00.000Z",
    "maxTime" : "2013-06-10T20:50:00.000Z"
  }
} ]
That‘s the result. What information do you think the result is conveying? ... If you said the result is indicating the maximum and minimum timestamps we’ve seen thus far (summarized to a minutely granularity), you are absolutely correct. I can see you are a person legitimately interested in learning about Druid. Let's explore a bit further.
Return to your favorite editor and create the file:
timeseries_query.body
We are going to make a slightly more complicated query, the TimeseriesQuery. Copy and paste the following into the file:
{
  "queryType":"timeseries",
  "dataSource":"twitterstream",
  "intervals":["2010-01-01/2020-01-01"],
  "granularity":"all",
  "aggregations":[
      { "type": "count", "name": "rows"},
      { "type": "doubleSum", "fieldName": "tweets", "name": "tweets"}
  ]
}
You are probably wondering, what are these Granularities and Aggregations things? What the query is doing is aggregating some metrics over some span of time. To issue the query and get some results, run the following in your command line:
curl -X POST 'http://localhost:8080/druid/v2/?pretty' -H 'content-type: application/json' -d @timeseries_query.body
Once again, you should get a JSON blob of text back with your results, that looks something like this:
[ {
  "timestamp" : "2013-06-10T19:09:00.000Z",
  "result" : {
    "tweets" : 358562.0,
    "rows" : 272271
  }
} ]
If you issue the query again, you should notice your results updating.
Right now all the results you are getting back are being aggregated into a single timestamp bucket. What if we wanted to see our aggregations on a per minute basis? What field can we change in the query to accomplish this?
If you loudly exclaimed “we can change granularity to minute”, you are absolutely correct again! We can specify different granularities to bucket our results, like so:
{
  "queryType":"timeseries",
  "dataSource":"twitterstream",
  "intervals":["2010-01-01/2020-01-01"],
  "granularity":"minute",
  "aggregations":[
      { "type": "count", "name": "rows"},
      { "type": "doubleSum", "fieldName": "tweets", "name": "tweets"}
  ]
}
This gives us something like the following:
[ {
  "timestamp" : "2013-06-10T19:09:00.000Z",
  "result" : {
    "tweets" : 2650.0,
    "rows" : 2120
  }
}, {
  "timestamp" : "2013-06-10T19:10:00.000Z",
  "result" : {
    "tweets" : 3401.0,
    "rows" : 2609
  }
}, {
  "timestamp" : "2013-06-10T19:11:00.000Z",
  "result" : {
    "tweets" : 3472.0,
    "rows" : 2610
  }
},
...
Solving a Problem
One of Druid‘s main powers (see what we did there?) is to provide answers to problems, so let’s pose a problem. What if we wanted to know what the top hash tags are, ordered by the number tweets, where the language is english, over the last few minutes you've been reading this tutorial? To solve this problem, we have to return to the query we introduced at the very beginning of this tutorial, the “GroupByQuery”:GroupByQuery.html. It would be nice if we could group by results by dimension value and somehow sort those results... and it turns out we can!
Let's create the file:
group_by_query.body
and put the following in there:
{
    "queryType": "groupBy",
    "dataSource": "twitterstream",
    "granularity": "all",
    "dimensions": ["htags"],
    "orderBy": {"type":"default", "columns":[{"dimension": "tweets", "direction":"DESCENDING"}], "limit":5},
    "aggregations":[
      { "type": "longSum", "fieldName": "tweets", "name": "tweets"}
    ],
    "filter": {"type": "selector", "dimension": "lang", "value": "en" },
    "intervals":["2012-10-01T00:00/2020-01-01T00"]
}
Woah! Our query just got a way more complicated. Now we have these “Filters”:Filters.html things and this “OrderBy”:OrderBy.html thing. Fear not, it turns out the new objects we've introduced to our query can help define the format of our results and provide an answer to our question.
If you issue the query:
curl -X POST 'http://localhost:8080/druid/v2/?pretty' -H 'content-type: application/json' -d @group_by_query.body
You should hopefully see an answer to our question. For my twitter stream, it looks like this:
[ {
  "version" : "v1",
  "timestamp" : "2012-10-01T00:00:00.000Z",
  "event" : {
    "tweets" : 2660,
    "htags" : "android"
  }
}, {
  "version" : "v1",
  "timestamp" : "2012-10-01T00:00:00.000Z",
  "event" : {
    "tweets" : 1944,
    "htags" : "E3"
  }
}, {
  "version" : "v1",
  "timestamp" : "2012-10-01T00:00:00.000Z",
  "event" : {
    "tweets" : 1927,
    "htags" : "15SueñosPendientes"
  }
}, {
  "version" : "v1",
  "timestamp" : "2012-10-01T00:00:00.000Z",
  "event" : {
    "tweets" : 1717,
    "htags" : "ipad"
  }
}, {
  "version" : "v1",
  "timestamp" : "2012-10-01T00:00:00.000Z",
  "event" : {
    "tweets" : 1515,
    "htags" : "IDidntTextYouBackBecause"
  }
} ]
Feel free to tweak other query parameters to answer other questions you may have about the data.
Additional Information
This tutorial is merely showcasing a small fraction of what Druid can do. Next, continue on to The Druid Cluster.
And thus concludes our journey! Hopefully you learned a thing or two about Druid real-time ingestion, querying Druid, and how Druid can be used to solve problems. If you have additional questions, feel free to post in our google groups page.