| --- |
| { |
| "title": "Dashboards", |
| "sidebar_label": "Dashboard", |
| "language": "en-US", |
| "description": "How to build observability dashboards on Apache Doris in Grafana? This article covers importing prebuilt dashboards, the OTel data model, Counter rate calculation, template variables, and custom panel construction.", |
| "keywords": [ |
| "Grafana Dashboard", |
| "Doris Dashboard", |
| "OpenTelemetry", |
| "MySQL data source", |
| "template variables", |
| "Counter rate", |
| "Time Series", |
| "Stat panel", |
| "Table panel" |
| ] |
| } |
| --- |
| |
| <!-- Knowledge type: capability definition + operational steps --> |
| <!-- Applicable scenario: observability platform / dashboard construction and customization --> |
| |
| ## **Overview** |
| |
| This document explains how to use DOG Stack observability data in Grafana. |
| |
| DOG Stack uses Doris as the unified storage backend. Doris is MySQL-protocol compatible, so a single MySQL data source in Grafana can query all logs, traces, and metrics. The data path is: |
| |
| ```Plain |
| Apps / Infrastructure → OpenTelemetry Collector → Doris Exporter → Doris → Grafana (MySQL DataSource) |
| ``` |
| |
| This document covers: |
| |
| - Importing prebuilt dashboards: use the ready-made dashboards we provide. |
| - Understanding the data model: how OTel data is stored in Doris. |
| - Creating custom dashboards: build panels, queries, and variables from scratch. |
| - Reference: schema and syntax cheat sheet. |
| |
| |
| |
| ## **Prerequisites** |
| |
| Before you start, make sure: |
| |
| - DOG Stack is deployed, and both Grafana and Doris are running. |
| - A MySQL-type data source connecting to Doris is configured in Grafana (the Grafana shipped with DOG Stack already has a pre-configured Doris data source). |
| |
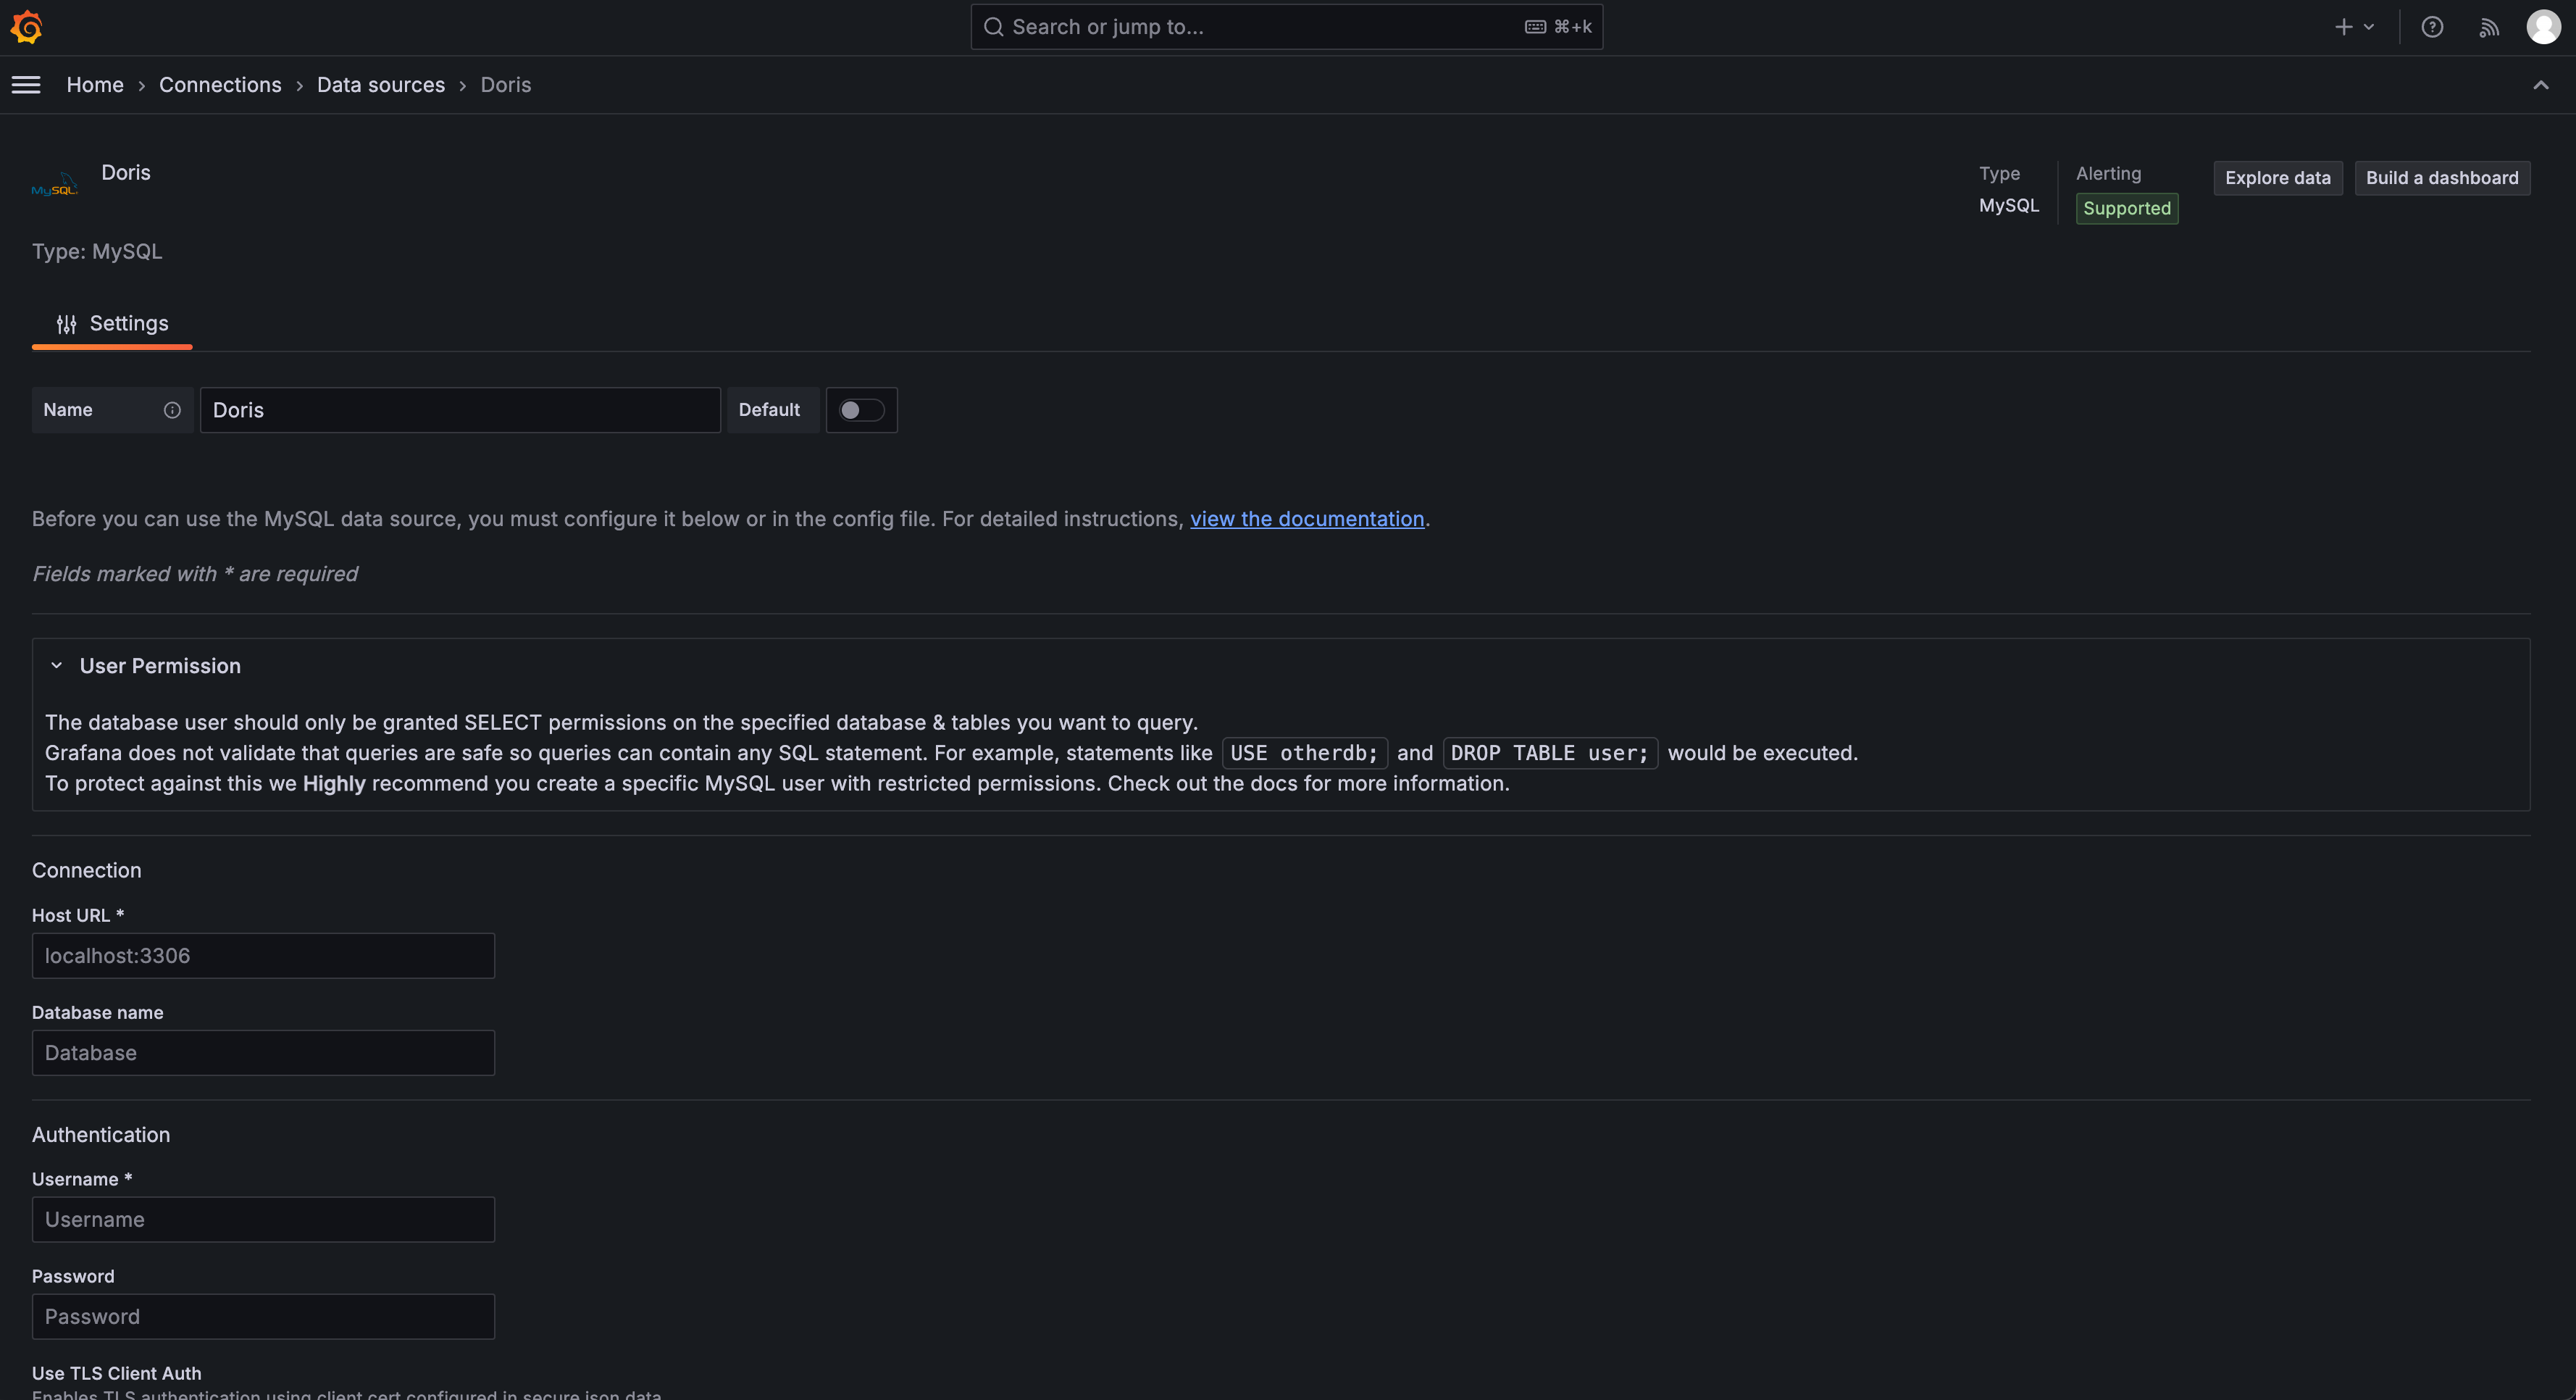
| If you have not configured a data source yet, follow these steps: |
| |
| 1. In Grafana's left-side menu, click **Connections** > **Data sources** > **Add data source**. |
| 2. Select **MySQL**. |
| |
| 1. Fill in the connection information: |
| |
| \- **Host**: `<Doris-fe-host>:9030` |
| |
| \- **Database**: `otel` |
| |
| \- **User**: `root` (or the user you configured) |
| |
| \- **Password**: leave empty (if no password is set) |
| |
| 1. Click **Save & test** to confirm the connection works. |
| |
|  |
| |
| |
| |
| ## **Importing prebuilt dashboards** |
| |
| We provide 4 [prebuilt dashboards](https://github.com/velodb/ai-observe-stack/tree/master/grafana-dashboard) covering common observability scenarios: |
| |
| | Dashboard | File | What it monitors | |
| | ------------------ | ----------------------------------- | ---------------------------------------------- | |
| | Host Metrics | `host_metrics_dashboard.json` | CPU, memory, disk, network, system load | |
| | JVM Monitoring | `jvm_metrics_dashboard.json` | Heap memory, GC, threads, CPU utilization | |
| | K8s Observability | `k8s_kubelet_dashboard.json` | Pod / Node / Namespace resource usage | |
| | Nginx Logs | `nginx_logs_dashboard.json` | Requests, status codes, top URLs, error logs | |
| | PostgreSQL Metrics | `postgresql-metrics-dashboard.json` | Connections, transactions, DB size, Checkpoint, BGWriter | |
| |
| To import a prebuilt dashboard: |
| |
| 1. In Grafana's left-side menu, click **Dashboards** > **New** > **Import**. |
| 2. Click **Upload dashboard JSON file** and choose the JSON file under `grafana-dashboard/`. |
| |
| 1. On the import page, set the data source to your configured Doris (MySQL) data source. |
| 2. Click **Import**. |
| |
| 1. Repeat the steps above for the remaining JSON files. |
| |
| Once imported, the variable selectors at the top of the dashboard (such as Service, Namespace) automatically query their candidate values from Doris. |
| |
| ### Per-dashboard panel details |
| |
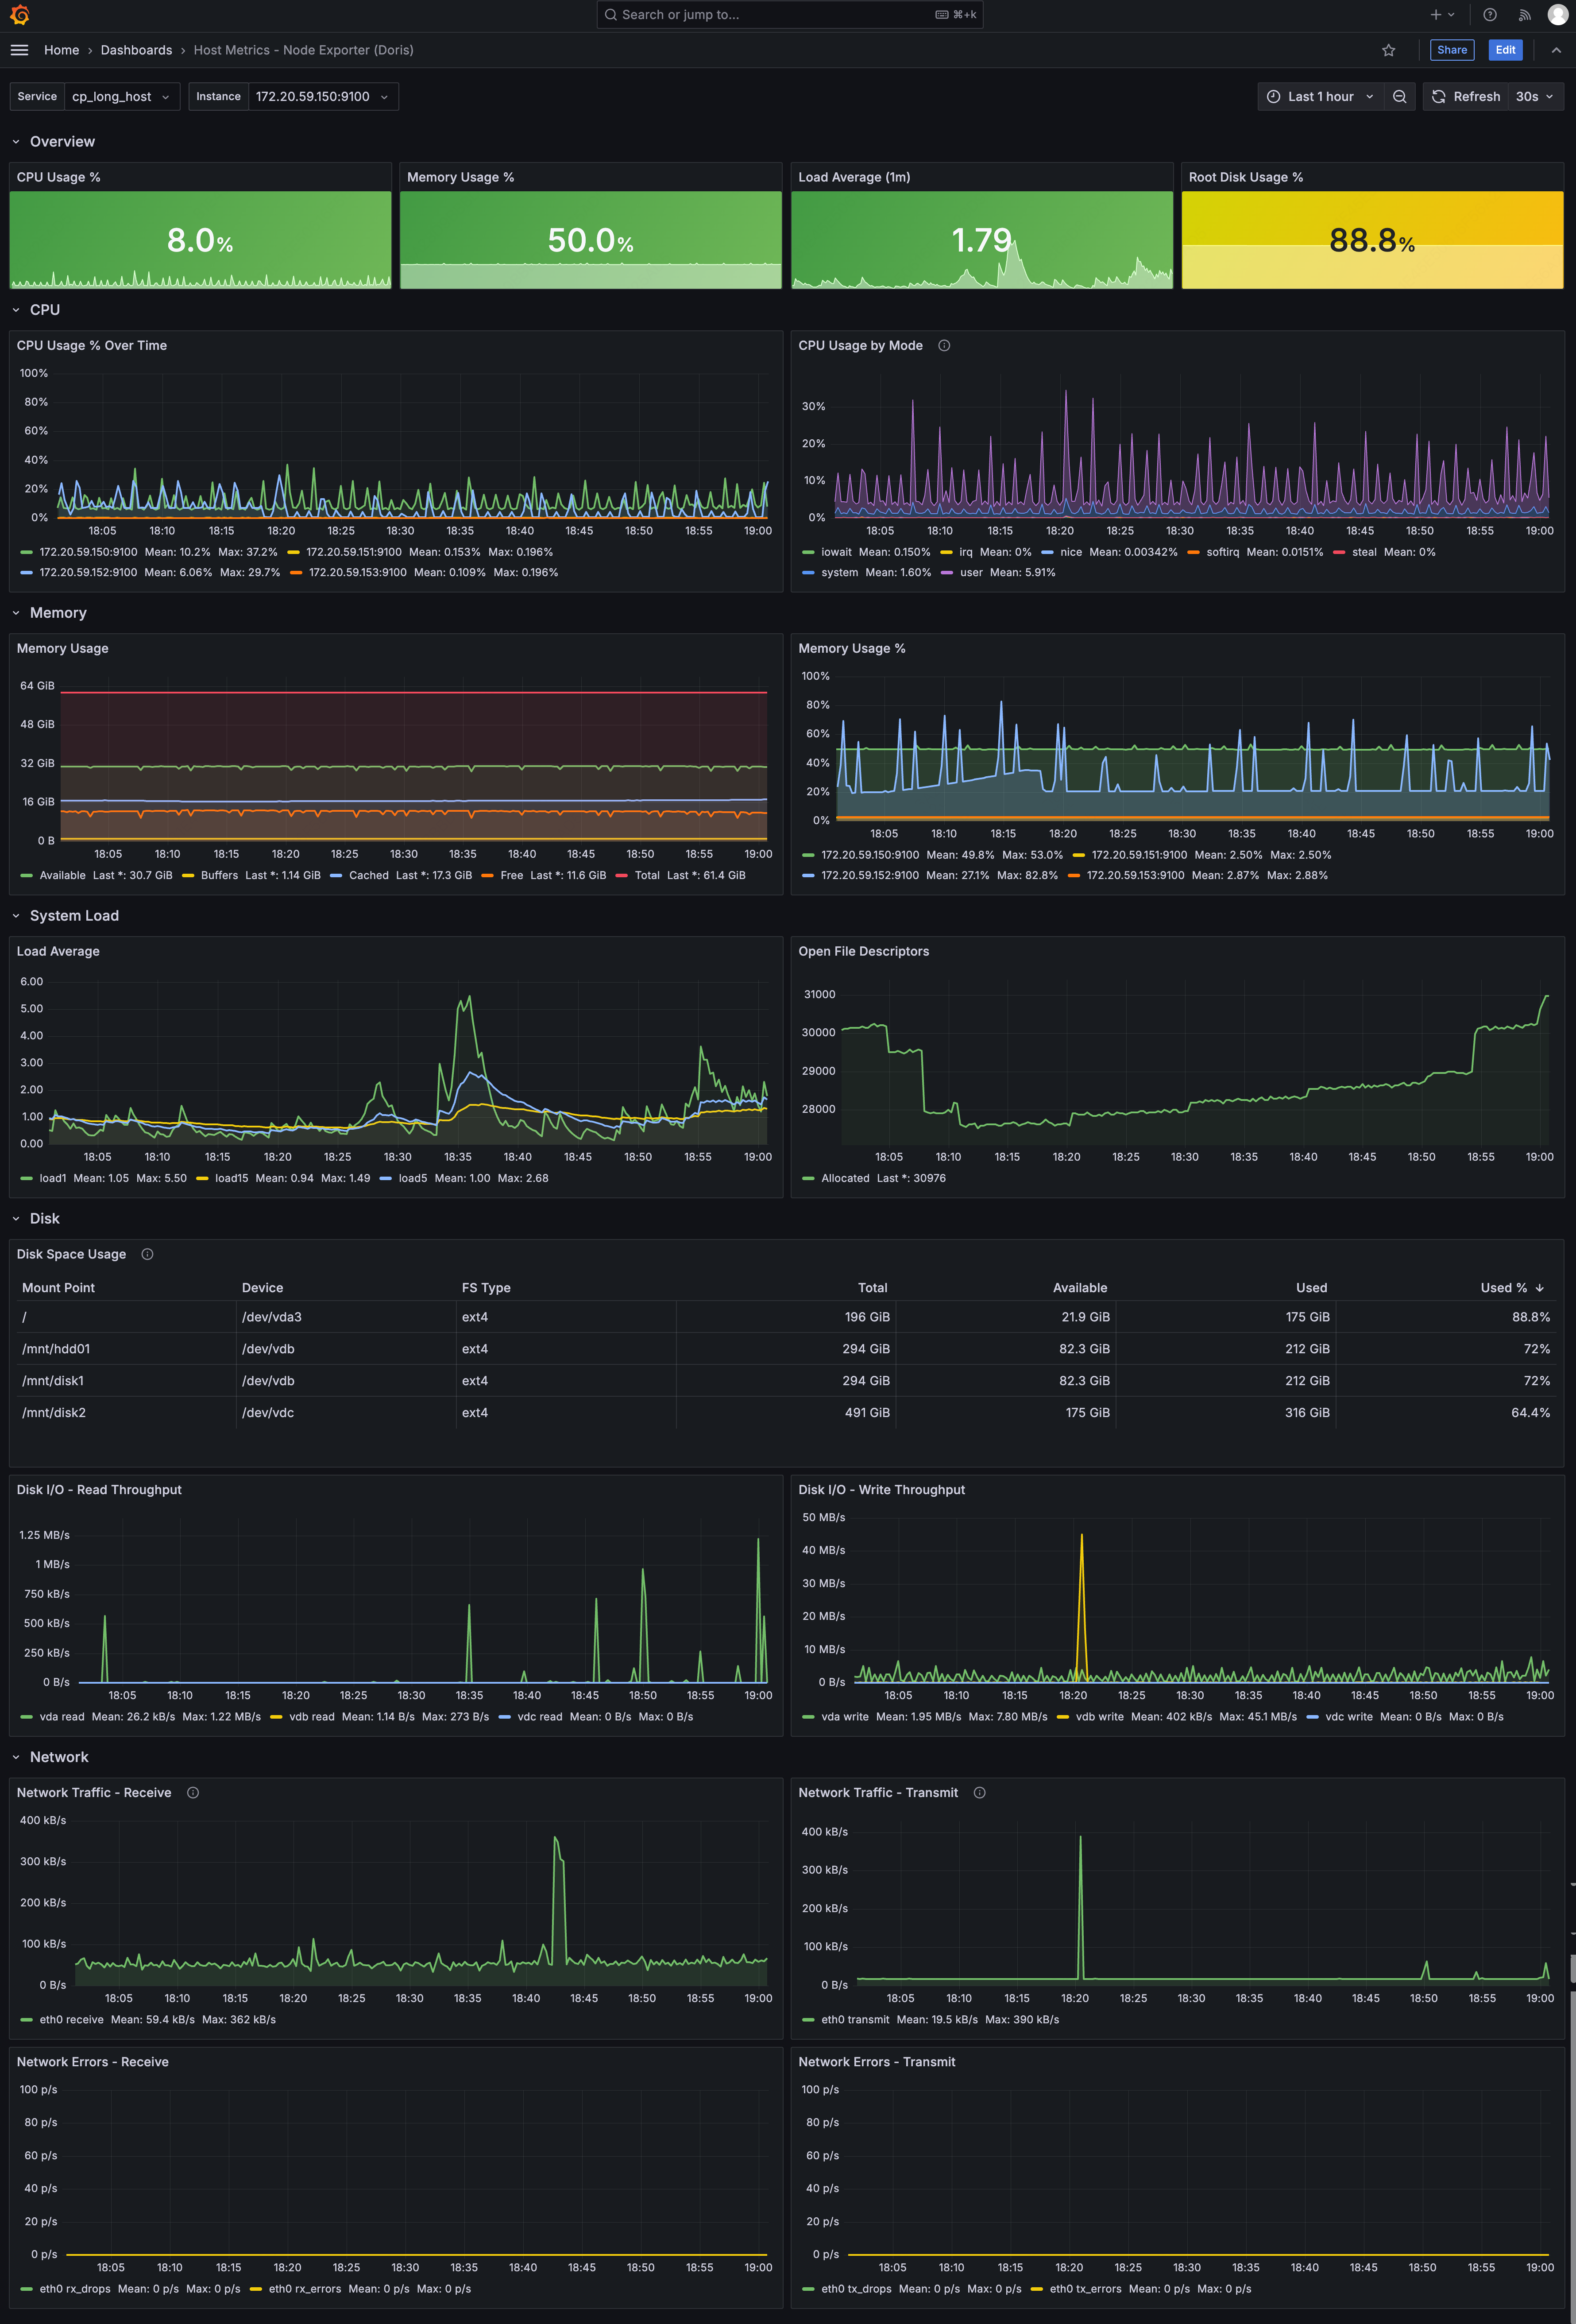
| **Host Metrics Dashboard** |
| |
| - Overview: CPU usage, memory usage, 1-minute load, root disk usage |
| - CPU: usage trend, usage by Mode |
| - Memory: memory details (Total / Available / Free / Cached / Buffers), usage trend |
| - System Load: 1 / 5 / 15-minute load, open file descriptors |
| - Disk: disk space usage table, read/write throughput |
| - Network: ingress/egress traffic, errors and packet drops |
| |
|  |
| |
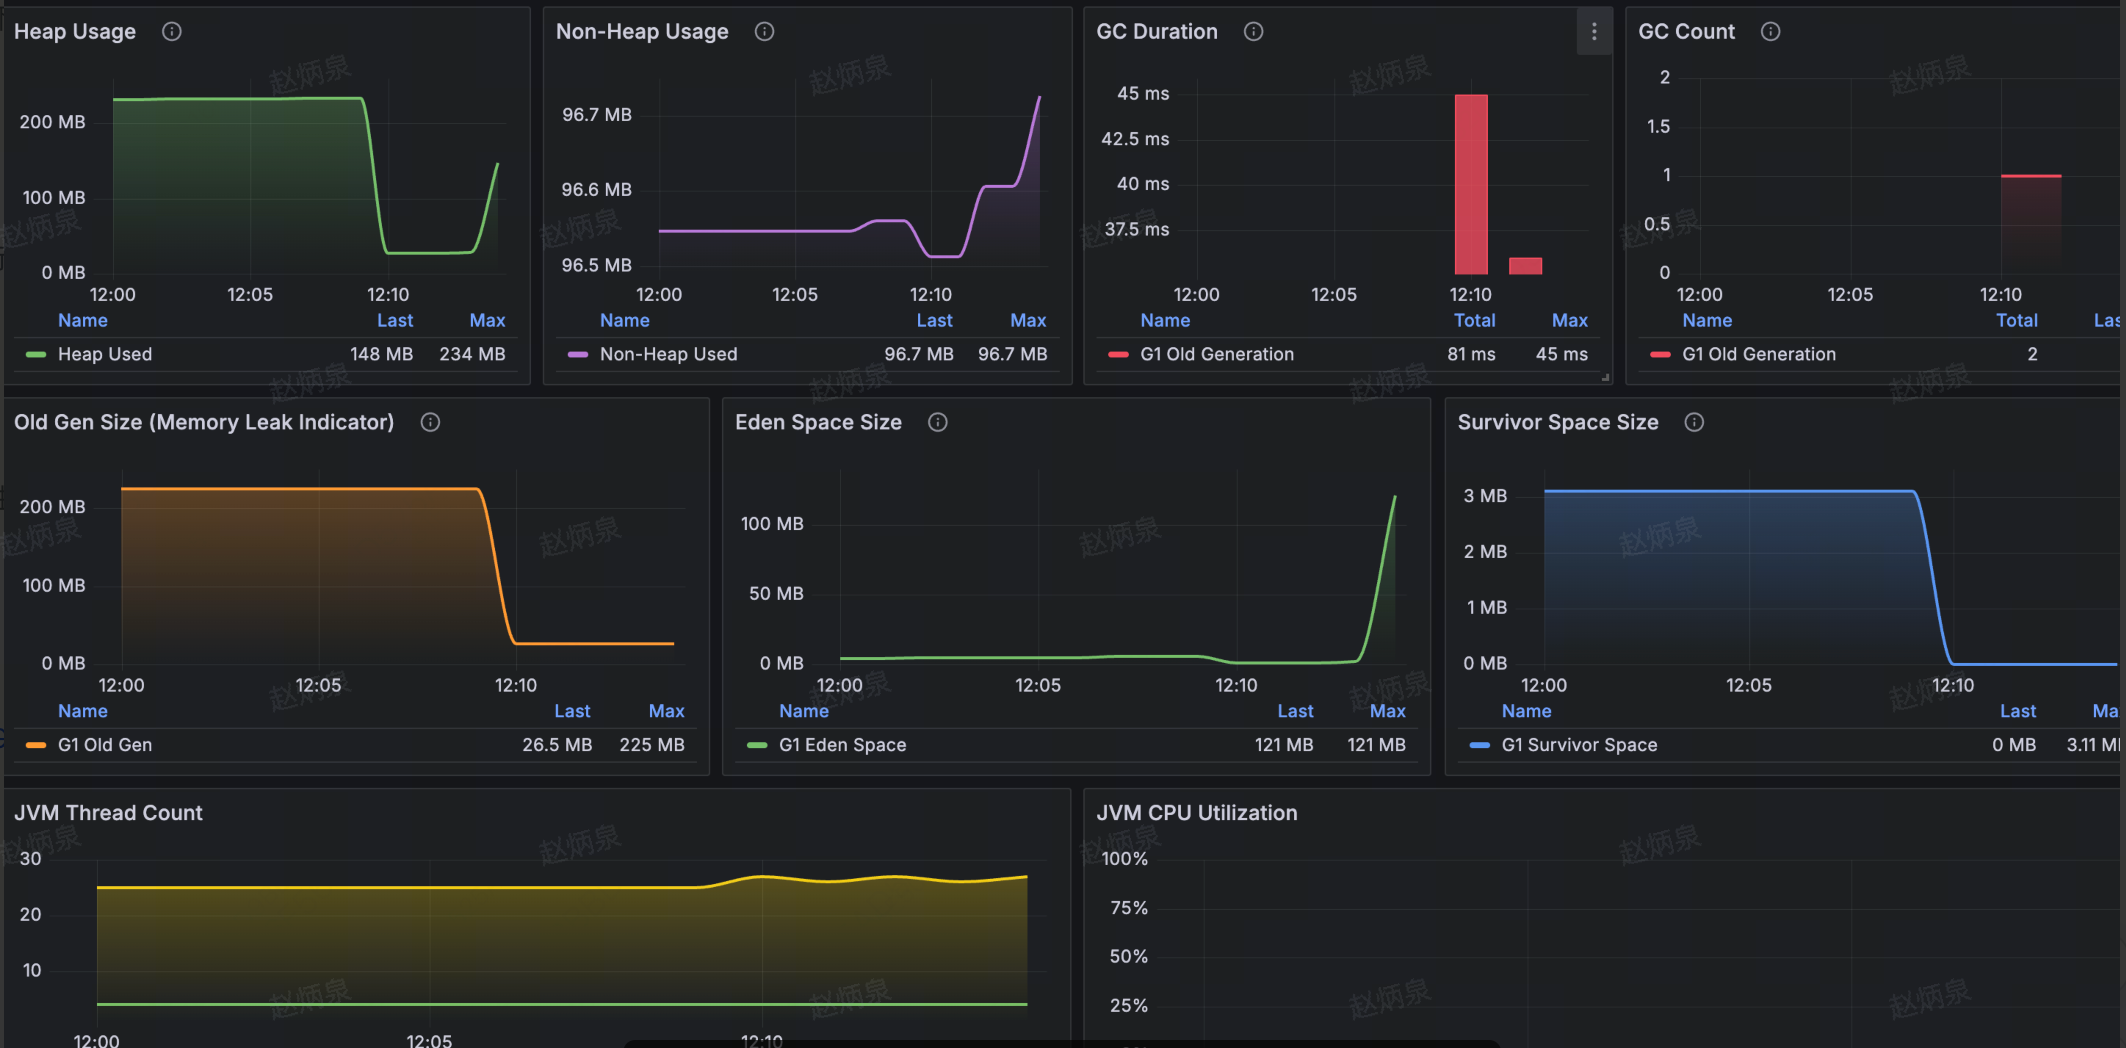
| **JVM Monitoring Dashboard** |
| |
| - Overview: heap usage, Full GC count, CPU usage, thread count |
| - Memory: heap / non-heap trends; details for Old Gen / Eden / Survivor pools |
| - GC: time (Young / Old) and counts |
| - Thread & CPU: thread count trend, CPU utilization |
| |
|  |
| |
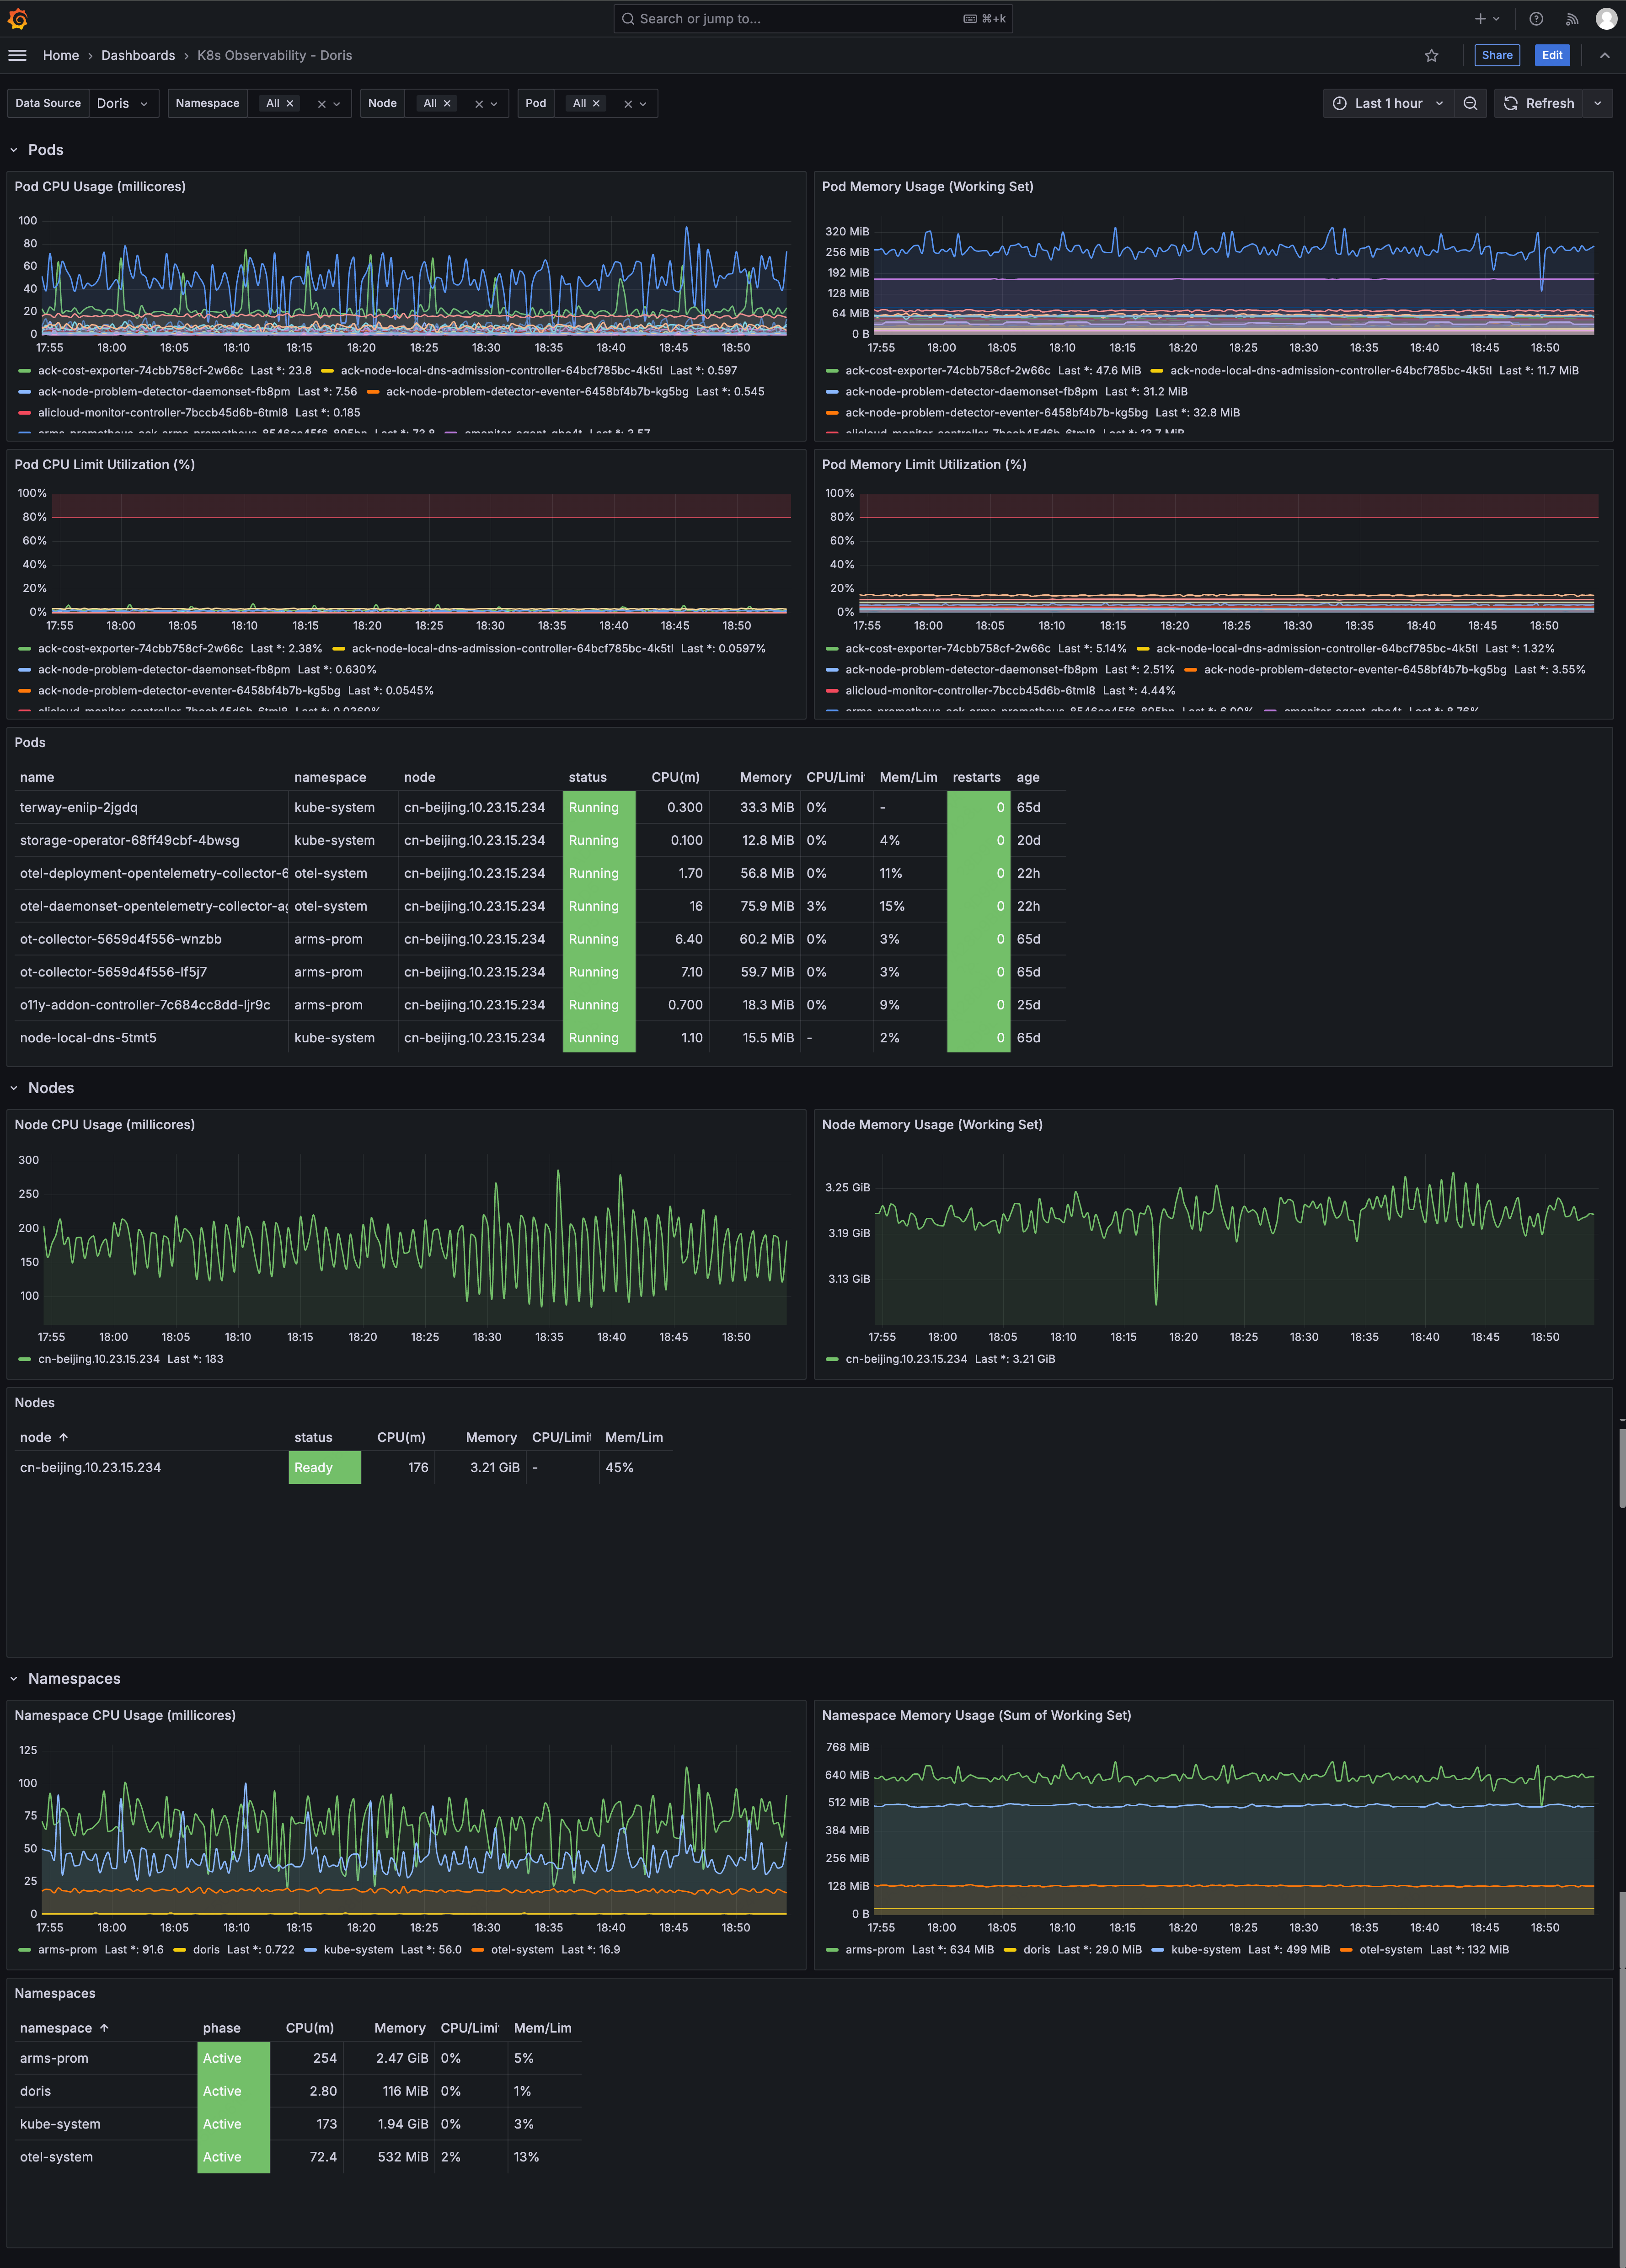
| **K8s Observability Dashboard** |
| |
| - Pods: CPU (millicores), memory, Limit utilization, status table (with restart count and uptime) |
| - Nodes: CPU / memory trends, status table |
| - Namespaces: CPU / memory aggregates, status table |
| |
|  |
| |
| **Nginx Logs Dashboard** |
| |
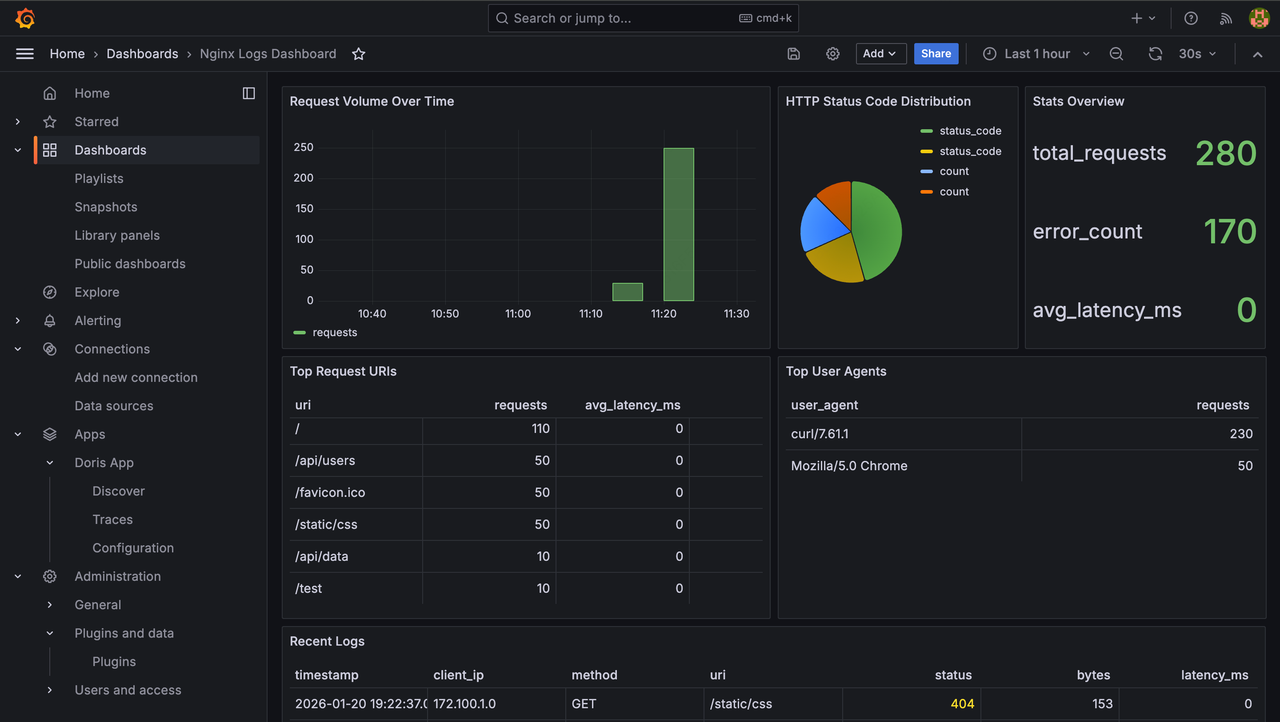
| - Overview: requests, errors, 5xx / 4xx stats, status-code pie chart |
| - Trends: request volume / error log trends |
| - Analysis: Top URL, Top IP, HTTP method distribution, top error messages |
| - Recent Logs: access / error log details |
| |
|  |
| |
| **PostgreSQL Metrics Dashboard** |
| |
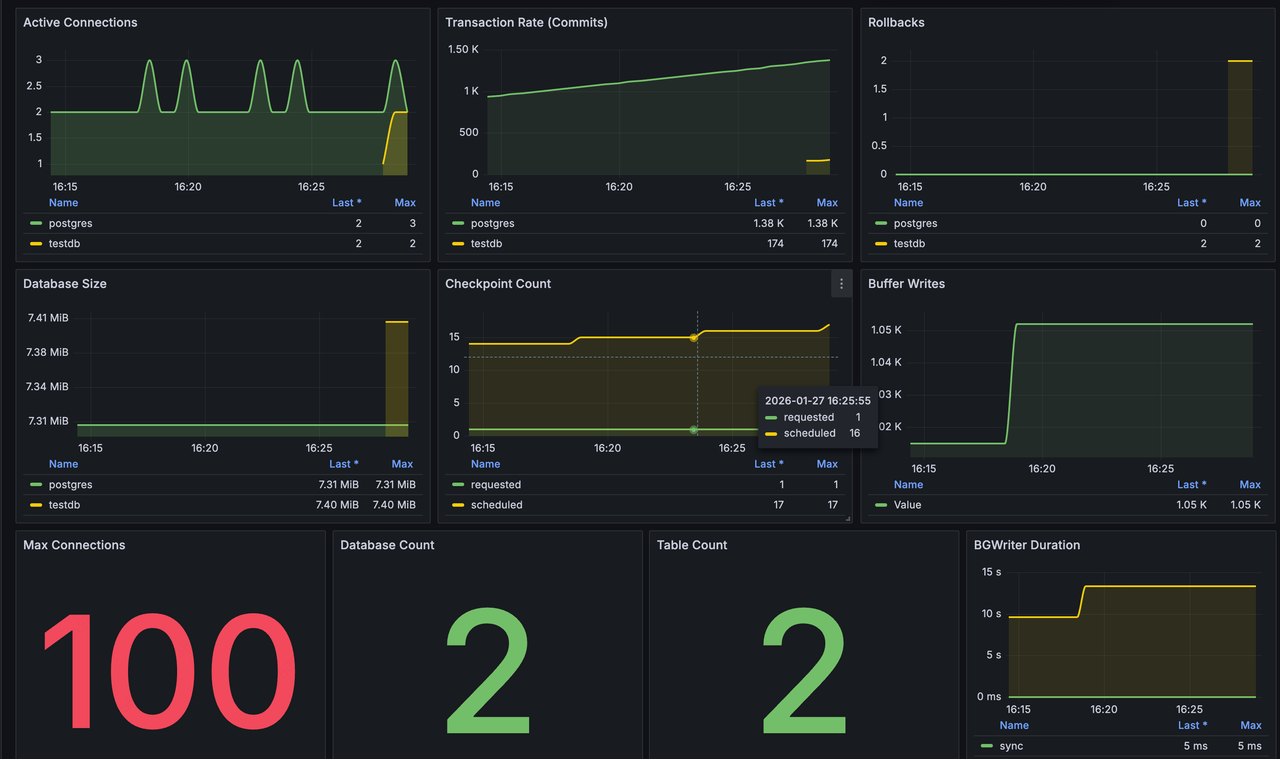
| - Connections: active connections (split by database), max connections |
| - Transactions: commit rate, rollback count |
| - Storage: database size (split by database), number of databases, number of tables |
| - BGWriter: checkpoint count (scheduled / requested), buffer writes, BGWriter time |
| |
|  |
| |
| |
| |
| ## **Understanding the data model** |
| |
| Before creating a custom dashboard, you need to know how OTel data is stored in Doris. |
| |
| ### **Tables** |
| |
| Unlike Prometheus, in Doris you cannot query by metric name alone — you also need to know which table to query. OTel data is stored across multiple tables by signal type and metric type: |
| |
| | Table | Content | Value field | Query approach | |
| | ------------------------ | -------------------- | ------------------------------- | ------------------------------------ | |
| | `otel_metrics_gauge` | Instantaneous metrics| `value` | Aggregate directly, e.g. `AVG(value)`| |
| | `otel_metrics_sum` | Cumulative counters | `value` (monotonically increasing) | Compute rate with `LAG()` | |
| | `otel_metrics_histogram` | Histogram | `count`, `sum`, `bucket_counts` | Compute deltas with `LAG()` | |
| | `otel_logs` | Logs | `body`, `severity_text` | `COUNT` aggregation or detail queries| |
| | `otel_traces` | Traces | `duration`, `span_name` | Sort or aggregate by duration | |
| |
| To determine which table holds a given metric, run: |
| |
| ```SQL |
| SELECT 'gauge' AS type, metric_name FROM otel.otel_metrics_gauge WHERE metric_name = 'your_metric_name' LIMIT 1 |
| UNION ALL |
| SELECT 'sum', metric_name FROM otel.otel_metrics_sum WHERE metric_name = 'your_metric_name' LIMIT 1 |
| UNION ALL |
| SELECT 'histogram', metric_name FROM otel.otel_metrics_histogram WHERE metric_name = 'your_metric_name' LIMIT 1; |
| ``` |
| |
| To browse all available metrics, run the following on each table: |
| |
| ```SQL |
| SELECT DISTINCT metric_name FROM otel.otel_metrics_gauge ORDER BY metric_name; |
| ``` |
| |
| ### **Attribute fields** |
| |
| In Prometheus, all labels are accessed uniformly as `{key="value"}`. In Doris, attributes are spread across several `variant` (JSON) columns and accessed with bracket syntax: |
| |
| | Table | Field | Content | Example | |
| | ------------ | --------------------- | ------------------------------------ | ------------------------------------ | |
| | metrics | `attributes` | Metric dimensions (Prometheus labels)| `attributes['mode']` | |
| | metrics | `resource_attributes` | Resource info (K8s pod/node, etc.) | `resource_attributes['k8s.pod.name']`| |
| | logs | `log_attributes` | Log fields | `log_attributes['status']` | |
| | traces | `span_attributes` | Span fields | `span_attributes['http.method']` | |
| |
| Note: `service_name` and `service_instance_id` are top-level columns, not part of `attributes`. Use them directly, e.g. `WHERE service_name = '...'`. |
| |
| When using `SELECT`, `GROUP BY`, `PARTITION BY`, or `LIKE`, you need to use `CAST` for type conversion: |
| |
| ```SQL |
| -- Extract a value in SELECT |
| CAST(attributes['device'] AS VARCHAR) AS device |
| |
| -- Pattern match in WHERE |
| CAST(attributes['device'] AS VARCHAR) NOT LIKE 'veth%' |
| |
| -- Numeric comparison in WHERE |
| CAST(log_attributes['status'] AS INT) >= 500 |
| |
| -- Use in GROUP BY |
| GROUP BY CAST(resource_attributes['k8s.pod.name'] AS VARCHAR) |
| ``` |
| |
| For simple equality comparisons in `WHERE`, `CAST` is usually unnecessary: |
| |
| ```SQL |
| WHERE attributes['mode'] = 'idle' |
| ``` |
| |
| Caution: Using a wrong attribute field name (for example, `log_attributes` on a metrics table) does not raise an error — it silently returns NULL, causing empty query results. |
| |
| ### **Counter metrics and rate calculation** |
| |
| For Gauge metrics, `value` directly represents the current value and can be aggregated with `AVG` or `MAX`. |
| |
| For Counter / Sum metrics, `value` is a monotonically increasing cumulative value (such as total CPU seconds or total network bytes). To get the rate, you need the delta between adjacent data points. Prometheus's `rate()` is implemented in Doris with the `LAG()` window function. |
| |
| Here is a generic rate template: |
| |
| ```SQL |
| SELECT |
| t.timestamp AS time, |
| t.<dimension_field> AS metric, |
| CASE |
| WHEN UNIX_TIMESTAMP(t.timestamp) > UNIX_TIMESTAMP(t.prev_ts) |
| AND t.value >= t.prev_value |
| THEN (t.value - t.prev_value) / (UNIX_TIMESTAMP(t.timestamp) - UNIX_TIMESTAMP(t.prev_ts)) |
| ELSE NULL |
| END AS value |
| FROM ( |
| SELECT timestamp, value, <dimension_field>, |
| LAG(value) OVER (PARTITION BY <dimension_field> ORDER BY timestamp) AS prev_value, |
| LAG(timestamp) OVER (PARTITION BY <dimension_field> ORDER BY timestamp) AS prev_ts |
| FROM otel.otel_metrics_sum |
| WHERE metric_name = '<metric_name>' |
| AND $__timeFilter(timestamp) |
| ) t |
| WHERE t.prev_ts IS NOT NULL |
| ORDER BY time |
| ``` |
| |
| To use this template, replace the following placeholders: |
| |
| - `<dimension_field>`: the field that splits the series, e.g. `CAST(attributes['device'] AS VARCHAR)`. |
| - `<metric_name>`: the metric name, e.g. `node_network_receive_bytes_total`. |
| |
| The template includes three layers of safety: |
| |
| | Condition | Purpose | |
| | --------------------------------------------------------- | ------------------------------------------------------ | |
| | `WHERE t.prev_ts IS NOT NULL` | Skips the first row of each partition (`LAG` returns NULL) | |
| | `UNIX_TIMESTAMP(t.timestamp) > UNIX_TIMESTAMP(t.prev_ts)` | Prevents divide-by-zero from duplicate timestamps | |
| | `t.value >= t.prev_value` | Prevents negative deltas caused by counter resets | |
| |
| The choice of `PARTITION BY` directly determines whether the rate is correct. Choosing wrong causes data from different dimensions to be mixed. Here are the choices used in the prebuilt dashboards: |
| |
| | Scenario | PARTITION BY | |
| | --------------------------------- | --------------------------------------------------------- | |
| | CPU usage (multi-core aggregation)| `service_instance_id, CAST(attributes['cpu'] AS VARCHAR)` | |
| | Disk I/O | `CAST(attributes['device'] AS VARCHAR)` | |
| | Network traffic | `CAST(attributes['device'] AS VARCHAR)` | |
| | GC time | `CAST(attributes['jvm.gc.name'] AS VARCHAR)` | |
| |
| |
| |
| ## **Creating a custom dashboard** |
| |
| This section walks through, in practice, creating a dashboard with multiple panels and variables from scratch. |
| |
| ### **Create a Dashboard and a Time Series panel** |
| |
| We will create a Time Series panel that shows the CPU usage trend of a K8s pod. This example uses a Gauge metric and shows the complete thought process of writing the SQL. |
| |
| 1. In Grafana's left-side menu, click **Dashboards** > **New** > **New dashboard**. |
| 2. Click **Add visualization**. |
| |
| 1. From the data source dropdown, choose your configured MySQL (Doris) data source. |
| 2. In the top-right of the query editor, switch to **Code** mode. |
| |
| Now we write the SQL query. The following builds it up step by step. |
| |
| **Write the base query.** The goal is to monitor pod CPU; the metric name is `k8s.pod.cpu.usage`. It is a Gauge metric stored in `otel_metrics_gauge`, where `value` can be aggregated directly: |
| |
| ```SQL |
| SELECT timestamp, value |
| FROM otel.otel_metrics_gauge |
| WHERE metric_name = 'k8s.pod.cpu.usage' |
| ``` |
| |
| **Add time filtering.** Grafana's MySQL data source provides two ways to filter on time: |
| |
| ```SQL |
| -- Option A: use the $__timeFilter macro (recommended) |
| WHERE metric_name = 'k8s.pod.cpu.usage' |
| AND $__timeFilter(timestamp) |
| |
| -- Option B: use $__from and $__to (more flexible inside subqueries or JOINs) |
| WHERE metric_name = 'k8s.pod.cpu.usage' |
| AND timestamp >= FROM_UNIXTIME($__from/1000) |
| AND timestamp < FROM_UNIXTIME($__to/1000) |
| ``` |
| |
| Note: `$__from` and `$__to` are millisecond timestamps — divide by 1000 before using them in `FROM_UNIXTIME()`. |
| |
| **Add time bucketing.** Raw data points are too dense; aggregate them at a fixed interval. Use `FLOOR(UNIX_TIMESTAMP(timestamp) / N) * N` to round time to N-second buckets: |
| |
| ```SQL |
| SELECT |
| FLOOR(UNIX_TIMESTAMP(timestamp) / 20) * 20 AS time, |
| AVG(value) AS value |
| FROM otel.otel_metrics_gauge |
| WHERE metric_name = 'k8s.pod.cpu.usage' |
| AND timestamp >= FROM_UNIXTIME($__from/1000) |
| AND timestamp < FROM_UNIXTIME($__to/1000) |
| GROUP BY time |
| ORDER BY time |
| ``` |
| |
| **Split into multiple series by dimension.** For the Time Series format, Grafana's MySQL data source requires three columns: |
| |
| | Column | Purpose | |
| | ----------------- | ---------------------------------------------------------------------- | |
| | `time` or `time_sec` | X-axis time. Either a `datetime` value or a UNIX timestamp in seconds. | |
| | `metric` | Series name. Grafana splits into multiple lines by distinct values of this column. | |
| | `value` | Y-axis value. | |
| |
| Add the pod name as the `metric` column for the complete query: |
| |
| ```SQL |
| SELECT |
| FLOOR(UNIX_TIMESTAMP(timestamp) / 20) * 20 AS time, |
| CAST(resource_attributes['k8s.pod.name'] AS VARCHAR) AS metric, |
| AVG(value) AS value |
| FROM otel.otel_metrics_gauge |
| WHERE metric_name = 'k8s.pod.cpu.usage' |
| AND timestamp >= FROM_UNIXTIME($__from/1000) |
| AND timestamp < FROM_UNIXTIME($__to/1000) |
| GROUP BY time, metric |
| ORDER BY time |
| ``` |
| |
| To monitor a different Gauge metric, change: |
| |
| - `metric_name`: the target metric name. |
| - The `metric` column: the dimension used to split series, chosen from `attributes` or `resource_attributes`. |
| |
| 1. Paste the complete SQL into the query editor. |
| 2. Below the editor, set **Format** to **Time series**. |
| |
| 1. Click the panel title to set a name. |
| 2. In the right-side panel settings, find **Standard options** > **Unit** and choose an appropriate unit. |
| 3. Click **Apply** at the top right. |
| |
| ### **Add a Counter metric panel** |
| |
| This section creates a Time Series panel showing the rate of a Counter metric. A Counter's `value` is a monotonically increasing cumulative value — use the [generic rate template](#counter-metrics-and-rate-calculation) to compute the rate. |
| |
| 1. On the dashboard, click **Add** > **Visualization**. |
| 2. Choose the data source and switch to **Code** mode. |
| |
| Replace the placeholders in the rate template with concrete values. The example below computes the network receive byte rate, split by network device: |
| |
| ```SQL |
| SELECT |
| t.timestamp AS time, |
| t.device AS metric, |
| CASE |
| WHEN UNIX_TIMESTAMP(t.timestamp) > UNIX_TIMESTAMP(t.prev_ts) |
| AND t.value >= t.prev_value |
| THEN (t.value - t.prev_value) / (UNIX_TIMESTAMP(t.timestamp) - UNIX_TIMESTAMP(t.prev_ts)) |
| ELSE NULL |
| END AS value |
| FROM ( |
| SELECT timestamp, CAST(attributes['device'] AS VARCHAR) AS device, value, |
| LAG(value) OVER (PARTITION BY CAST(attributes['device'] AS VARCHAR) ORDER BY timestamp) AS prev_value, |
| LAG(timestamp) OVER (PARTITION BY CAST(attributes['device'] AS VARCHAR) ORDER BY timestamp) AS prev_ts |
| FROM otel.otel_metrics_sum |
| WHERE metric_name = 'node_network_receive_bytes_total' |
| AND $__timeFilter(timestamp) |
| ) t |
| WHERE t.prev_ts IS NOT NULL |
| ORDER BY time |
| ``` |
| |
| To use a different Counter metric, change two things: |
| |
| - `metric_name`: the target metric name. |
| - The dimension field in `PARTITION BY` and `SELECT`: the dimension used to split that metric (such as `attributes['cpu']`, `attributes['gc_name']`, etc.). |
| - Paste the SQL and set **Format** to **Time series**. |
| - In **Standard options** > **Unit**, choose an appropriate unit. |
| - Click **Apply**. |
| |
| ### **Add a Stat panel** |
| |
| A Stat panel shows a single value, such as the current utilization or the latest count. The SQL just needs to return one value. |
| |
| 1. Click **Add** > **Visualization** and switch to **Code** mode. |
| |
| The following query gets the latest metric value within the time range: |
| |
| ```SQL |
| SELECT value |
| FROM otel.otel_metrics_gauge |
| WHERE metric_name = 'node_memory_MemAvailable_bytes' |
| AND $__timeFilter(timestamp) |
| ORDER BY timestamp DESC |
| LIMIT 1 |
| ``` |
| |
| If you need to compute on multiple metrics (such as a ratio), see "Querying multiple metrics in one SQL" in [Optimization tips](#optimization-tips). |
| |
| 2. Paste the SQL and set **Format** to **Table** (Stat panels use Table format). |
| 3. In the right-side panel settings, change the panel type to **Stat**. |
| 4. In **Standard options** > **Unit**, choose an appropriate unit. |
| 5. Click **Apply**. |
| |
| ### **Add a Table panel** |
| |
| The Table panel is suitable for multi-row, multi-column data; each column alias in the SQL becomes a column header. |
| |
| 1. Click **Add** > **Visualization** and switch to **Code** mode. |
| |
| The following query shows recent log details: |
| |
| ```SQL |
| SELECT |
| timestamp, |
| service_name, |
| severity_text, |
| body, |
| CAST(log_attributes['your_key'] AS VARCHAR) AS your_key |
| FROM otel.otel_logs |
| WHERE $__timeFilter(timestamp) |
| ORDER BY timestamp DESC |
| LIMIT 100 |
| ``` |
| |
| Replace `your_key` with the actual log attribute field name. To see the available attributes, run: |
| |
| ```SQL |
| SELECT log_attributes FROM otel.otel_logs LIMIT 1; |
| ``` |
| |
| 2. Paste the SQL and set **Format** to **Table**. |
| 3. Click **Apply**. |
| |
| ### **Add template variables** |
| |
| Template variables add interactive dropdown filters to a dashboard, letting users filter data without modifying the SQL. |
| |
| **Single-select variable:** |
| |
| 1. Click the gear icon at the top right of the dashboard, then go to **Settings** > **Variables** > **New variable**. |
| |
| 1. Fill in the configuration: |
| |
| \- **Name**: `service_name` |
| |
| \- **Type**: **Query** |
| |
| \- **Data source**: choose your Doris data source |
| |
| \- **Query**: |
| |
| `sql SELECT DISTINCT service_name FROM otel.otel_metrics_gauge WHERE service_name != '' AND service_name IS NOT NULL AND $__timeFilter(timestamp) ORDER BY service_name ` |
| |
| 1. Click **Apply**. |
| |
| In a panel's SQL, reference a single-select variable with the `$variable` syntax: |
| |
| ```SQL |
| AND service_name = '$service_name' |
| ``` |
| |
| **Multi-select variable:** |
| |
| 1. Create a new variable with the following configuration: |
| |
| \- **Name**: `namespace` |
| |
| \- **Type**: **Query** |
| |
| \- **Multi-value**: checked |
| |
| \- **Include All option**: checked |
| |
| \- **Query**: |
| |
| `sql SELECT DISTINCT CAST(resource_attributes['k8s.namespace.name'] AS VARCHAR) AS __text FROM otel.otel_metrics_gauge WHERE metric_name = 'k8s.pod.phase' AND timestamp >= NOW() - INTERVAL 1 HOUR ORDER BY 1 ` |
| |
| 1. Click **Apply**. |
| |
| Note: The column alias `__text` is a Grafana convention used to control the display text of the dropdown. |
| |
| In a panel's SQL, reference a multi-select variable with the `${variable:sqlstring}` syntax combined with `IN()`: |
| |
| ```SQL |
| AND CAST(resource_attributes['k8s.namespace.name'] AS VARCHAR) IN (${namespace:sqlstring}) |
| ``` |
| |
| Caution: Multi-select variables produce a SQL syntax error if `:sqlstring` is omitted. |
| |
| **Cascading variables:** |
| |
| The candidate values of one variable can depend on another. For example, the following Pod variable filters its candidates by the currently selected Namespace: |
| |
| ```SQL |
| SELECT DISTINCT CAST(resource_attributes['k8s.pod.name'] AS VARCHAR) AS __text |
| FROM otel.otel_metrics_gauge |
| WHERE metric_name = 'k8s.pod.phase' |
| AND timestamp >= NOW() - INTERVAL 1 HOUR |
| AND CAST(resource_attributes['k8s.namespace.name'] AS VARCHAR) IN (${namespace:sqlstring}) |
| ORDER BY 1 |
| ``` |
| |
| ### **Optimization tips** |
| |
| The following are common optimization techniques used in the prebuilt dashboards. |
| |
| **Adjust the time-bucket interval.** Choose a bucket size that matches the time range. Modify N in `FLOOR(UNIX_TIMESTAMP(timestamp) / N) * N`: |
| |
| - 20 seconds: suited to short-window real-time monitoring. |
| - 60 seconds: suited to hour-level overviews. |
| - 300 seconds: suited to day-level trends. |
| |
| **Set meaningful series names.** Use `CONCAT()` to combine multiple fields: |
| |
| ```SQL |
| CONCAT(device, ' read') AS metric |
| ``` |
| |
| Use `CASE WHEN` to map numeric values to readable text: |
| |
| ```SQL |
| CASE WHEN value = 2 THEN 'Running' |
| WHEN value = 1 THEN 'Pending' |
| WHEN value = 3 THEN 'Succeeded' |
| WHEN value = 4 THEN 'Failed' |
| ELSE 'Unknown' |
| END AS status |
| ``` |
| |
| **Handle divide-by-zero and NULLs.** Use `NULLIF` to guard against divide-by-zero and `COALESCE` to provide default values: |
| |
| ```SQL |
| / NULLIF(SUM(...), 0) |
| COALESCE(restarts, 0) |
| ``` |
| |
| **Query multiple metrics in one SQL.** Use `CASE WHEN metric_name` instead of JOIN: |
| |
| ```SQL |
| SELECT timestamp AS time, |
| SUM(CASE WHEN metric_name = 'node_memory_MemAvailable_bytes' THEN value END) AS available, |
| SUM(CASE WHEN metric_name = 'node_memory_MemTotal_bytes' THEN value END) AS total |
| FROM otel.otel_metrics_gauge |
| WHERE metric_name IN ('node_memory_MemTotal_bytes', 'node_memory_MemAvailable_bytes') |
| GROUP BY timestamp |
| ``` |
| |
| **Filter out noise data.** Exclude virtual network interfaces: |
| |
| ```SQL |
| AND CAST(attributes['device'] AS VARCHAR) NOT LIKE 'veth%' |
| AND CAST(attributes['device'] AS VARCHAR) NOT LIKE 'br-%' |
| AND CAST(attributes['device'] AS VARCHAR) != 'lo' |
| ``` |
| |
| Keep only real filesystems: |
| |
| ```SQL |
| AND CAST(attributes['fstype'] AS VARCHAR) IN ('ext4', 'xfs', 'btrfs') |
| ``` |
| |
| |
| |
| ## **Reference** |
| |
| ### **OTel table schema** |
| |
| **Metrics tables (gauge / sum / histogram — shared fields)** |
| |
| | Field | Type | Description | |
| | --------------------- | -------------- | --------------------- | |
| | `service_name` | varchar(200) | Service name | |
| | `timestamp` | datetime(6) | Data timestamp | |
| | `service_instance_id` | varchar(200) | Service instance ID | |
| | `metric_name` | varchar(200) | Metric name | |
| | `metric_description` | text | Metric description | |
| | `metric_unit` | text | Metric unit | |
| | `attributes` | variant (JSON) | Metric dimensions | |
| | `resource_attributes` | variant (JSON) | Resource attributes | |
| | `scope_name` | text | Collector name | |
| |
| gauge-only field: `value` (double) |
| |
| sum extra fields: `value` (double), `aggregation_temporality` (text), `is_monotonic` (boolean) |
| |
| histogram extra fields: `count` (bigint), `sum` (double), `bucket_counts` (array\<bigint\>), `explicit_bounds` (array\<double\>), `min` (double), `max` (double) |
| |
| **Logs table** |
| |
| | Field | Type | Description | |
| | --------------------- | -------------- | --------------------------------- | |
| | `timestamp` | datetime(6) | Log timestamp | |
| | `service_name` | varchar(200) | Service name | |
| | `service_instance_id` | varchar(200) | Service instance ID | |
| | `trace_id` | varchar(200) | Associated trace ID | |
| | `span_id` | text | Associated span ID | |
| | `severity_number` | int | Severity number | |
| | `severity_text` | text | Severity text (INFO / WARN / ERROR) | |
| | `body` | text | Log body | |
| | `resource_attributes` | variant (JSON) | Resource attributes | |
| | `log_attributes` | variant (JSON) | Log attributes | |
| |
| **Traces table** |
| |
| | Field | Type | Description | |
| | --------------------- | -------------- | ------------------------------------------ | |
| | `timestamp` | datetime(6) | Span start time | |
| | `service_name` | varchar(200) | Service name | |
| | `trace_id` | varchar(200) | Trace ID | |
| | `span_id` | text | Span ID | |
| | `parent_span_id` | text | Parent span ID | |
| | `span_name` | text | Span name | |
| | `span_kind` | text | Span kind (CLIENT / SERVER / INTERNAL) | |
| | `end_time` | datetime(6) | Span end time | |
| | `duration` | bigint | Duration (nanoseconds) | |
| | `span_attributes` | variant (JSON) | Span attributes | |
| | `events` | array | Span events | |
| | `links` | array | Span links | |
| | `status_code` | text | Status code (OK / ERROR / UNSET) | |
| | `status_message` | text | Status message | |
| | `resource_attributes` | variant (JSON) | Resource attributes | |
| |
| |
| |
| ### **Syntax cheat sheet** |
| |
| | Purpose | Syntax | |
| | -------------------------------- | ------------------------------------------------------------ | |
| | Time filter (macro) | `$__timeFilter(timestamp)` | |
| | Time filter (manual) | `timestamp >= FROM_UNIXTIME($__from/1000)` | |
| | Time bucket (20 seconds) | `FLOOR(UNIX_TIMESTAMP(timestamp) / 20) * 20 AS time` | |
| | Time bucket (1 minute) | `UNIX_TIMESTAMP(DATE_FORMAT(timestamp, '%Y-%m-%d %H:%i:00')) * 1000 AS time` | |
| | Attribute access | `attributes['key']` | |
| | Attribute CAST | `CAST(attributes['key'] AS VARCHAR)` | |
| | Single-select variable | `service_name = '$service_name'` | |
| | Multi-select variable | `IN (${namespace:sqlstring})` | |
| | Divide-by-zero guard | `/ NULLIF(..., 0)` | |
| | Default value | `COALESCE(..., 0)` | |
| | Series naming | `CONCAT(device, ' read') AS metric` | |
| | Status mapping | `CASE WHEN value = 2 THEN 'Running' ... END` | |
| | URL stripping query string | `SUBSTRING_INDEX(url, '?', 1)` | |
| | Filter out virtual network cards | `NOT LIKE 'veth%'` + `NOT LIKE 'br-%'` + `!= 'lo'` | |
