| --- |
| { |
| "title": "Alerting and Notification", |
| "sidebar_label": "Alert", |
| "language": "en-US", |
| "description": "How to create alerts in DOG Stack based on Apache Doris SQL? This article covers Grafana Alerting rule creation, alert conditions, labels, contact points, and alert management.", |
| "keywords": [ |
| "Grafana Alerting", |
| "Doris alerting", |
| "alert rule", |
| "alert notification", |
| "alert condition", |
| "Webhook", |
| "Slack alert", |
| "email alert" |
| ] |
| } |
| --- |
| |
| <!-- Knowledge type: operational steps --> |
| <!-- Applicable scenario: observability platform / alert rule configuration and management --> |
| |
| Because DOG Stack integrates Grafana, you can create and manage alerts directly in Grafana. This article introduces the most common alerting operations; for more advanced features, refer to the [Grafana Alerting documentation](https://grafana.com/docs/grafana/latest/alerting/). |
| |
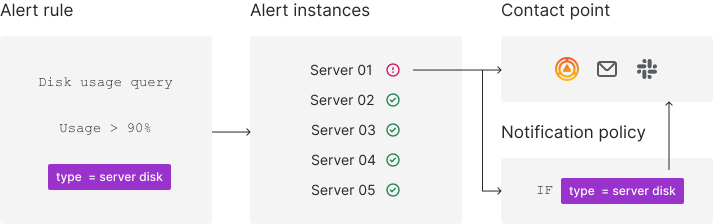
| As shown in the figure, the core mechanism of Grafana Alert is: |
| |
| 1. The user defines alert rules, including the underlying query and the trigger condition. |
| 2. The system periodically runs the rule's query and evaluates the trigger condition. |
| 3. If the trigger condition is met, an alert instance is generated. |
| 4. The alert is then dispatched — directly to a contact point or routed flexibly through notification policies. |
| |
|  |
| |
| |
| |
| A typical alert-rule creation and management flow looks like this: |
| |
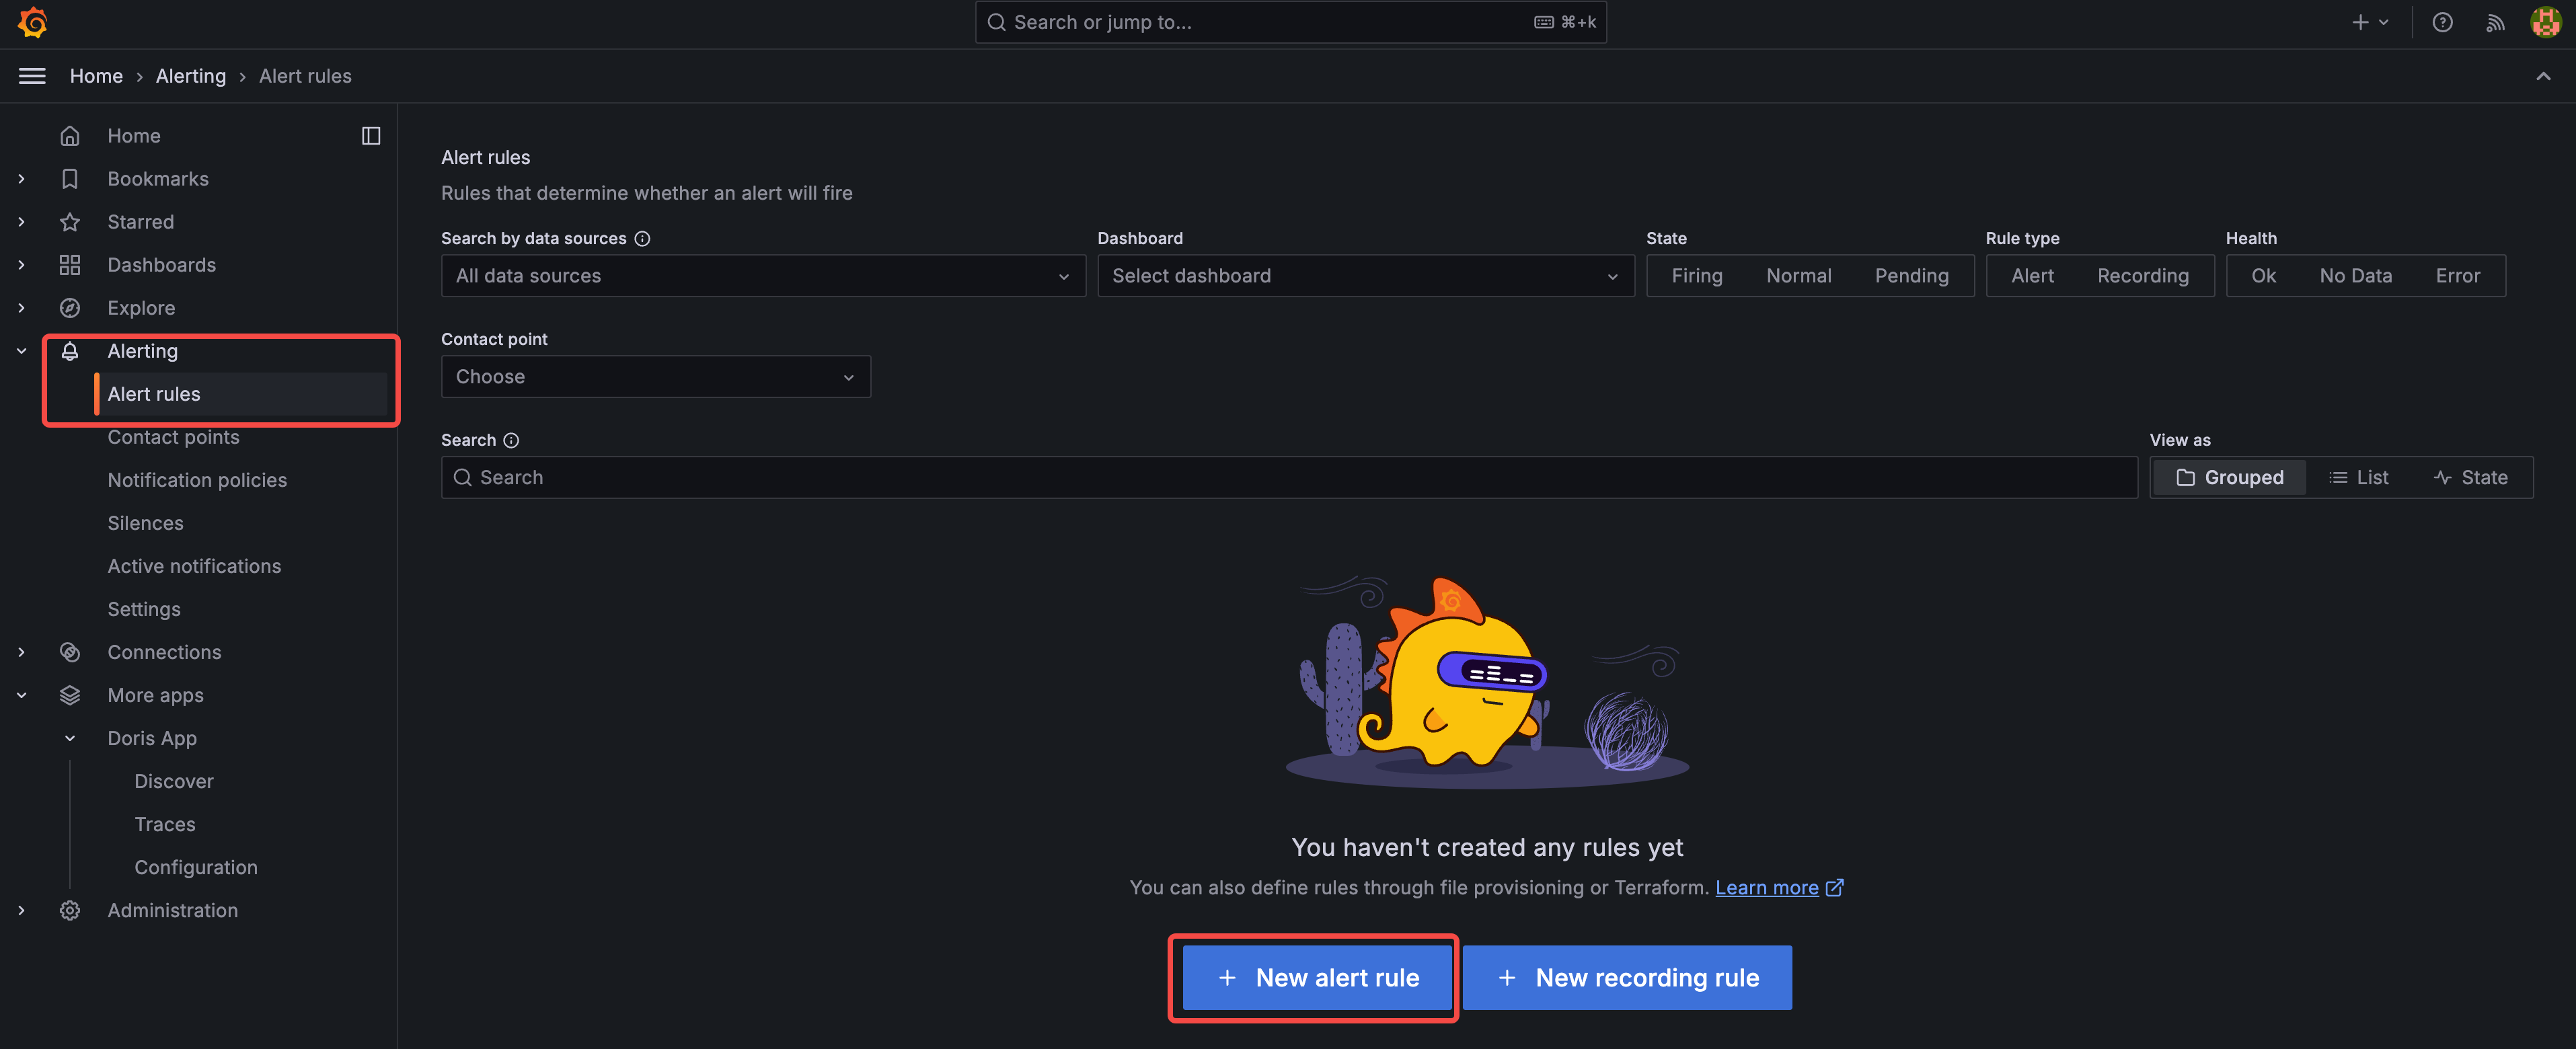
| **1. Open Grafana Alerting → Alert rules, and click "Create alert"** |
| |
|  |
| |
| |
| |
| **2. Define the query and the trigger condition** |
| |
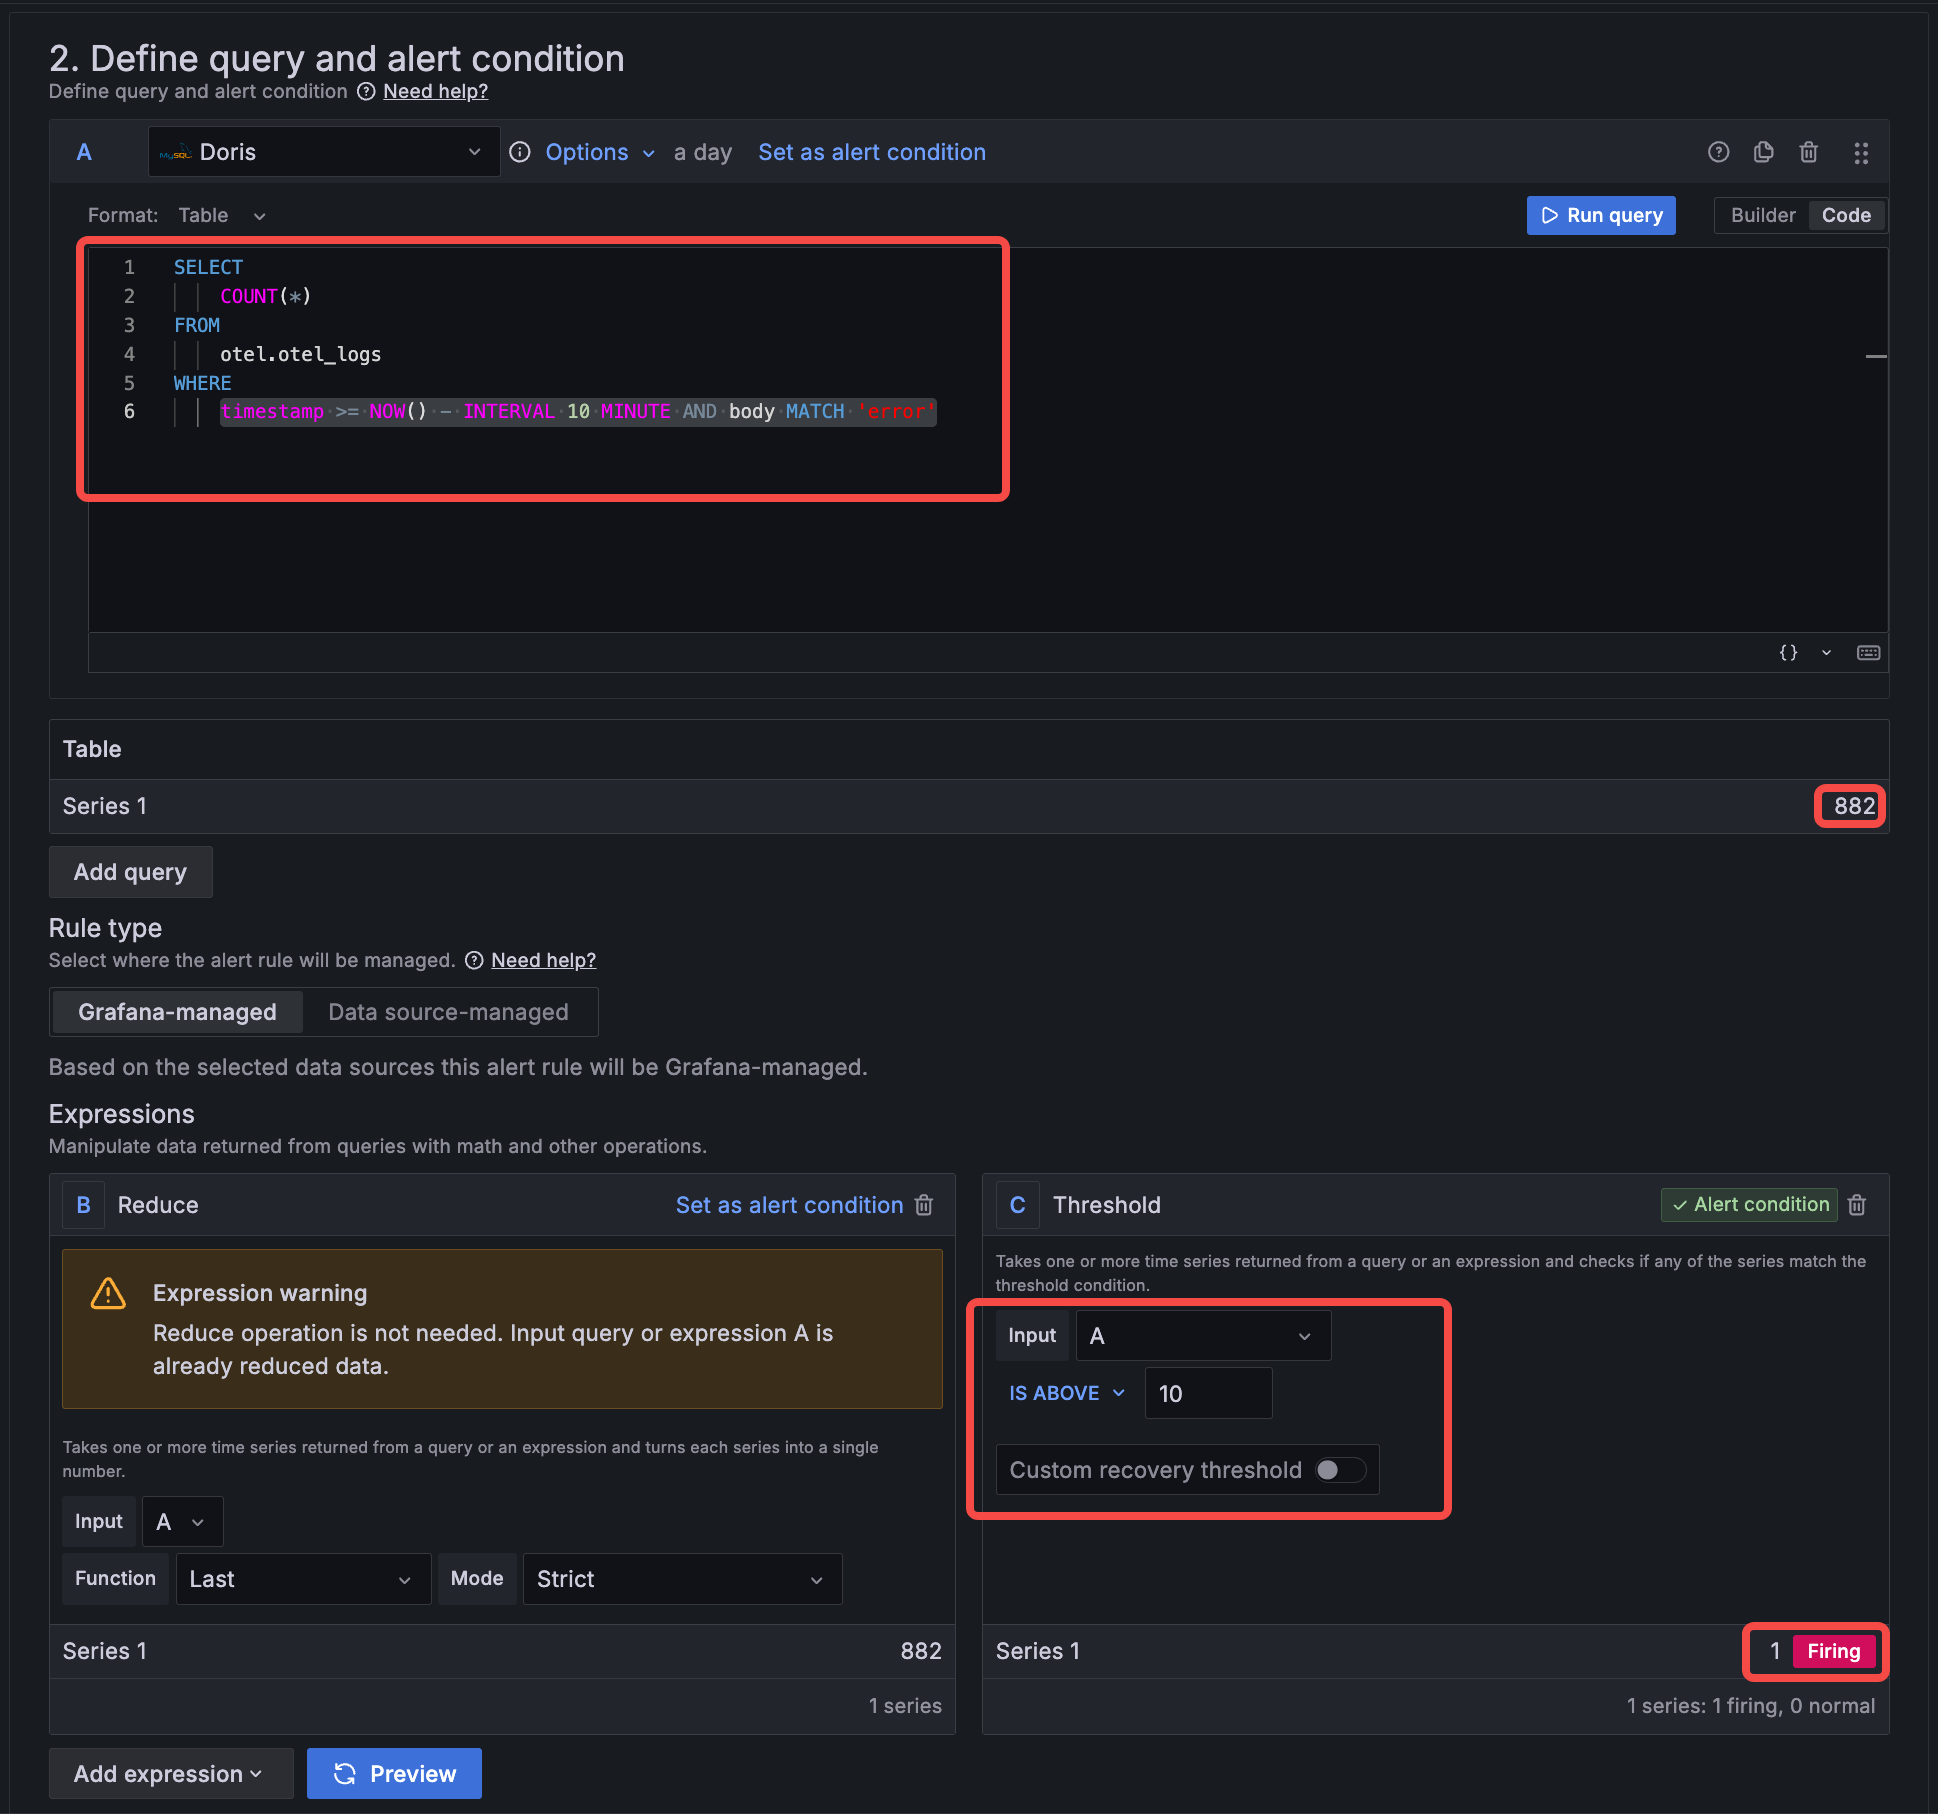
| First choose a data source such as Doris. In **Builder** mode you can build a simple query by clicking through a visual interface; in **Code** mode you can write SQL for more complex queries. In this example, **Code** mode is used to query the number of rows in `otel.otel_logs` over the last 10 minutes whose `body` field matches the keyword `error`. |
| |
| Next, in the **Expression** section, choose how to further aggregate the query result (optional) and set the threshold that triggers the alert. In this example the threshold is set to "result > 10", and no additional aggregation is applied. |
| |
| Finally, click **Preview** to preview the query result and whether the alert would fire. Here the query returns 882, which exceeds the threshold of 10, so it shows the status **1 Firing**. |
| |
| For more details, see the [Grafana docs](https://grafana.com/docs/grafana/latest/alerting/alerting-rules/create-grafana-managed-rule/). |
| |
|  |
| |
| |
| |
| **3. Configure the evaluation interval and organization** |
| |
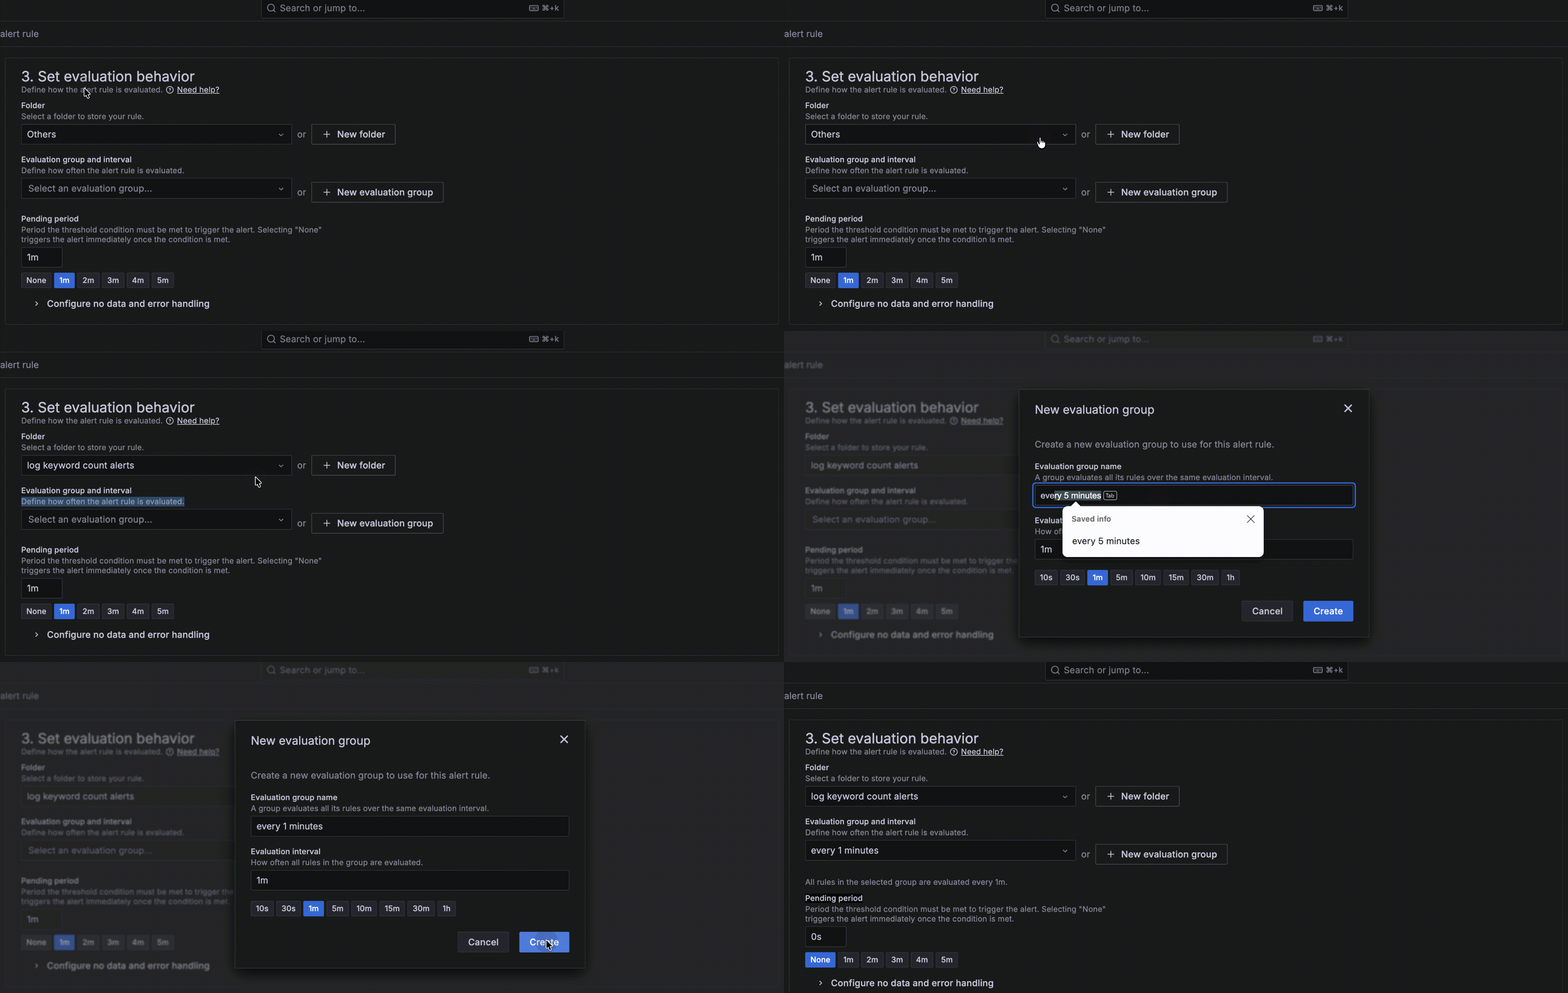
| First choose a folder to organize alerts, then set the alert's evaluation interval, and finally choose the Pending duration. The example creates an evaluation group that runs every minute and chooses Pending = None — meaning the alert moves to **Firing** state immediately when the condition is met, rather than after persisting for some time (e.g. 1 minute). |
| |
| For more details, see the [Grafana docs](https://grafana.com/docs/grafana/latest/alerting/fundamentals/alert-rule-evaluation/). |
| |
|  |
| |
| |
| |
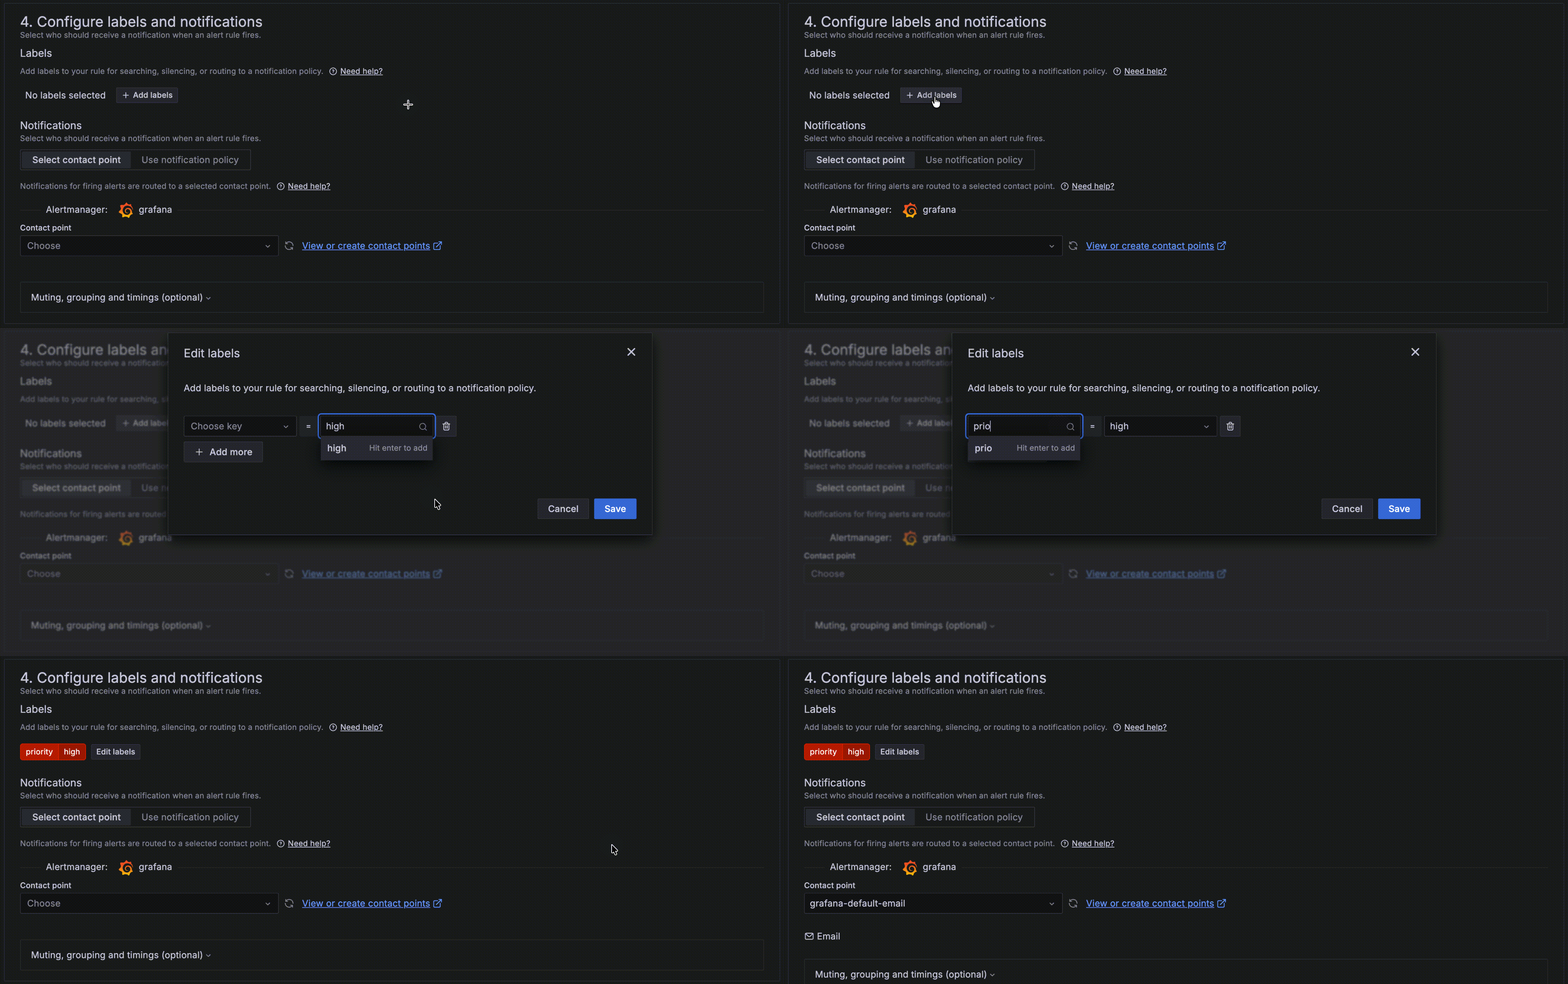
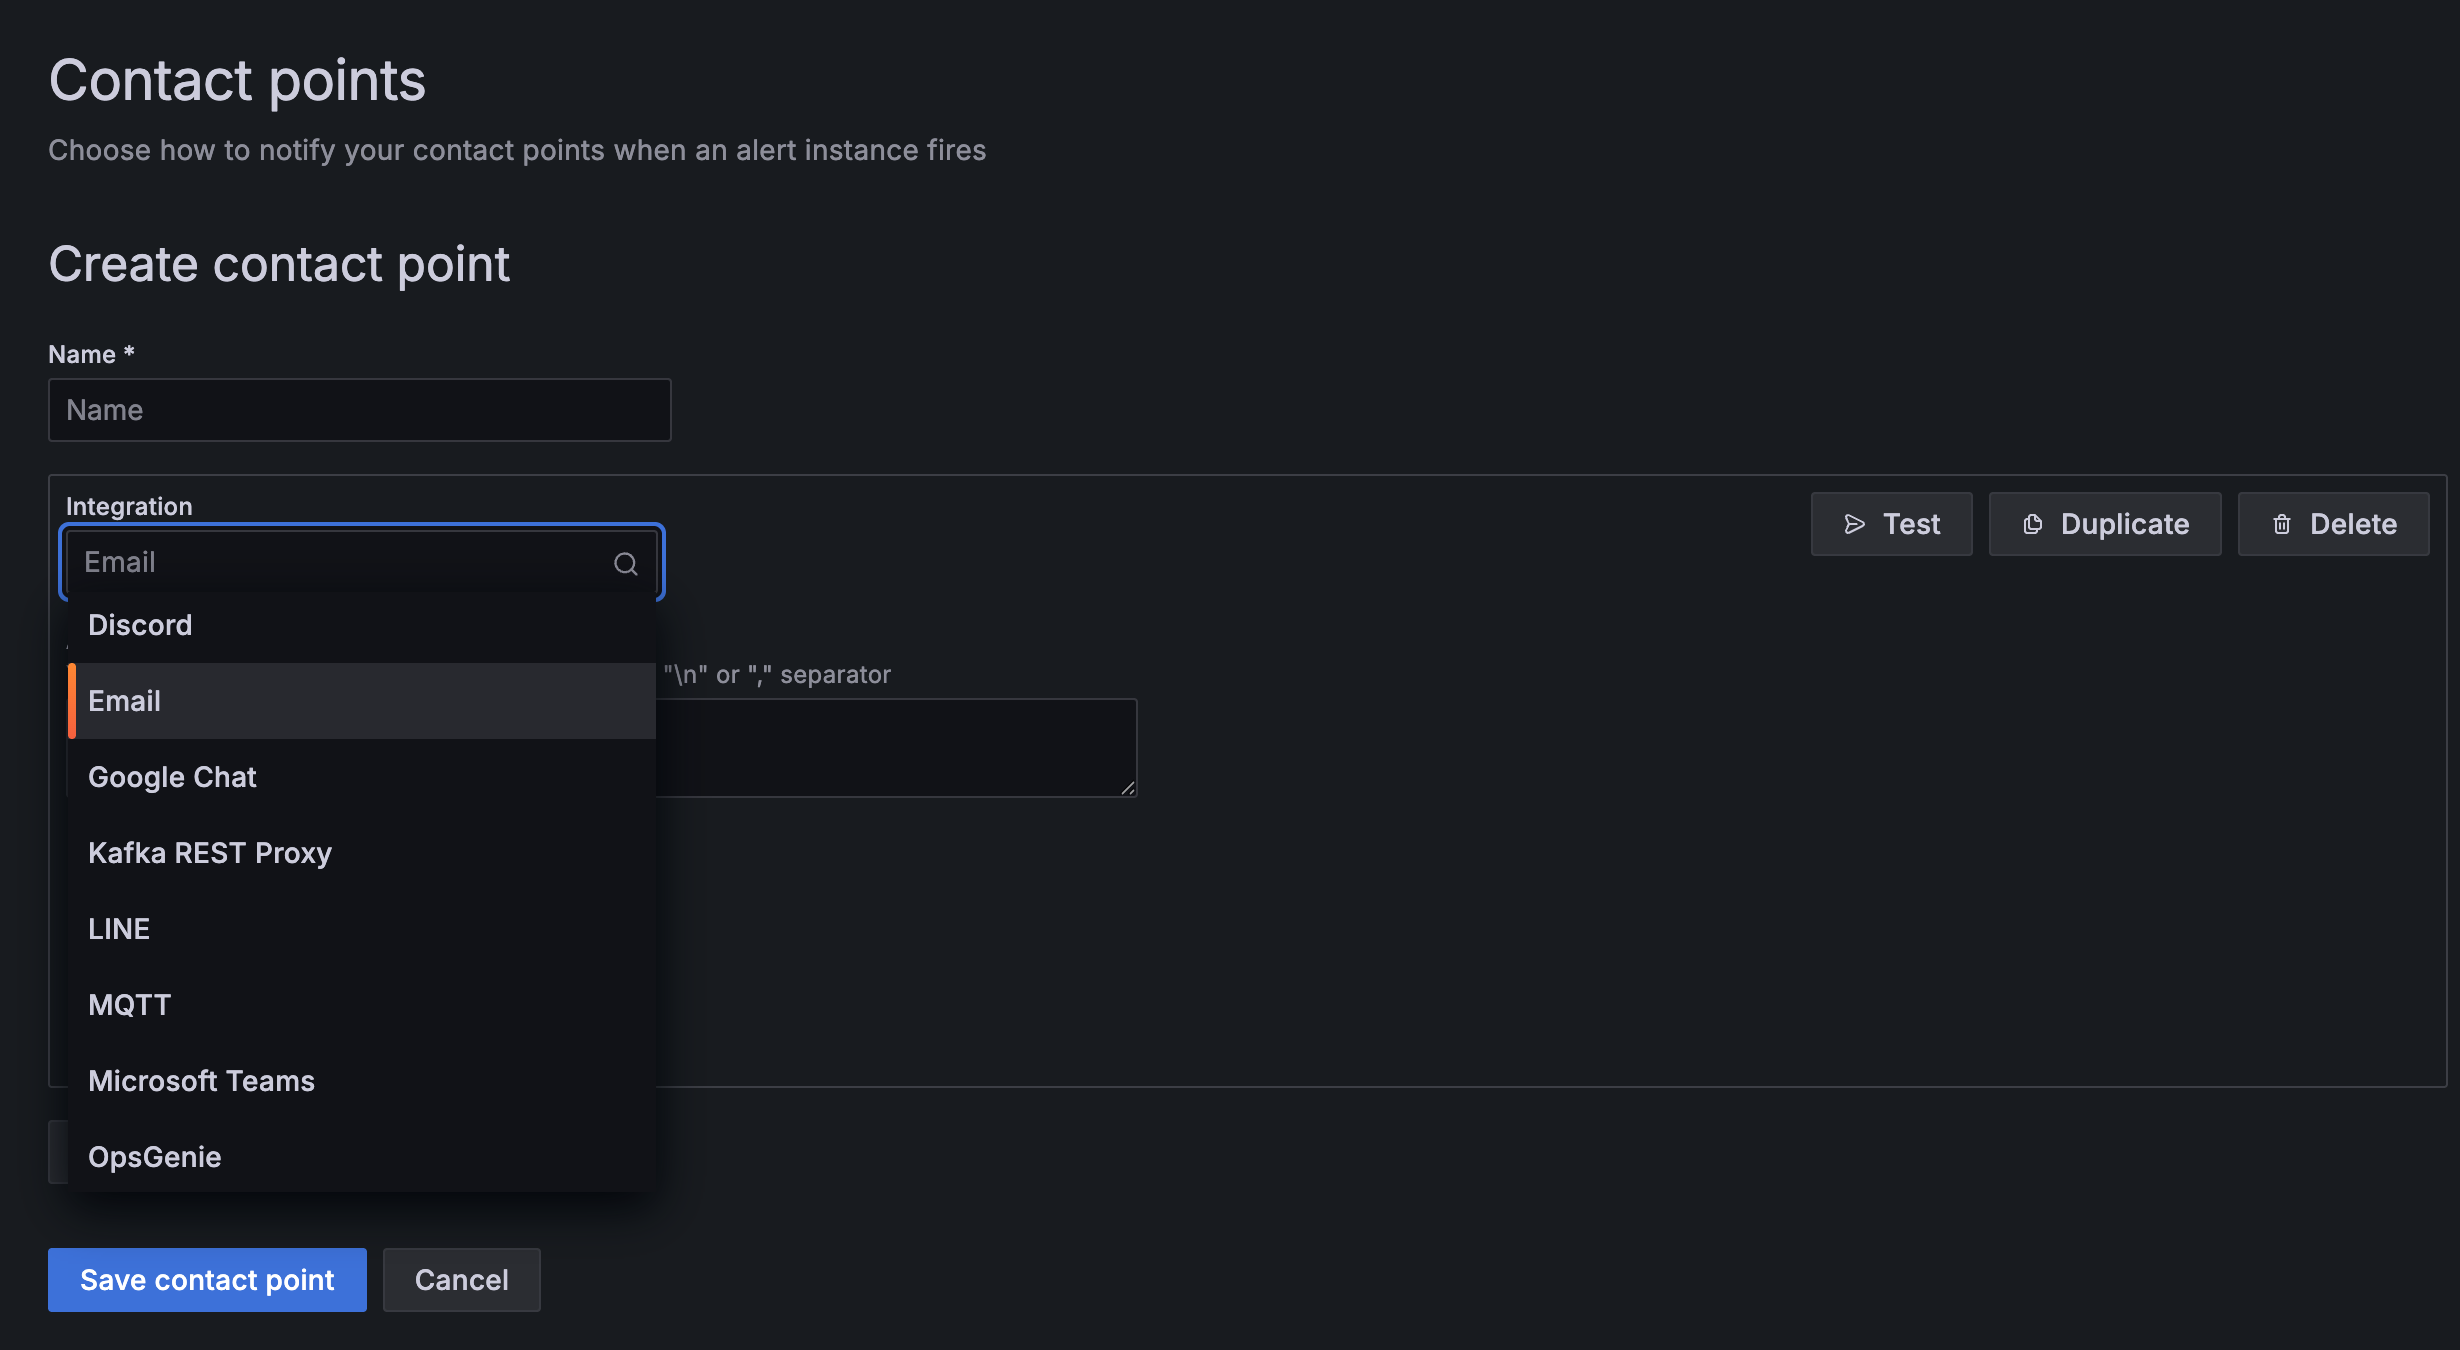
| **4. Configure the notification channel** |
| |
| Grafana supports many notification channels — Email, Slack, Discord, PagerDuty, Webhook, and more. You can pick an existing contact point or create your own, and you can also configure flexible notification policies that route alerts based on labels. |
| |
| For more details, see the [Grafana docs](https://grafana.com/docs/grafana/latest/alerting/fundamentals/notifications/). |
| |
|  |
| |
|  |
| |
| |
| |
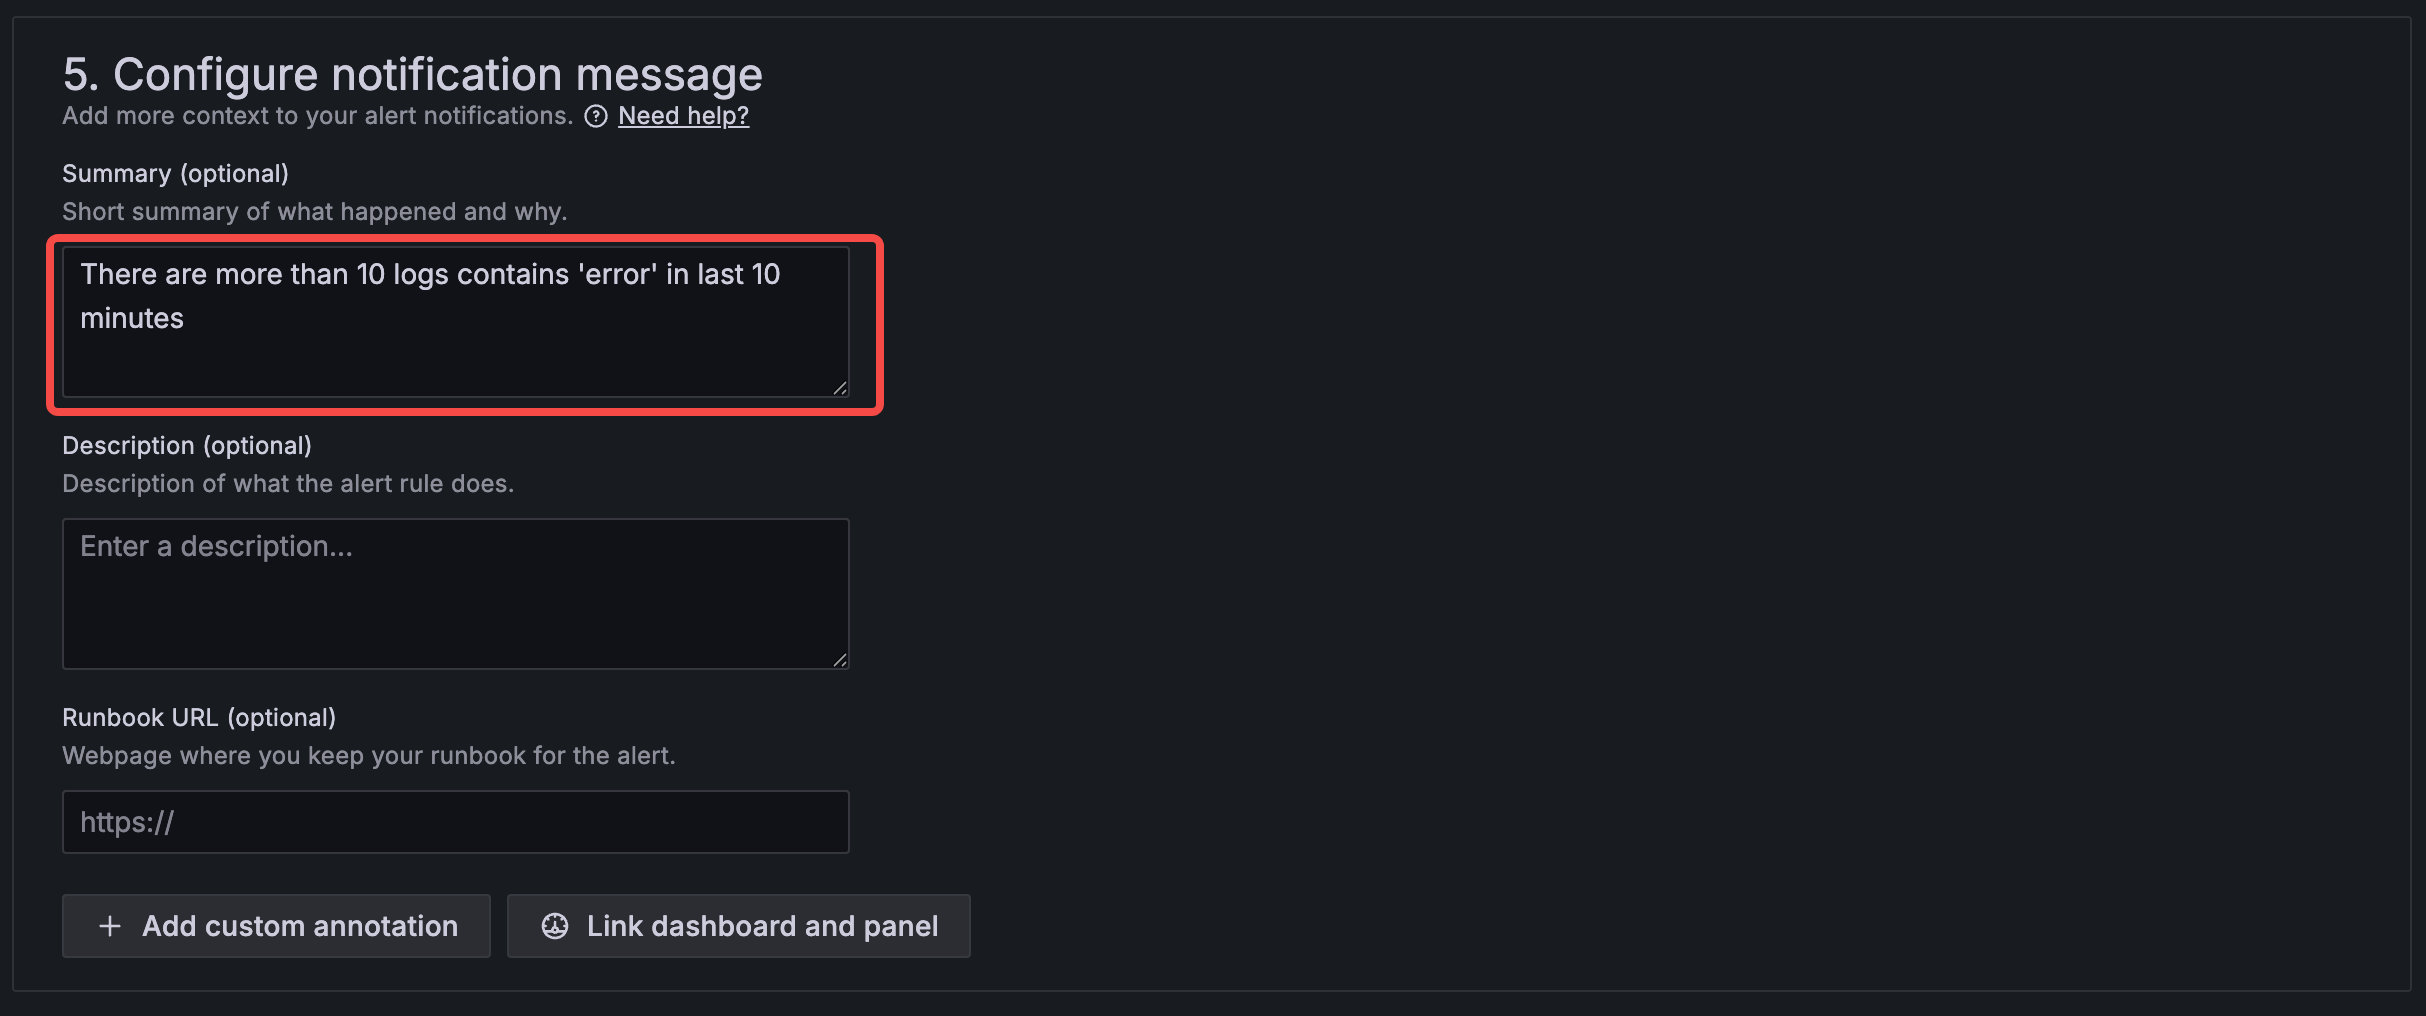
| **5. Configure the notification message** |
| |
| You can customize the notification content — including a summary, description, and a runbook URL that guides handling — so that recipients can grasp what happened more quickly. |
| |
|  |
| |
| |
| |
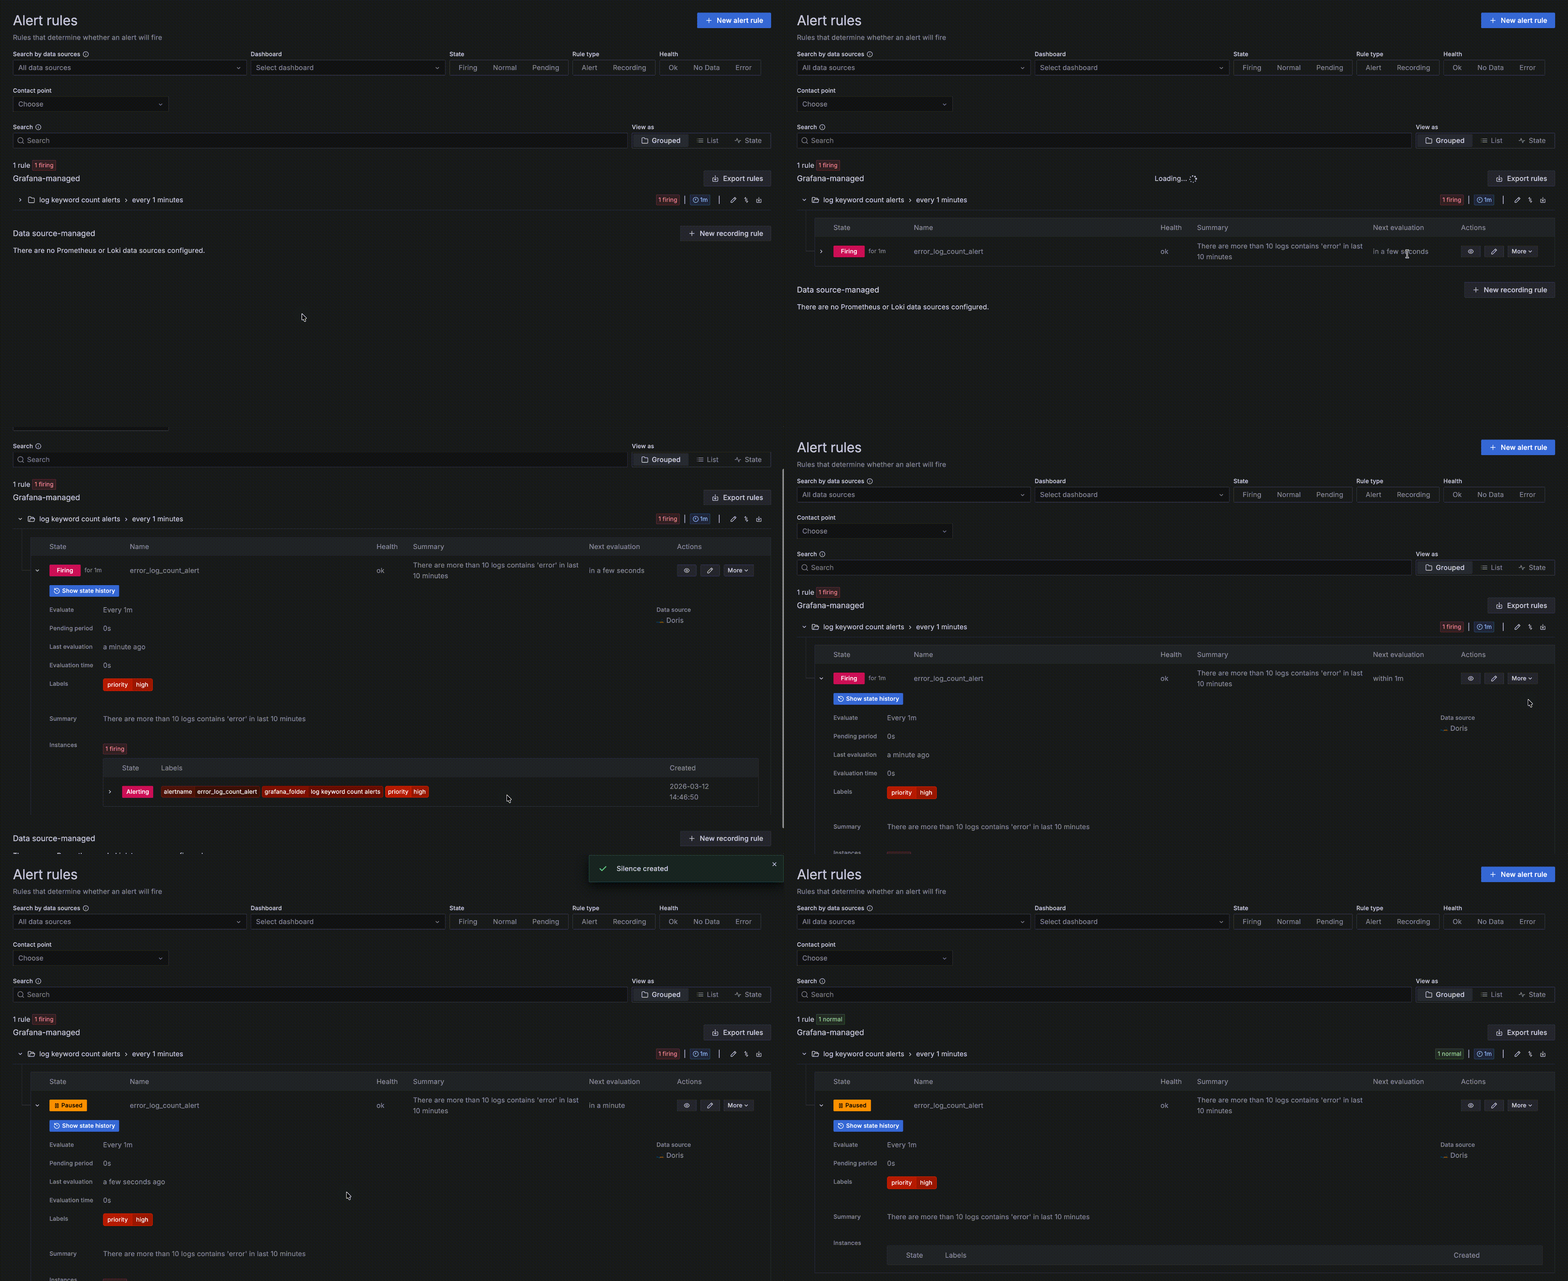
| **6. Alert management** |
| |
| After alert rules are created, you can manage them — pause an alert, silence notifications for a while, modify the rule, change the notification channel, and so on. |
| |
| For more details, see the [Grafana docs](https://grafana.com/docs/grafana/latest/alerting/monitor-status/). |
| |
|  |
