

| --- | |
| { | |
| "title": "Distributed Trace Analysis", | |
| "sidebar_label": "Traces", | |
| "language": "en-US", | |
| "description": "How do you analyze distributed traces in the Doris App? This article covers the trace scatter plot, waterfall view, Span Filter, and multi-dimensional filtering by service, operation, tags, and duration to help locate slow requests and abnormal calls.", | |
| "keywords": [ | |
| "trace analysis", | |
| "distributed tracing", | |
| "Span Filter", | |
| "waterfall view", | |
| "Doris App", | |
| "Grafana", | |
| "OpenTelemetry", | |
| "slow request analysis" | |
| ] | |
| } | |
| --- | |
| <!-- Knowledge type: capability definition + operational steps --> | |
| <!-- Applicable scenario: observability platform / distributed trace analysis --> | |
| Trace is one of the three pillars of observability data. It tracks the full execution of a request and consists of spans — execution intervals within each service — and their call relationships. Traces are essential for analyzing request performance and anomalies in distributed systems. | |
| You can analyze traces on the **Traces** page: locate the traces of interest (for example, long-running ones), then visualize a specific trace and drill into its spans. | |
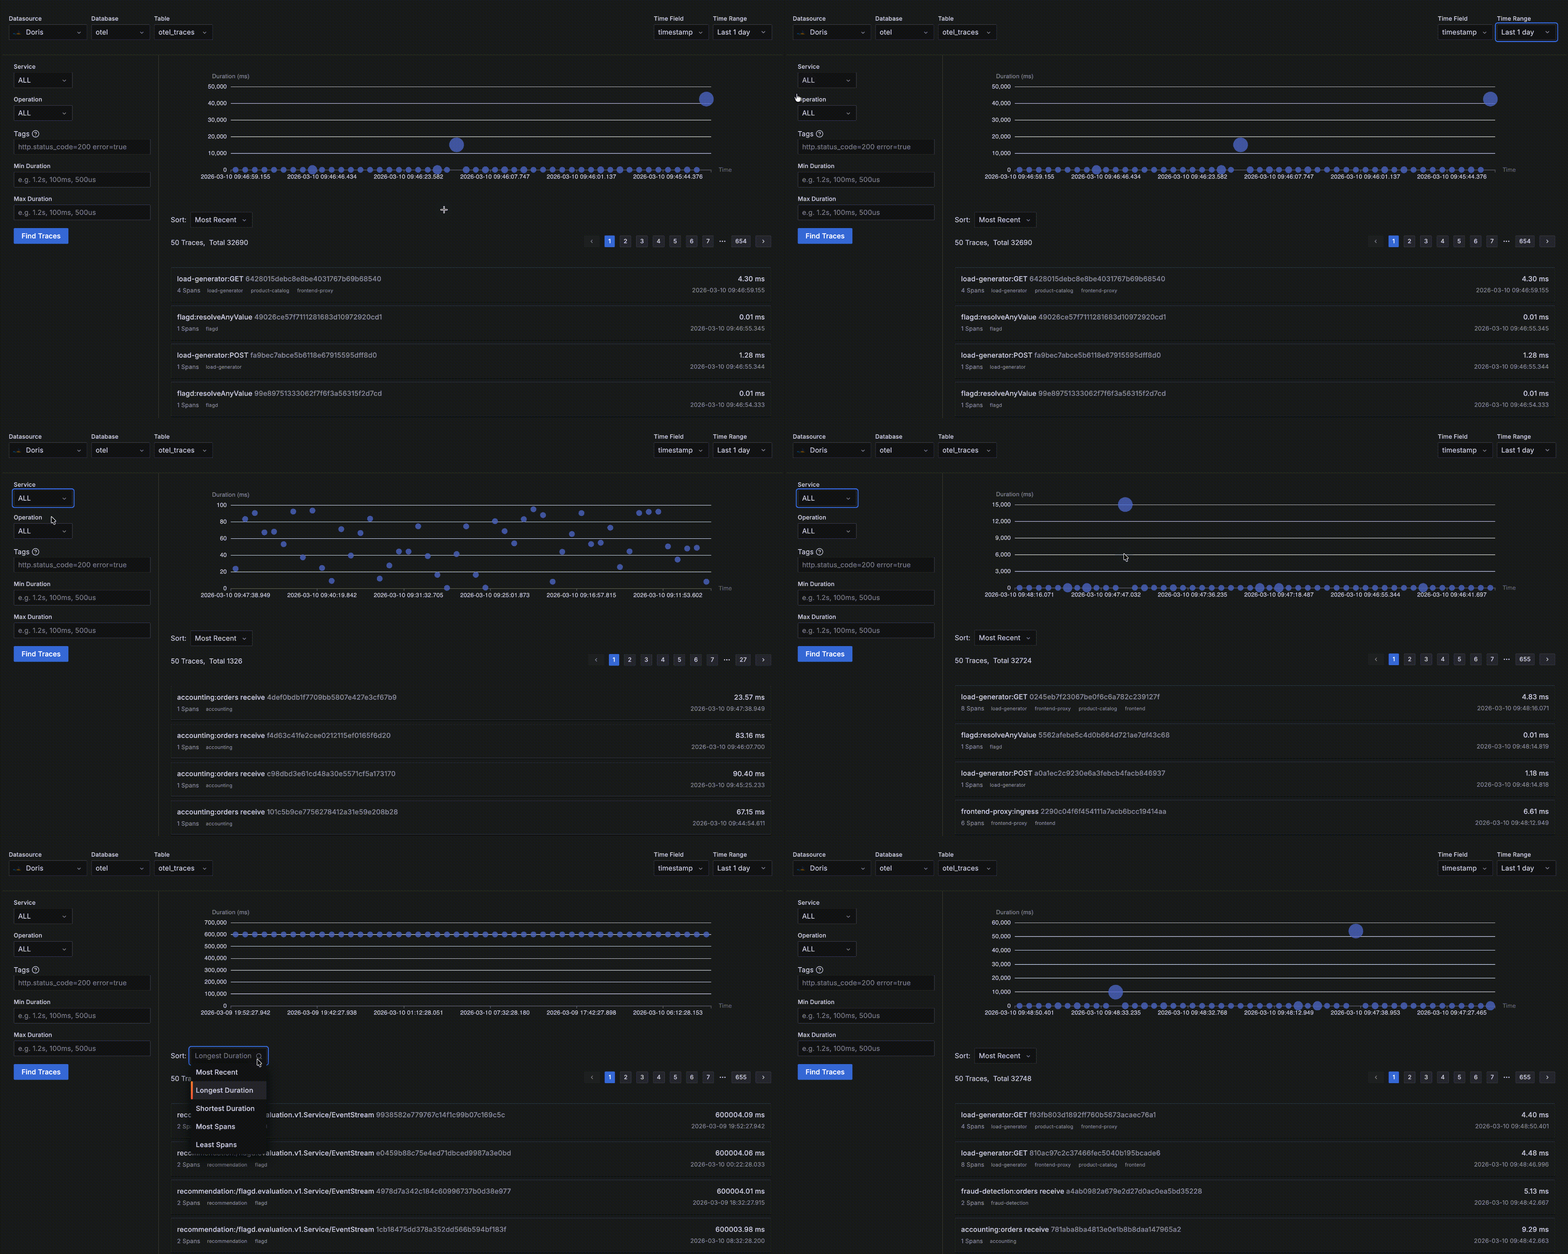
| As shown below, the **Traces** page consists of four areas: | |
| 1. **Data selection area (top)**: Choose the trace data source (Datasource, Database, Table), time field, and time range. | |
| 2. **Filter area (left)**: Filter traces by Service, Operation, Tags, and Duration. | |
| 3. **Trace distribution area (top right)**: A scatter plot of matching traces — X-axis is trace start time, Y-axis is trace duration, and bubble size is the number of spans in the trace. The scatter plot helps you quickly spot long-running or large-span "big" traces. Click a bubble to view that trace's details as a waterfall chart. | |
| 4. **Trace list area (bottom right)**: A list of matching traces showing service, operation, trace_id, trace duration, span count, etc. The default sort `Most Recent` lists the newest traces by start time in descending order. You can switch the sort to show the longest/shortest traces or those with the most/fewest spans. | |
|  | |
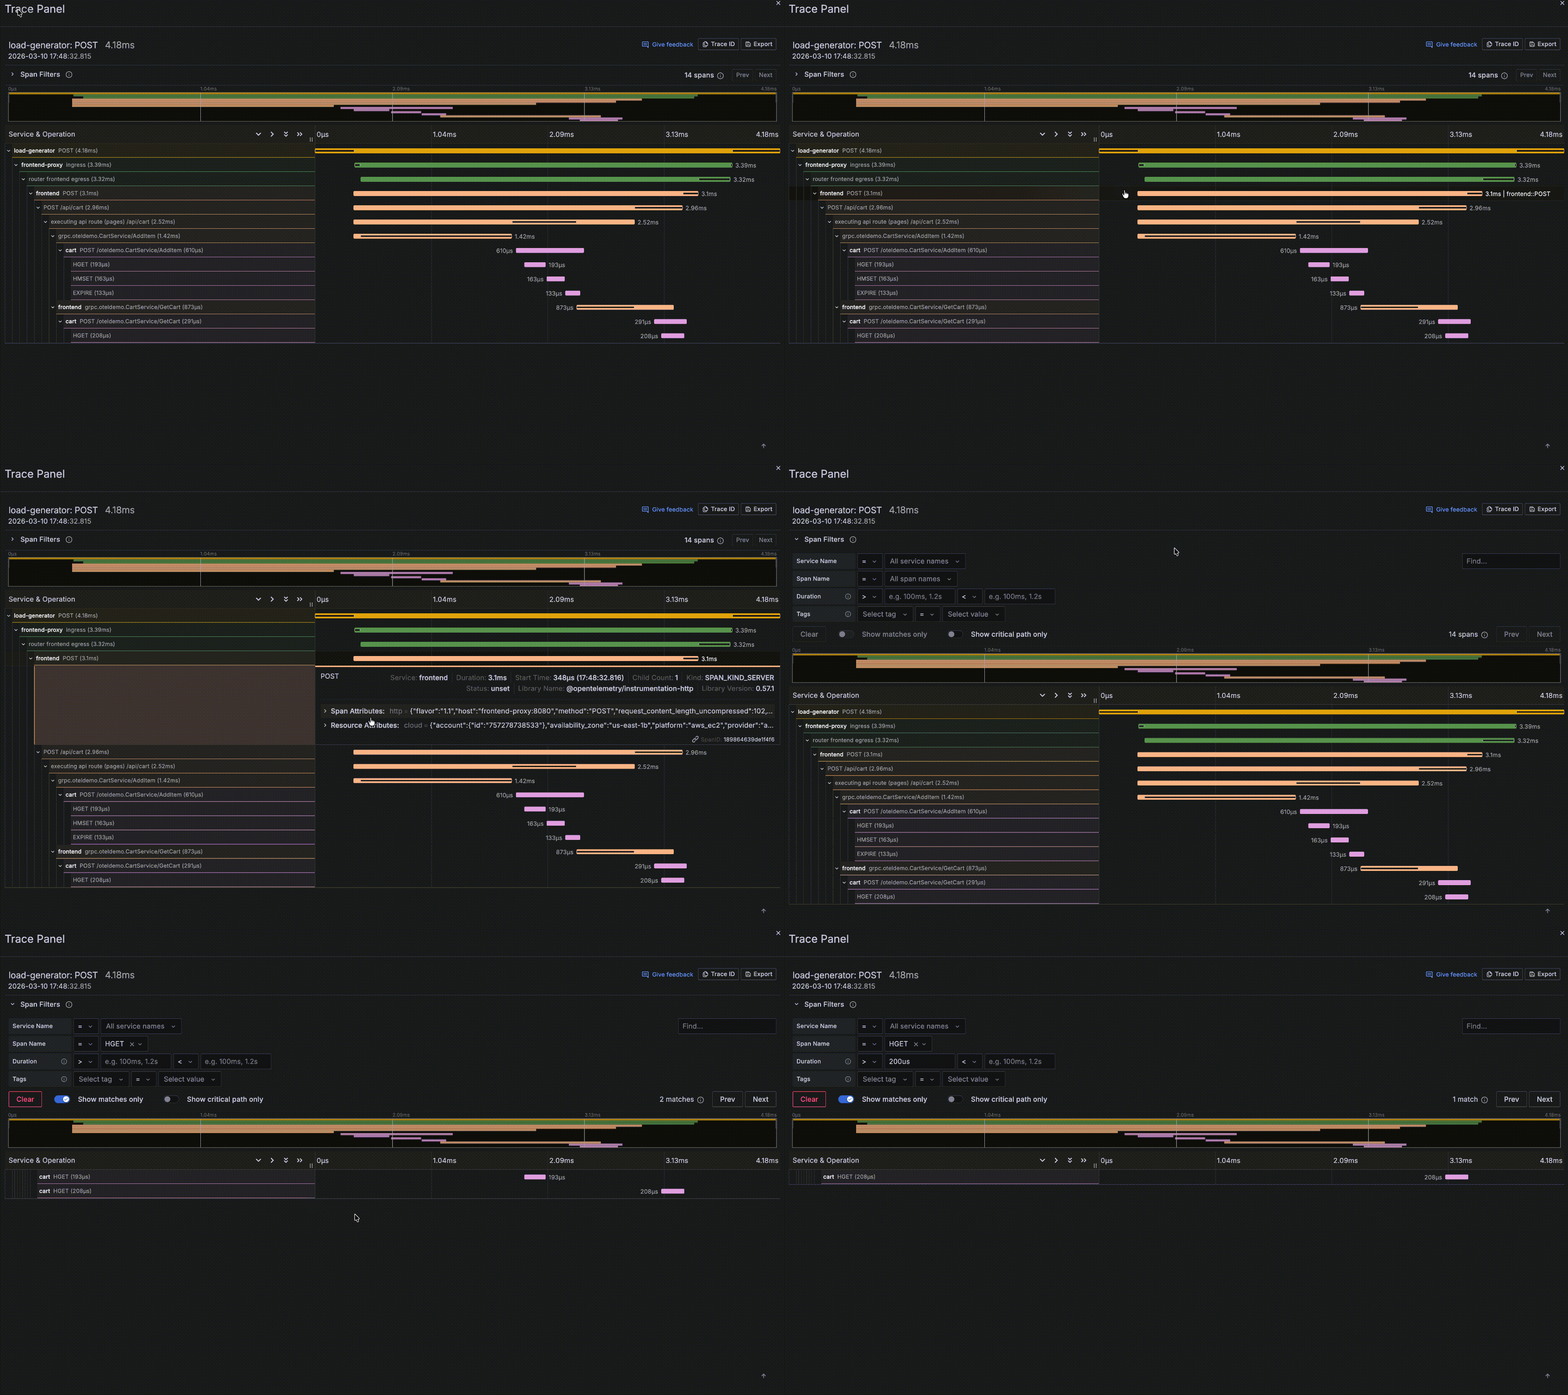
| Clicking a trace opens a Trace Panel with rich details, where you can further analyze the spans in that trace: | |
| 1. View the trace's call-chain minimap and waterfall chart, including each span's execution window and call relationships. | |
| 2. Click a span to view its start time, duration, and contextual information including Span Attributes and Resource Attributes. | |
| 3. Click **Span Filter** to filter spans by Service Name, Span Name, Duration, Tags, etc. | |
|  | |
| ## Common filter examples | |
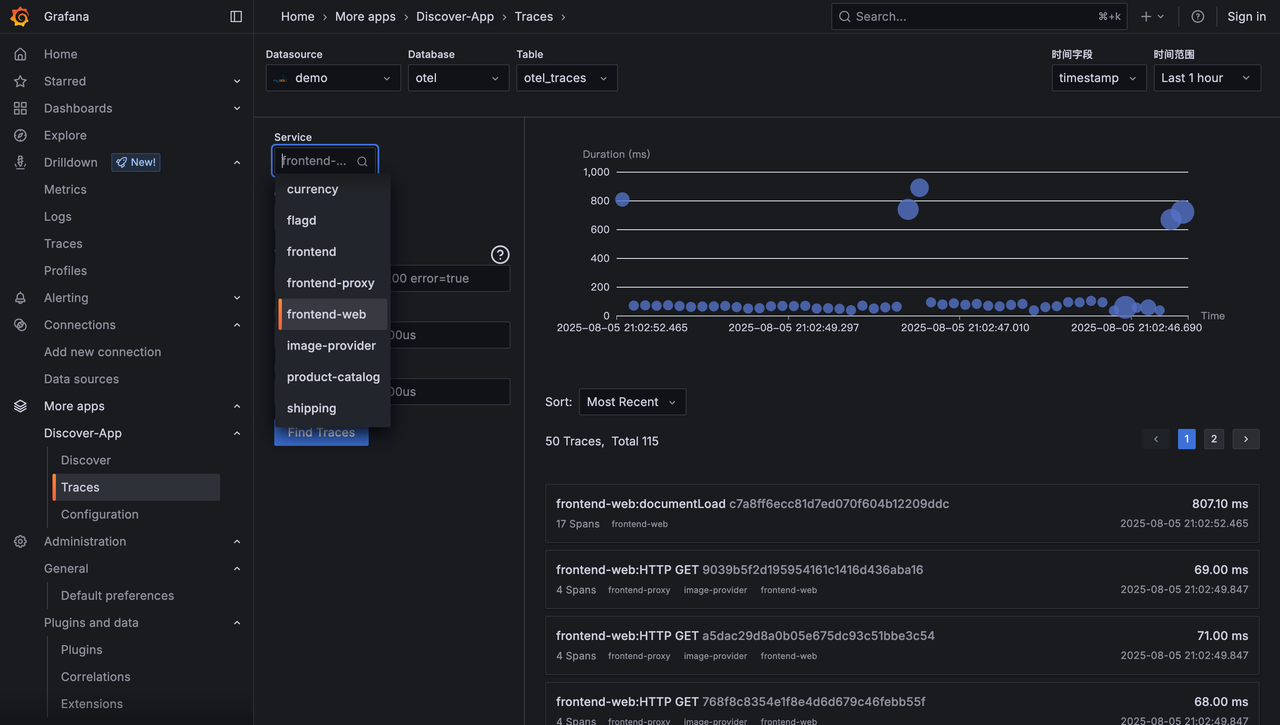
| ### Filter by service | |
| ``` | |
| Service = frontend-web | |
| ``` | |
| Quickly view traces produced by the specified service. | |
|  | |
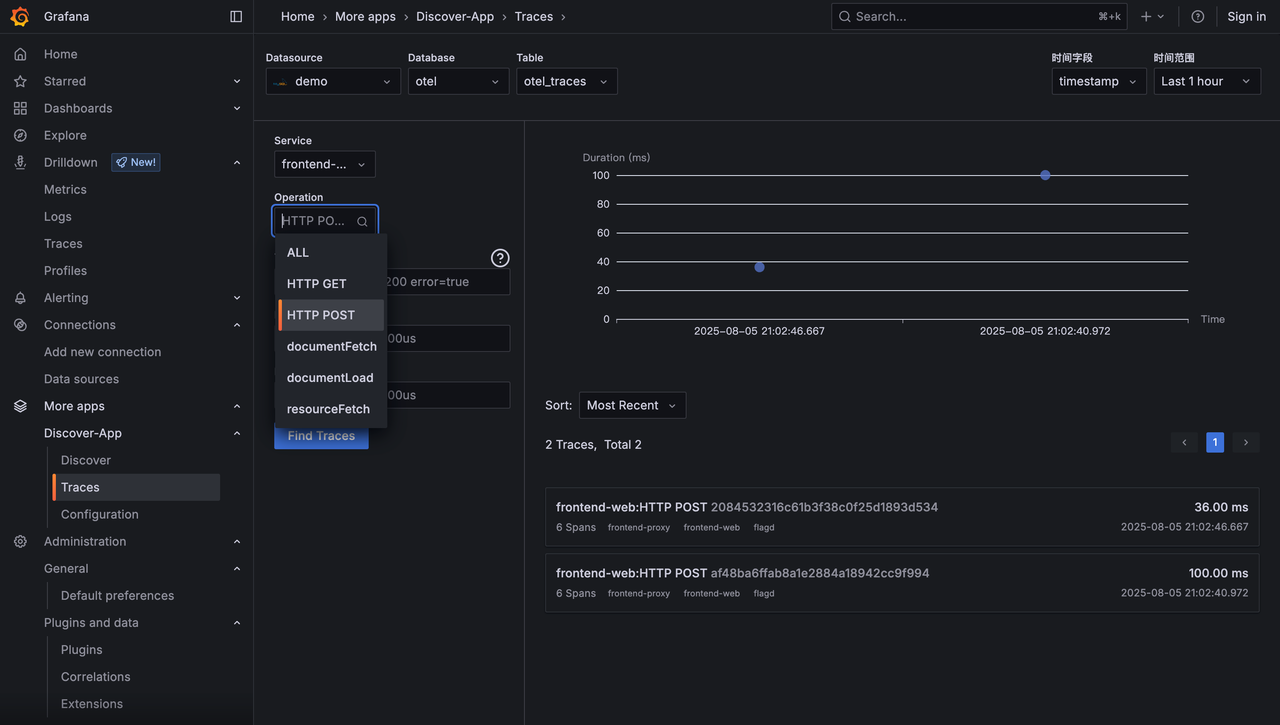
| ### Filter by operation | |
| ``` | |
| Operation = HTTP POST | |
| ``` | |
| Useful for locating a specific endpoint or request type. | |
|  | |
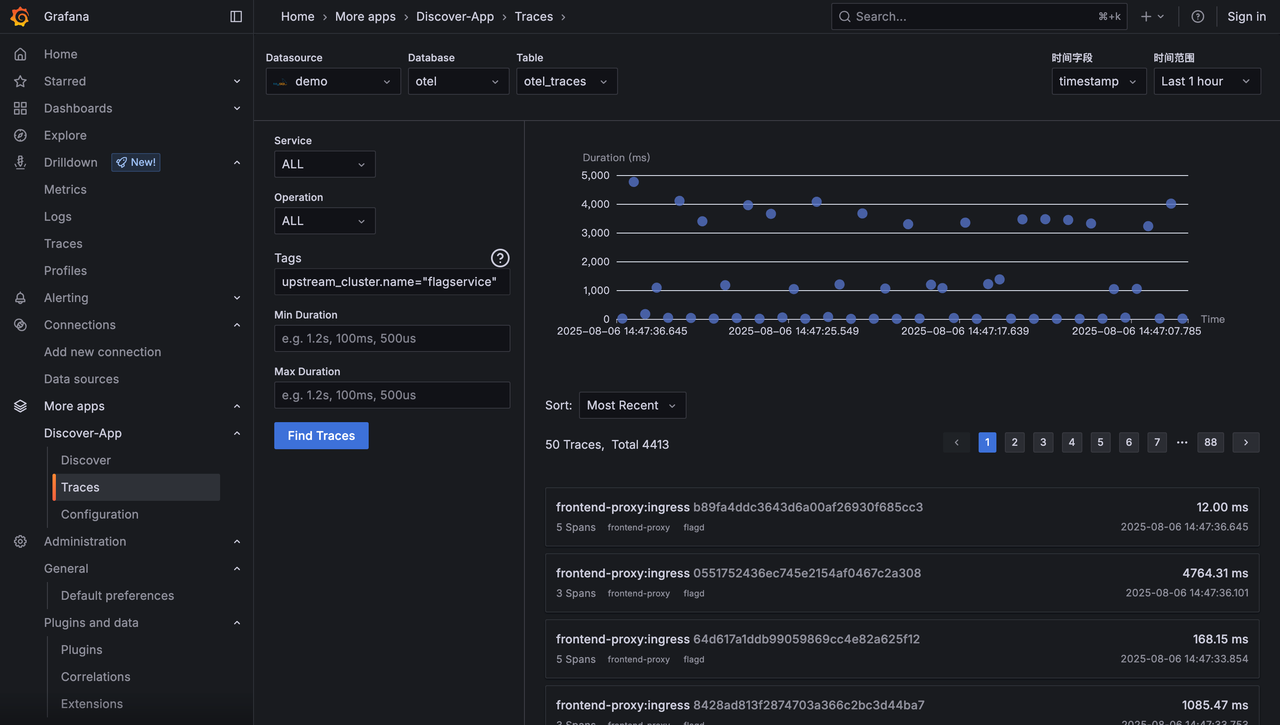
| ### Filter by tags | |
| ``` | |
| upstream_cluster.name="flagservice" | |
| ``` | |
| Use **logfmt key=value** syntax to filter on span attributes. | |
|  | |
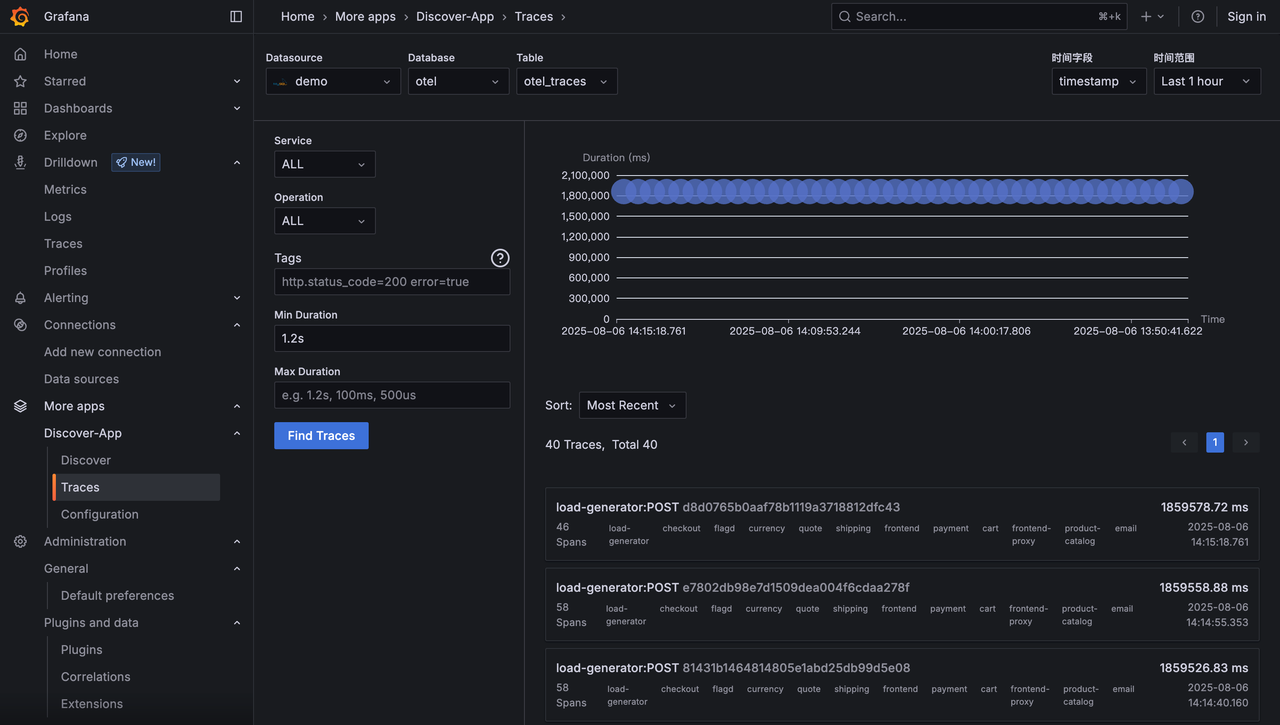
| ### Filter by duration | |
| `Min Duration = 100ms ``Max Duration = 1.2s` | |
| Quickly pinpoint slow requests. | |
|  | |
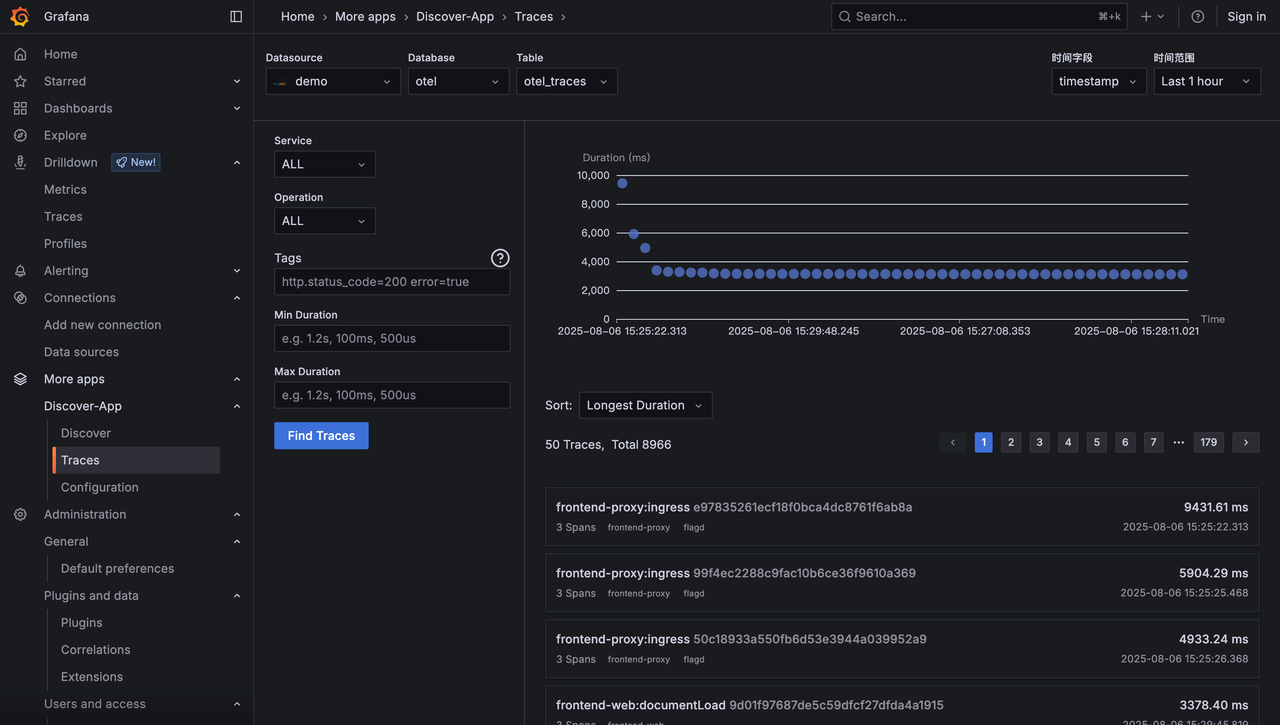
| ## Sorting and pagination | |
| The trace list supports several sort options: | |
| - Most Recent | |
| - Longest / Shortest Duration | |
| - Most / Fewest Spans | |
| It also supports paginated browsing. | |
|  |