{ “title”: “Log and Trace Search”, “sidebar_label”: “Search”, “language”: “en-US”, “description”: “How to get a Kibana Discover-like search experience on Doris? This article covers the SQL and Lucene dual syntax, time-trend chart, contextual analysis, field value distribution, and one-click log-to-trace correlation.”, “keywords”: [ “Doris log search”, “Discover”, “Lucene syntax”, “SQL query”, “field browser”, “context analysis”, “log to trace correlation”, “Doris App”, “Grafana” ] }
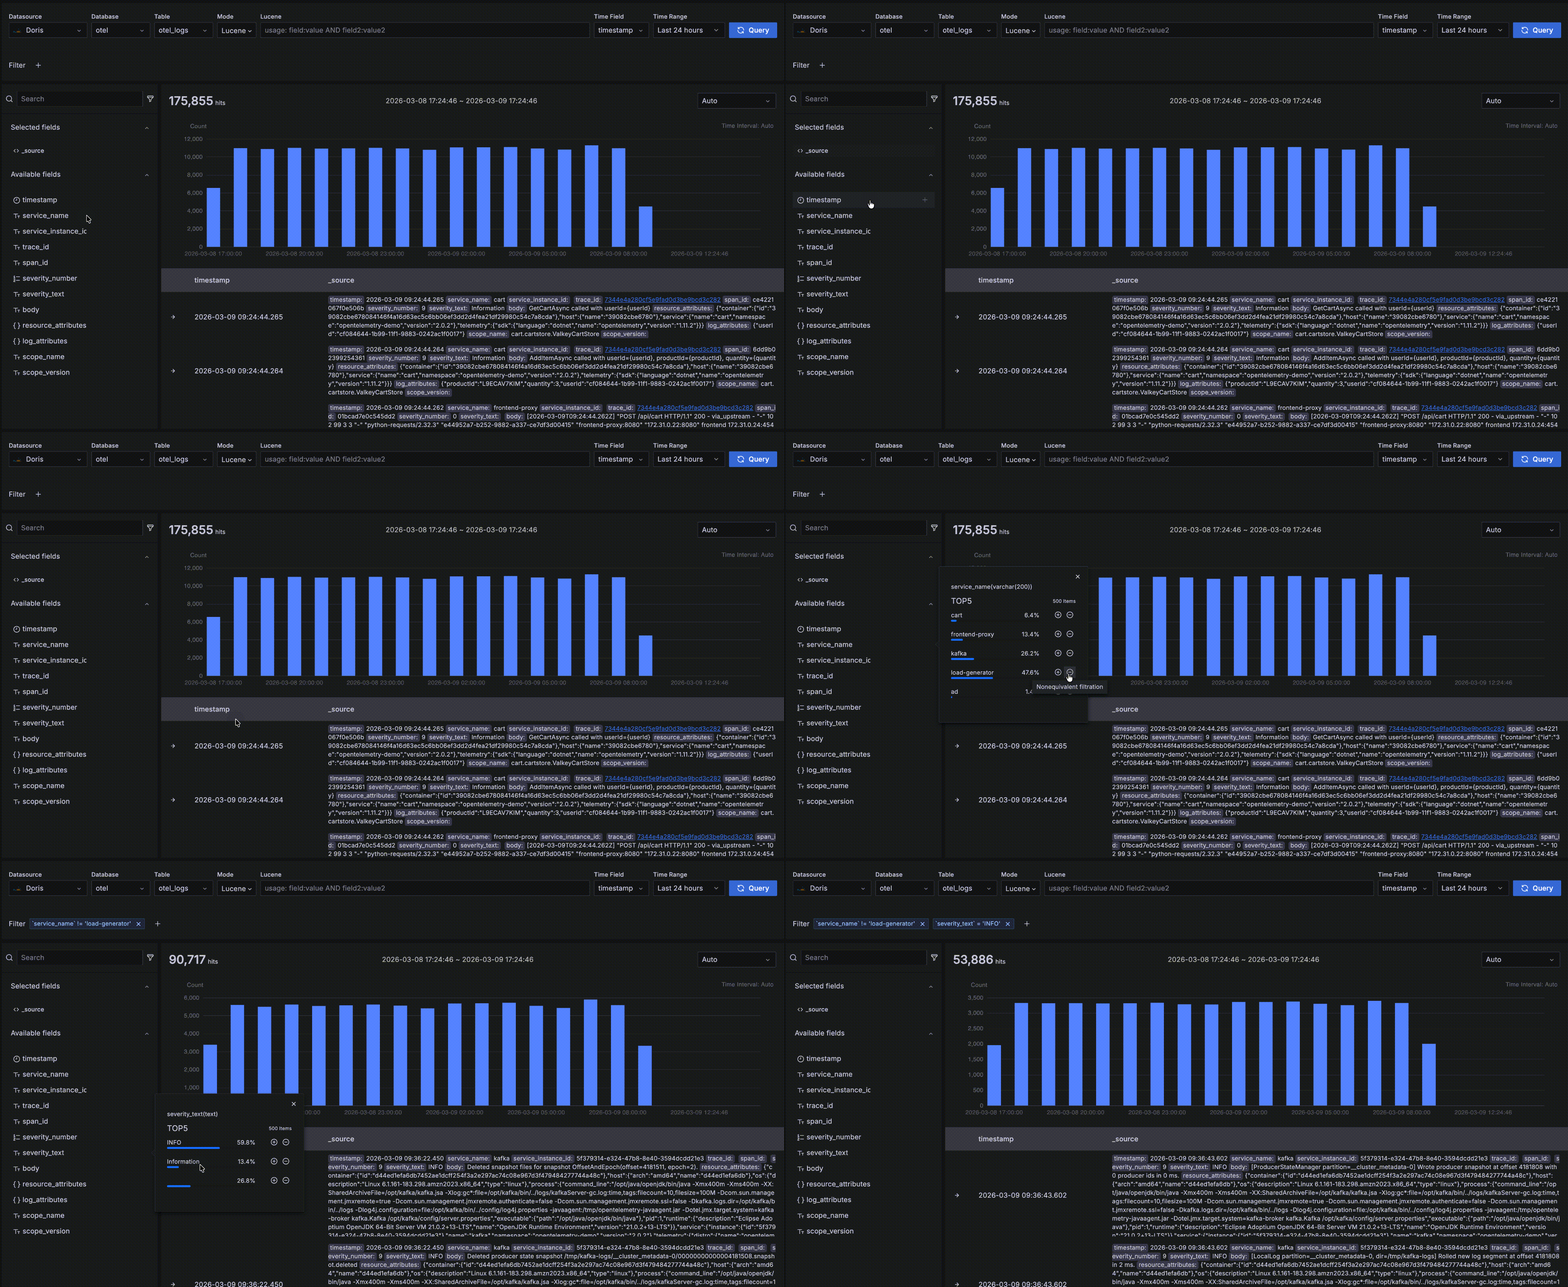
The Discover page provides a Kibana Discover-like search and analysis experience, optimized for high-performance log analysis.
Key capabilities:
- Supports both SQL and Lucene query syntax
- One-click navigation from a log to its trace
- Interactive selection of time range, filters, and so on
- Provides both table and JSON result views
- View surrounding data around a given record for contextual analysis
- Field value distribution statistics (Top 5 values with percentages)
Discover page overview
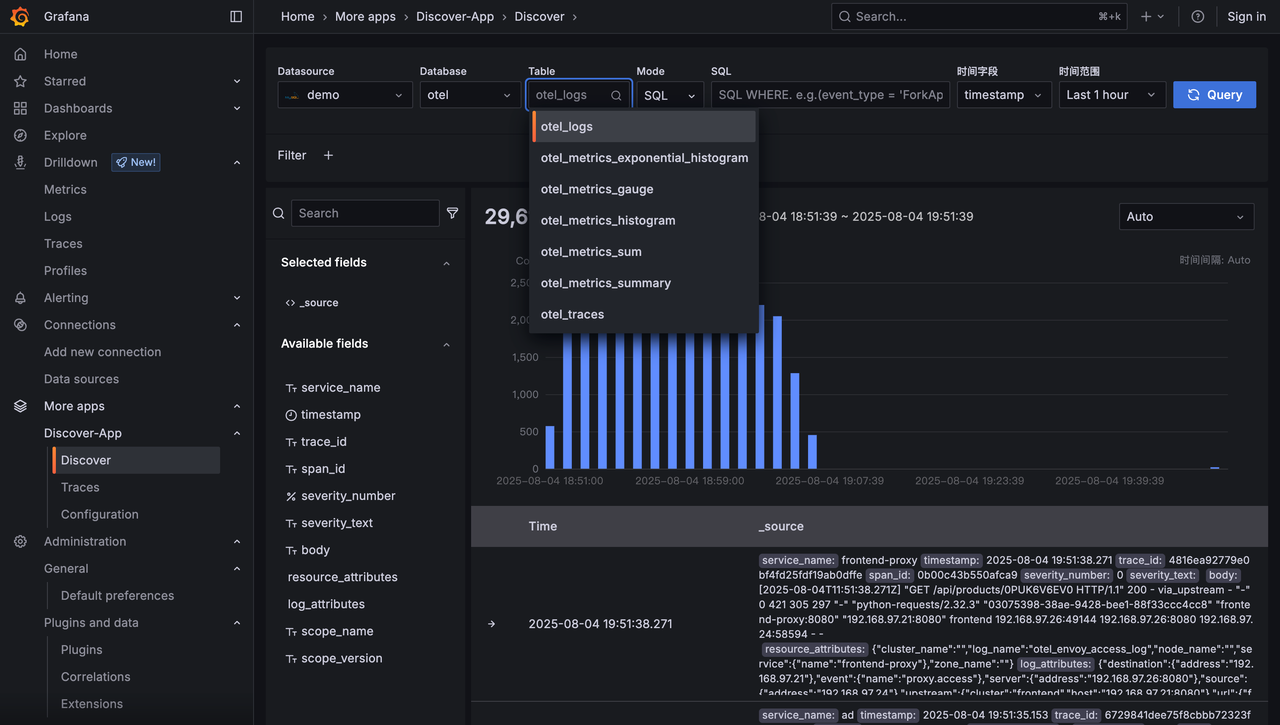
The Discover page consists of four core areas:
1. Query input area (top)
Configures the query scope and search statement. Capabilities include:
- Choose a data source
- Choose the time field and time range
- Enter search conditions in either SQL or Lucene syntax
2. Time trend area (middle)
A histogram showing the time-based distribution of query results. Capabilities include:
- Quickly observe how matching data trends over time
- Drag-select a time window to change the query's time range
3. Detail data area (bottom)
Shows detailed records of query results with contextual exploration. Capabilities include:
- Show the most recent matching records; if a
trace_idis present, click to view the trace details - Expand a single log to view all fields in either table or JSON form
- Interactively build filter conditions from the table form
- View surrounding data for a record
4. Field browser area (left)
Shows all fields of the current table, with field-level exploration.
Capabilities include:
- Choose which fields to display on the right; by default
_source(a concatenation of all fields) is shown - Hover over a field to see its Top 5 most frequent values and percentages
- Click “+” or “-” on a value to build filter conditions interactively, which are synced to the top query bar
Query input
In the query input area, use the dropdown menus to select data source, database, table, time field, and time range. The defaults for data source, database, and table can be changed on the configuration page; the default time field is the first DATETIME or DATE column in the table.
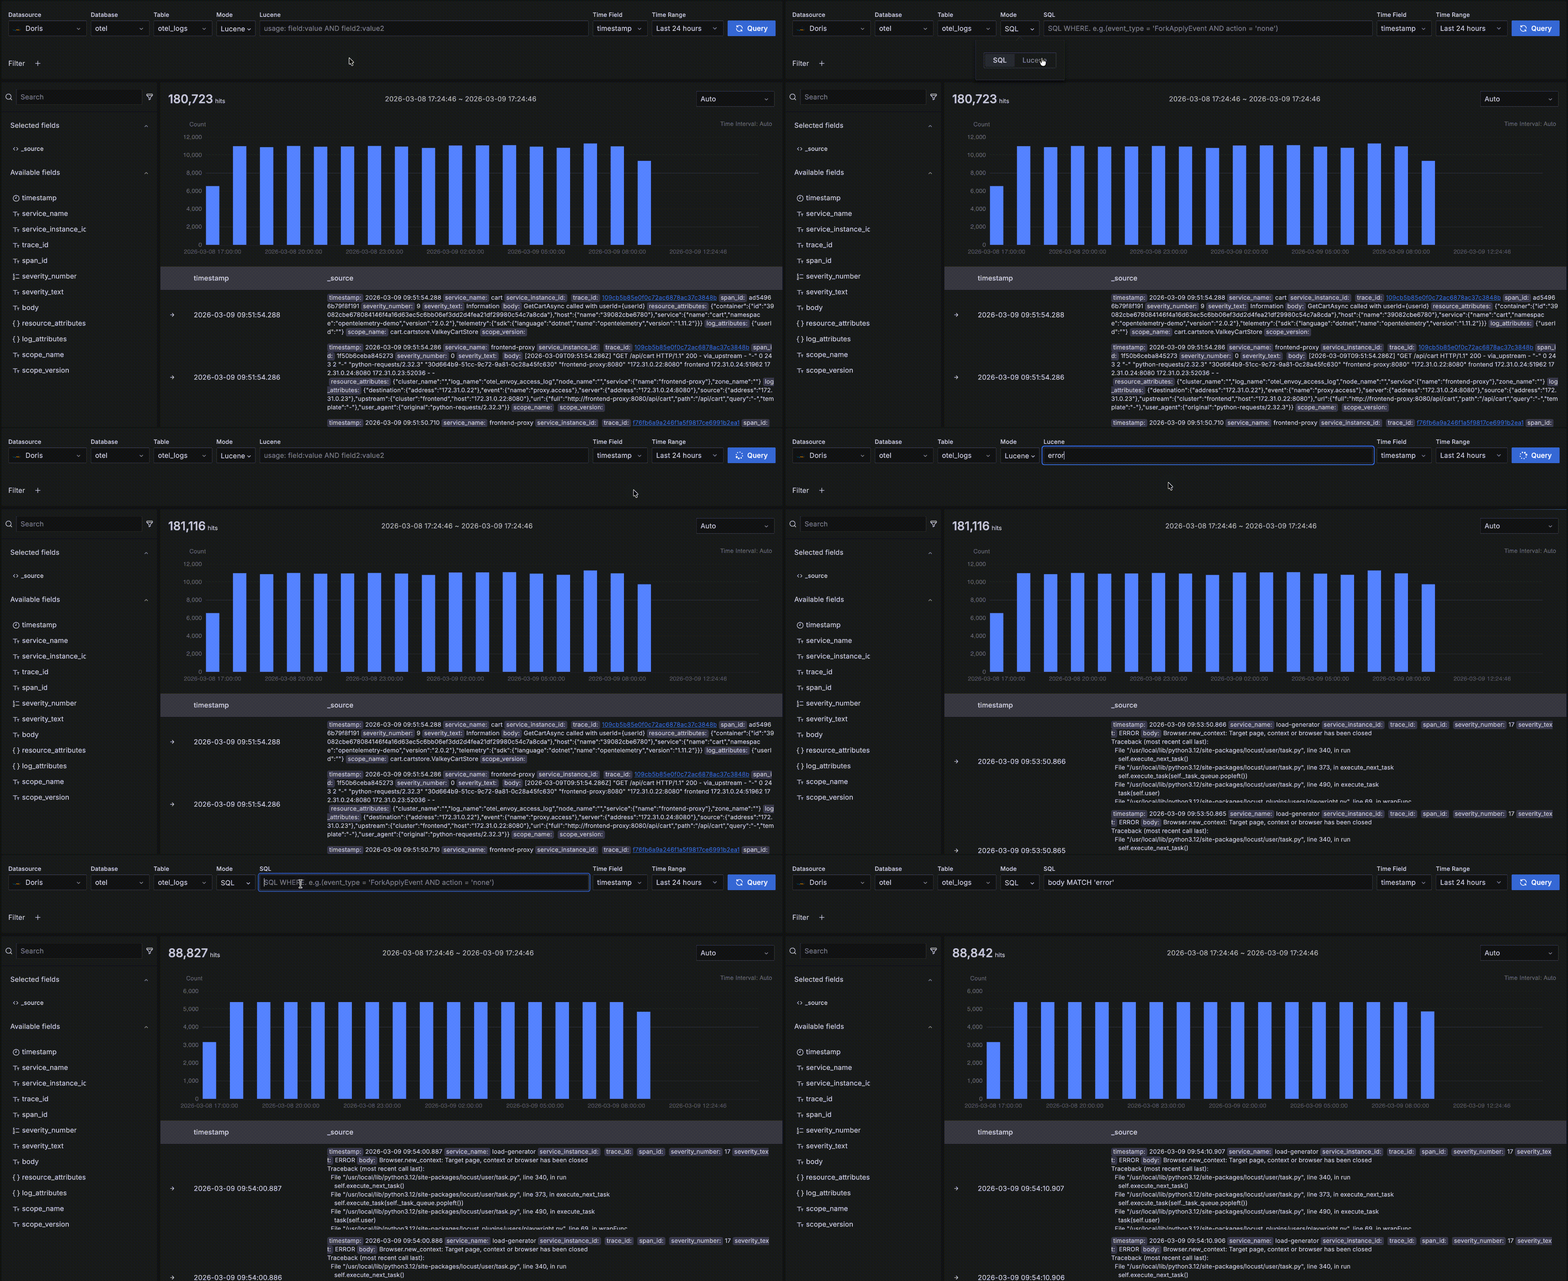
The search input box supports both SQL and Lucene syntax — Lucene is internally translated into SQL WHERE conditions. The mapping between supported Lucene syntax, Kibana, and SQL is shown below.
| Feature | Doris App Lucene syntax | Kibana | SQL WHERE | Notes |
|---|---|---|---|---|
| Single-field keyword match | service_name:kafka | Same | service_name MATCH ‘kafka’ | Exact field match, rewritten to service_name MATCH_ANY ‘kafka’ |
| Cross-field keyword match | error | Same | (service_name MATCH ‘error’) OR (scope_name MATCH ‘error’) | Full-text match across all inverted-index fields, auto-rewritten as multi-field MATCH_ANY |
| Single-field phrase match | service_name:“kafka logs” | Same | service_name MATCH_PHRASE ‘kafka logs’ | Field-level phrase match |
| Cross-field phrase match | “kafka logs” | Same | service_name MATCH_PHRASE ‘kafka logs’) | Exact phrase match, rewritten to MATCH_PHRASE |
| Wildcard | kaf* | Same | ((service_name MATCH_PHRASE_PREFIX ‘kaf’) OR (scope_name MATCH_PHRASE_PREFIX ‘kaf’)) | Prefix/suffix wildcard, rewritten to MATCH_PHRASE_PREFIX |
| Numeric / time range | duration:[100 TO 500] | Same | duration BETWEEN 100 AND 500 | Translated to SQL BETWEEN |
| Unbounded range | duration:>500 | Same | duration > ‘500’ | Translated to SQL comparison |
| Open / closed range | {100 TO 200} | Same | Curly braces denote an open interval | |
| AND combination | service_name:kafka AND status:failed | Same | (service_name MATCH ‘kafka’) AND (status MATCH ‘failed’) | Logical AND |
| OR combination | error OR warning | Same | Logical OR | |
| NOT combination | NOT kafka or -kafka | Same | NOT (service_name MATCH ‘kafka’) | Logical NOT |
| Grouping | (service_name:kafka OR service_name:zookeeper) AND status:failed | Same | ((service_name MATCH ‘kafka’) OR (service_name MATCH ‘zookeeper’)) AND (status MATCH ‘failed’) | Supports complex logical combinations |
Key points of the Lucene syntax:
- Basic form is
field_name:match_condition. field_name:matches a single field againstmatch_condition. Withoutfield_name:, a barematch_conditionmatches if any field matches (an OR across fields).- For text values,
match_conditionhas three forms:- A double-quoted condition denotes phrase match — all words must appear in the same order as inside the quotes.
- An unquoted condition denotes keyword match — any one of the words can match.
*denotes a wildcard.
- For numeric and date values,
match_conditionhas three forms:- A single value denotes equality.
>,<denote range, similar to SQL.- Brackets denote intervals — square brackets for closed and curly braces for open.
- Multiple conditions can be combined with AND / OR / NOT, similar to SQL. Parentheses adjust grouping precedence.
Key points of the SQL syntax:
MATCHandMATCH_ANYcorrespond to Lucene keyword match — any one of the keywords matches (OR relation).MATCH_ALLis also keyword match, but every keyword must match (AND relation).MATCH_PHRASEcorresponds to Lucene phrase match — all words in the same order.- Equality and range queries use the standard
=,>,<,BETWEEN. - Multiple conditions can be combined with AND / OR / NOT, with parentheses adjusting precedence.
Time-trend data
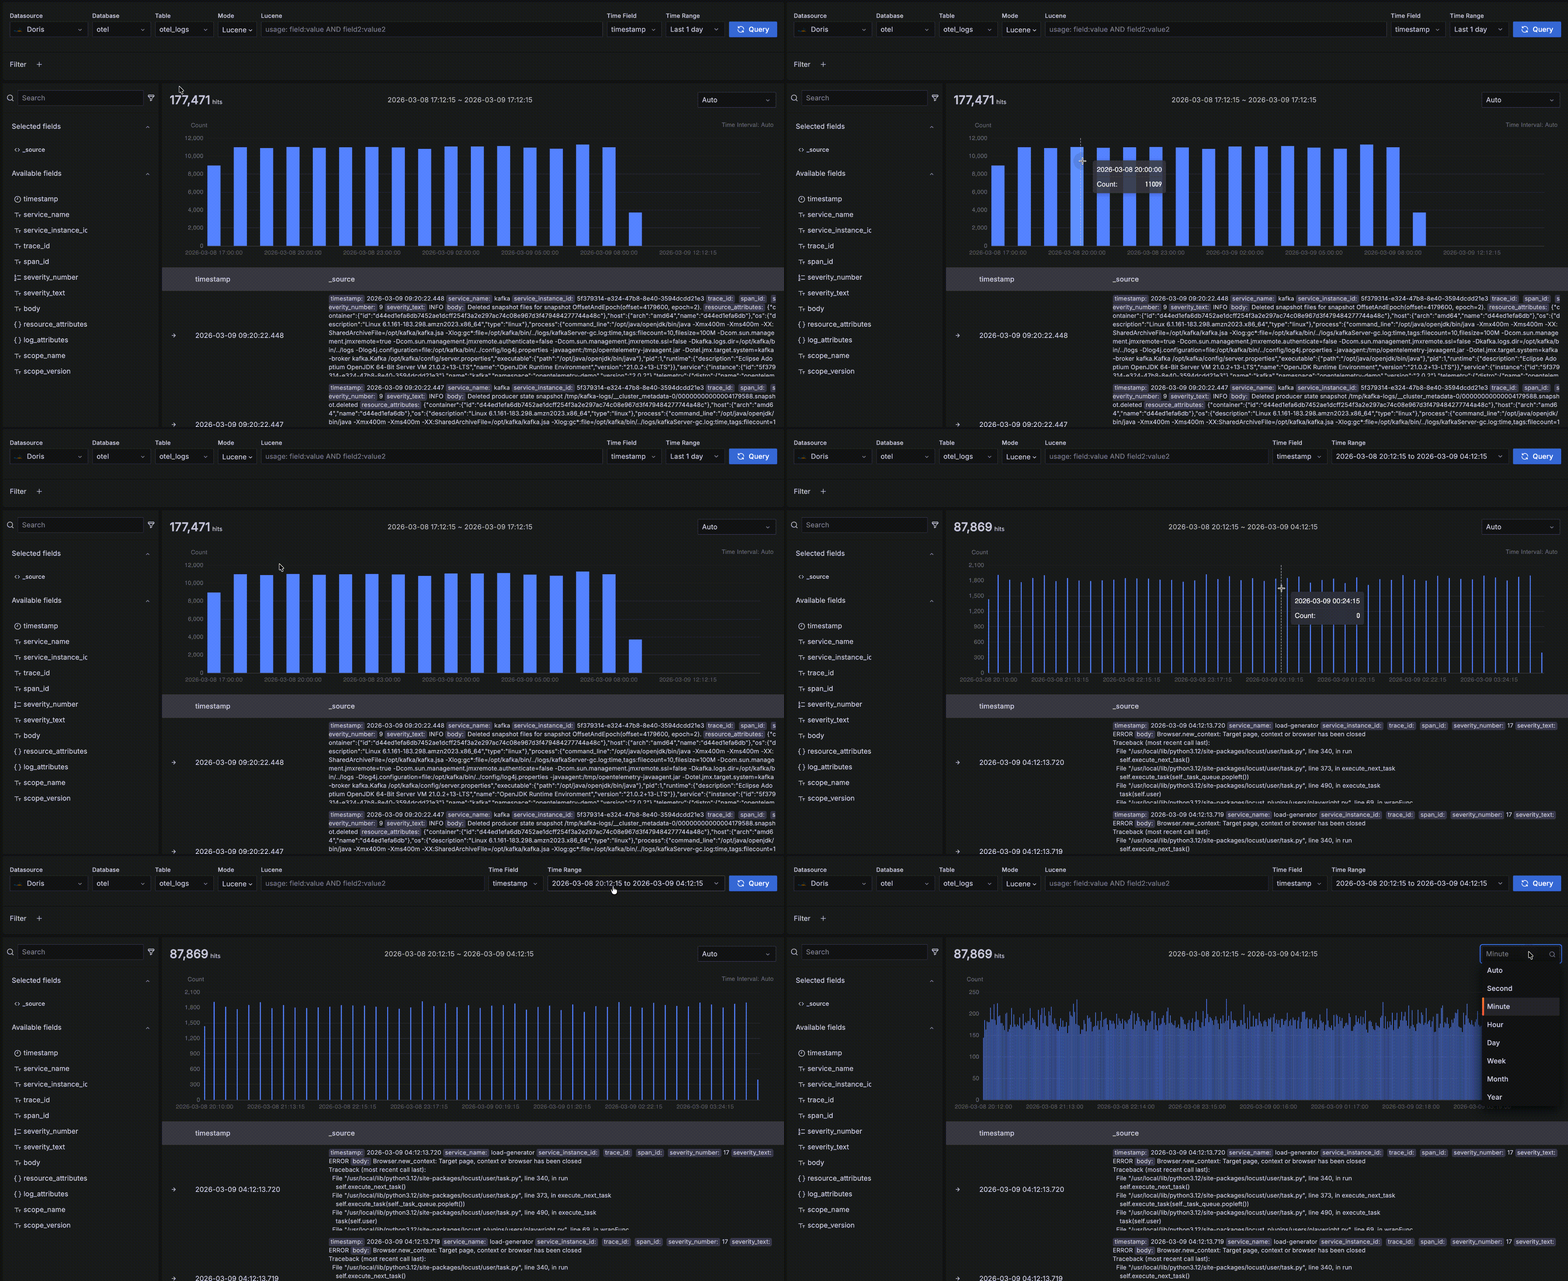
As shown below, the area inside the red box is the time-trend data area. It is meant for quickly seeing the count and trend of matching data over time. Several interactions are available:
- Hover over a bar to see the start time of the time bucket and the count of matching data within it.
- Drag-select on the trend chart to change the query's time range.
- The bucket length defaults to
Auto, scaled to the overall time range. You can also pick a different granularity such as second, minute, or hour from the dropdown.
Detail data
As shown below, the area inside the red box is the detail data area, which displays the records matching your query conditions.
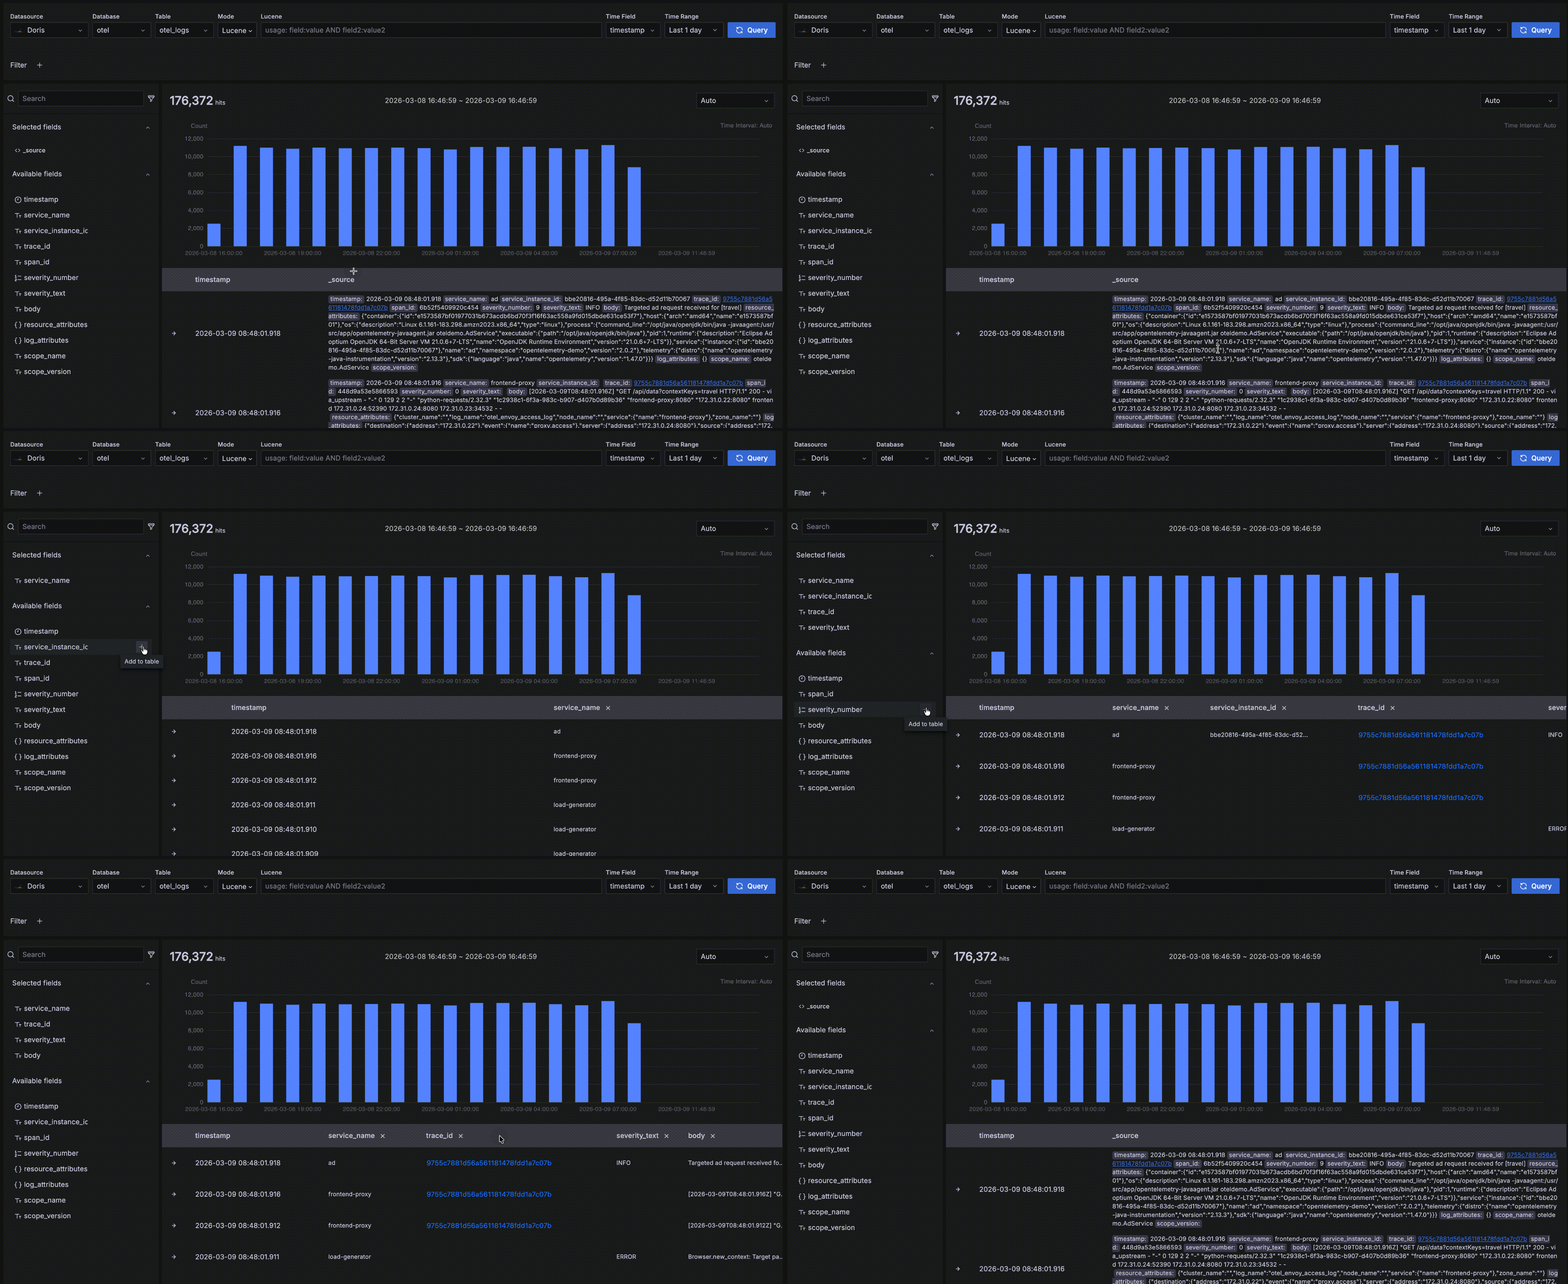
- Records are sorted by the time field in descending order so the newest data is shown first. Each page displays 50 records and you can paginate for more. Two fields are shown by default: the time field and
_source, where_sourceis a virtual concatenation of all fields displayed askey: valuepairs with keys highlighted for readability. You can customize which fields are displayed on the right by clicking “+” next to a field name in the left-side field browser. Multiple fields can be added, and you can remove them by clicking “x” on the right; when all fields are removed it falls back to the default_source.
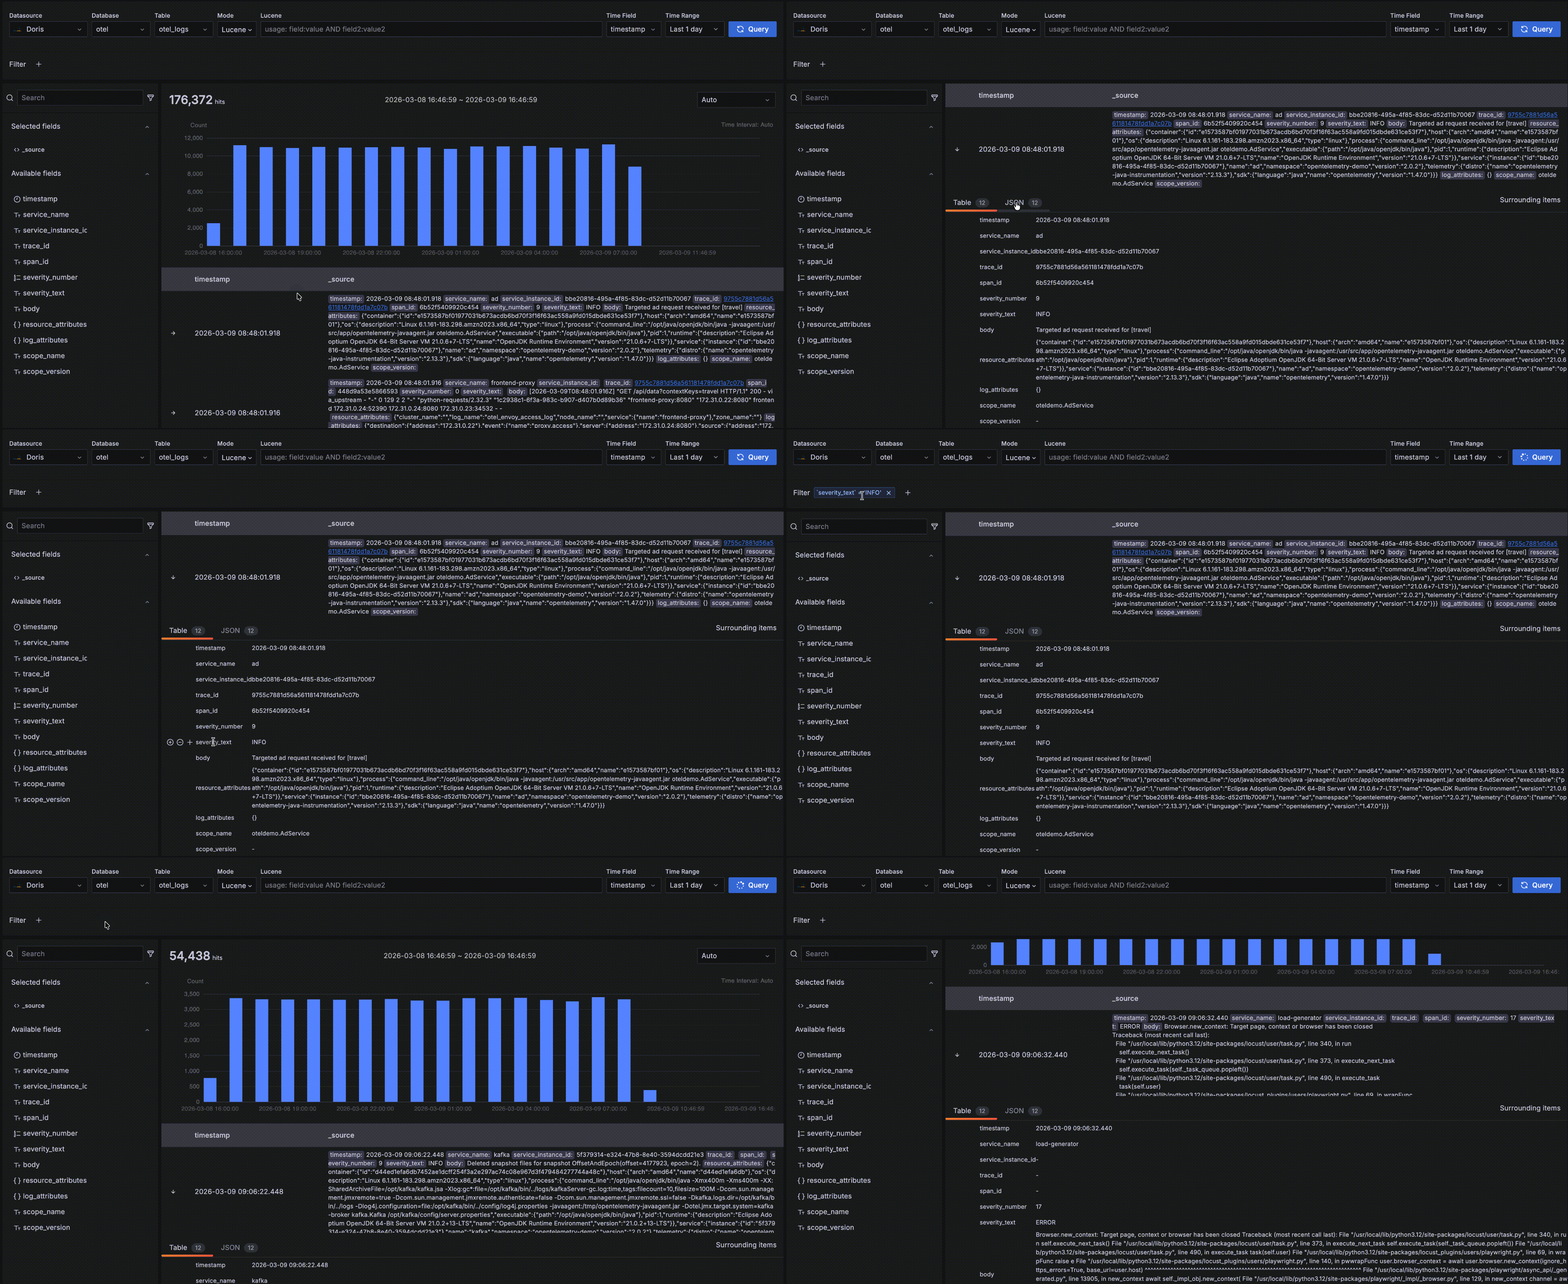
- Click the “->” arrow at the leftmost position to expand a record's details. There are two forms — Table and JSON. In the Table form, click “+” or “-” next to a field to interactively add filter conditions such as
severity_text=INFO.
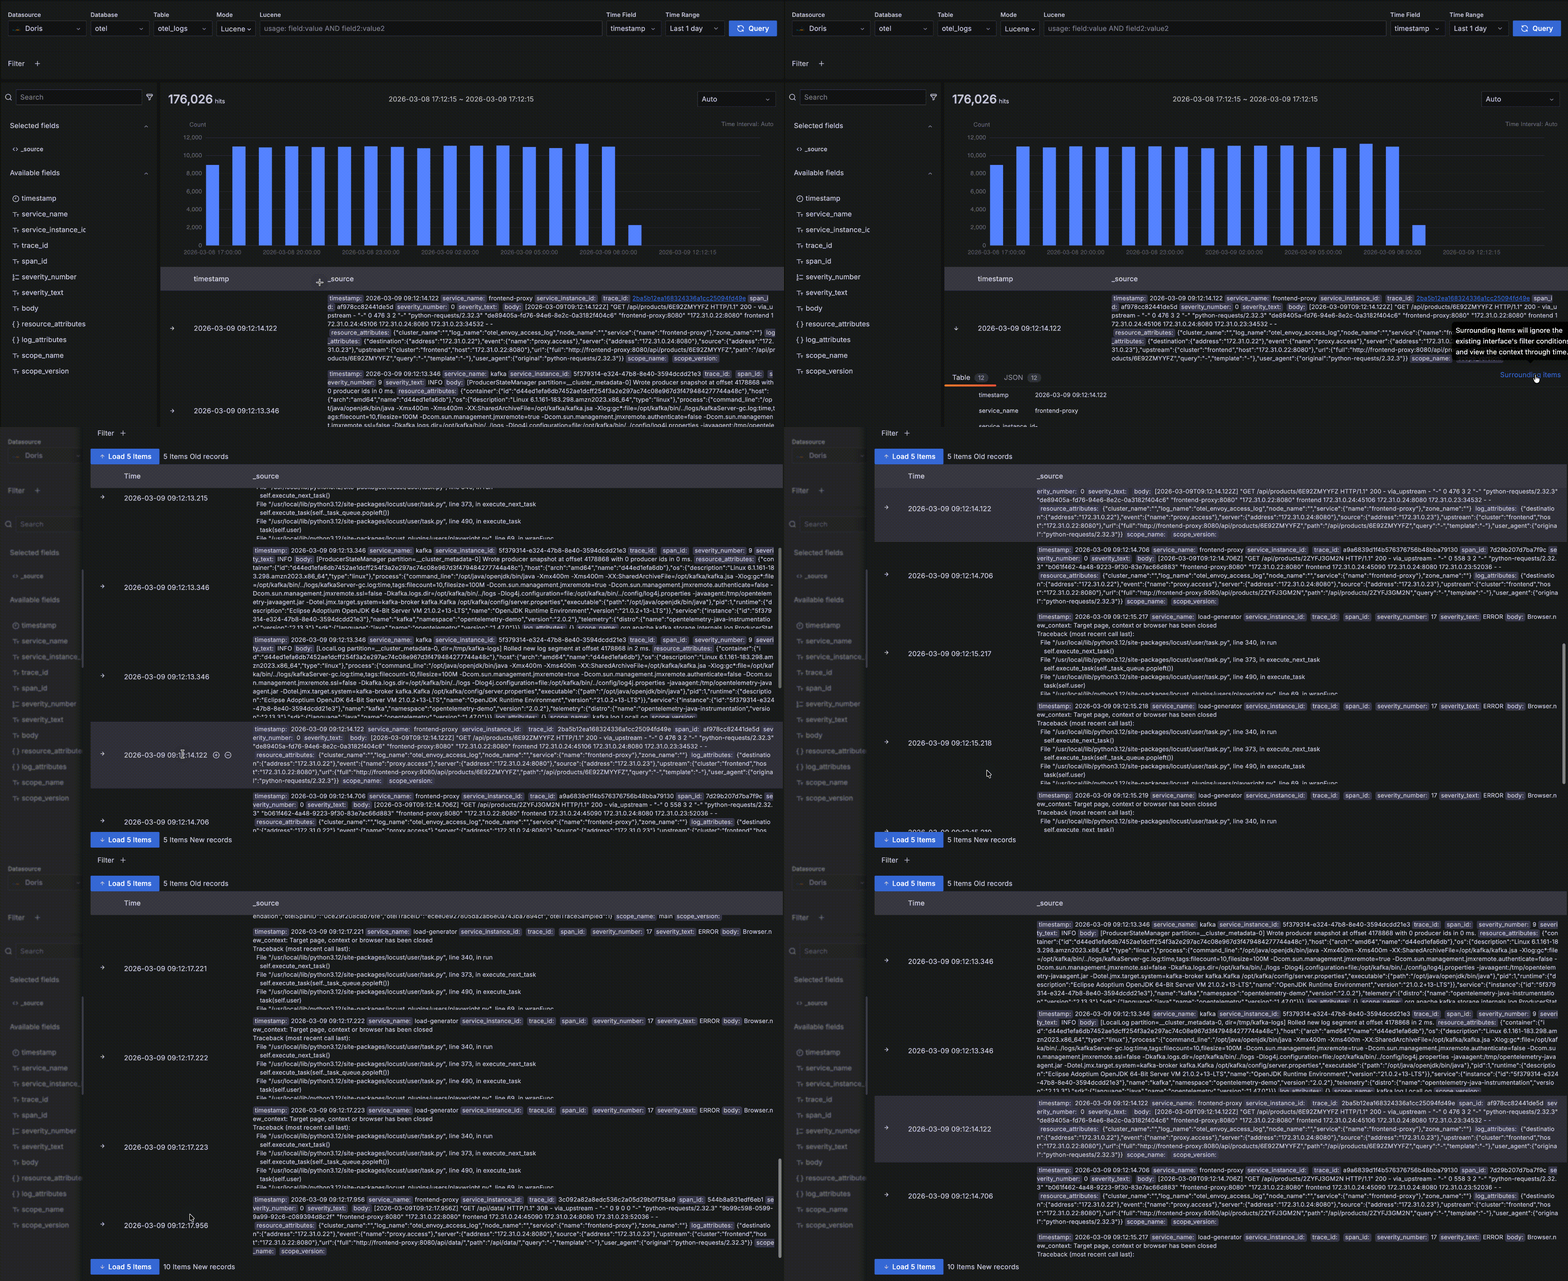
- After expanding a record, click Surrounding items to view that record's “context” — the 5 records before and after it in time. Note that this feature is commonly used to inspect logs around a specific log during issue analysis, so it ignores other query filter conditions besides time — otherwise it would behave the same as the detail data table. Of course you can view more than 5 surrounding records and add your own filters, such as restricting to a specific host.
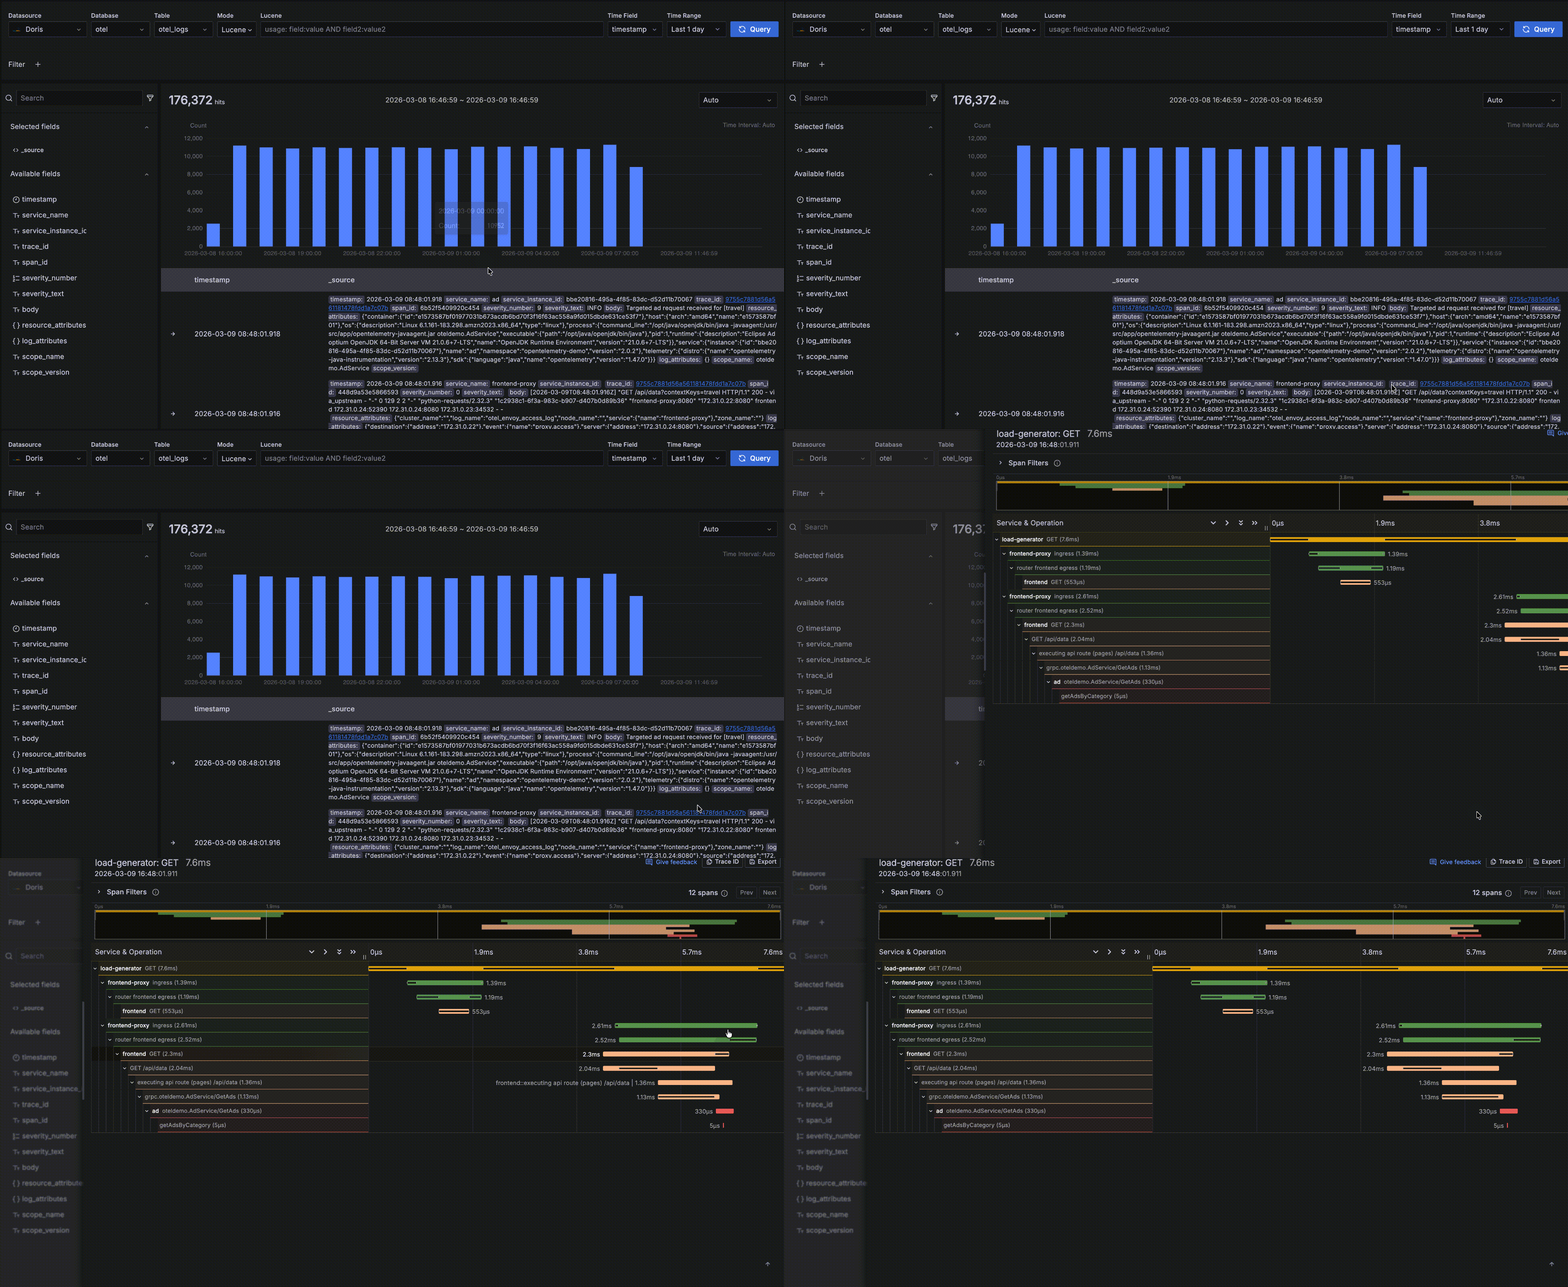
- If a record has a
trace_idfield, it is recognized as a related trace. The value becomes a clickable link; clicking it opens a trace waterfall drawer for log-to-trace correlation.
Field browser
The field browser on the left lets you inspect the fields of the current table and analyze their value distribution.
- Click “+” on the right of a field to add it to the detail data table.
- Click a field name to see its Top 5 most frequent values, and click “+” / “-” next to a value to dynamically add filter conditions.