| --- |
| title: 监控 API |
| keywords: |
| - API 网关 |
| - Apache APISIX |
| - 可观测性 |
| - 监控 |
| - 插件 |
| description: 本文介绍了 API 网关 Apache APISIX 可观察性插件并了解如何设置这些插件。 |
| --- |
| |
| <!-- |
| # |
| # Licensed to the Apache Software Foundation (ASF) under one or more |
| # contributor license agreements. See the NOTICE file distributed with |
| # this work for additional information regarding copyright ownership. |
| # The ASF licenses this file to You under the Apache License, Version 2.0 |
| # (the "License"); you may not use this file except in compliance with |
| # the License. You may obtain a copy of the License at |
| # |
| # http://www.apache.org/licenses/LICENSE-2.0 |
| # |
| # Unless required by applicable law or agreed to in writing, software |
| # distributed under the License is distributed on an "AS IS" BASIS, |
| # WITHOUT WARRANTIES OR CONDITIONS OF ANY KIND, either express or implied. |
| # See the License for the specific language governing permissions and |
| # limitations under the License. |
| # |
| --> |
| |
| APISIX 中提供了很多具有丰富功能的可观测性插件。你可以通过使用和设置这些插件,来了解 API 行为,进而使整个业务流程更加清晰。 |
| |
| ## API 可观测性 |
| |
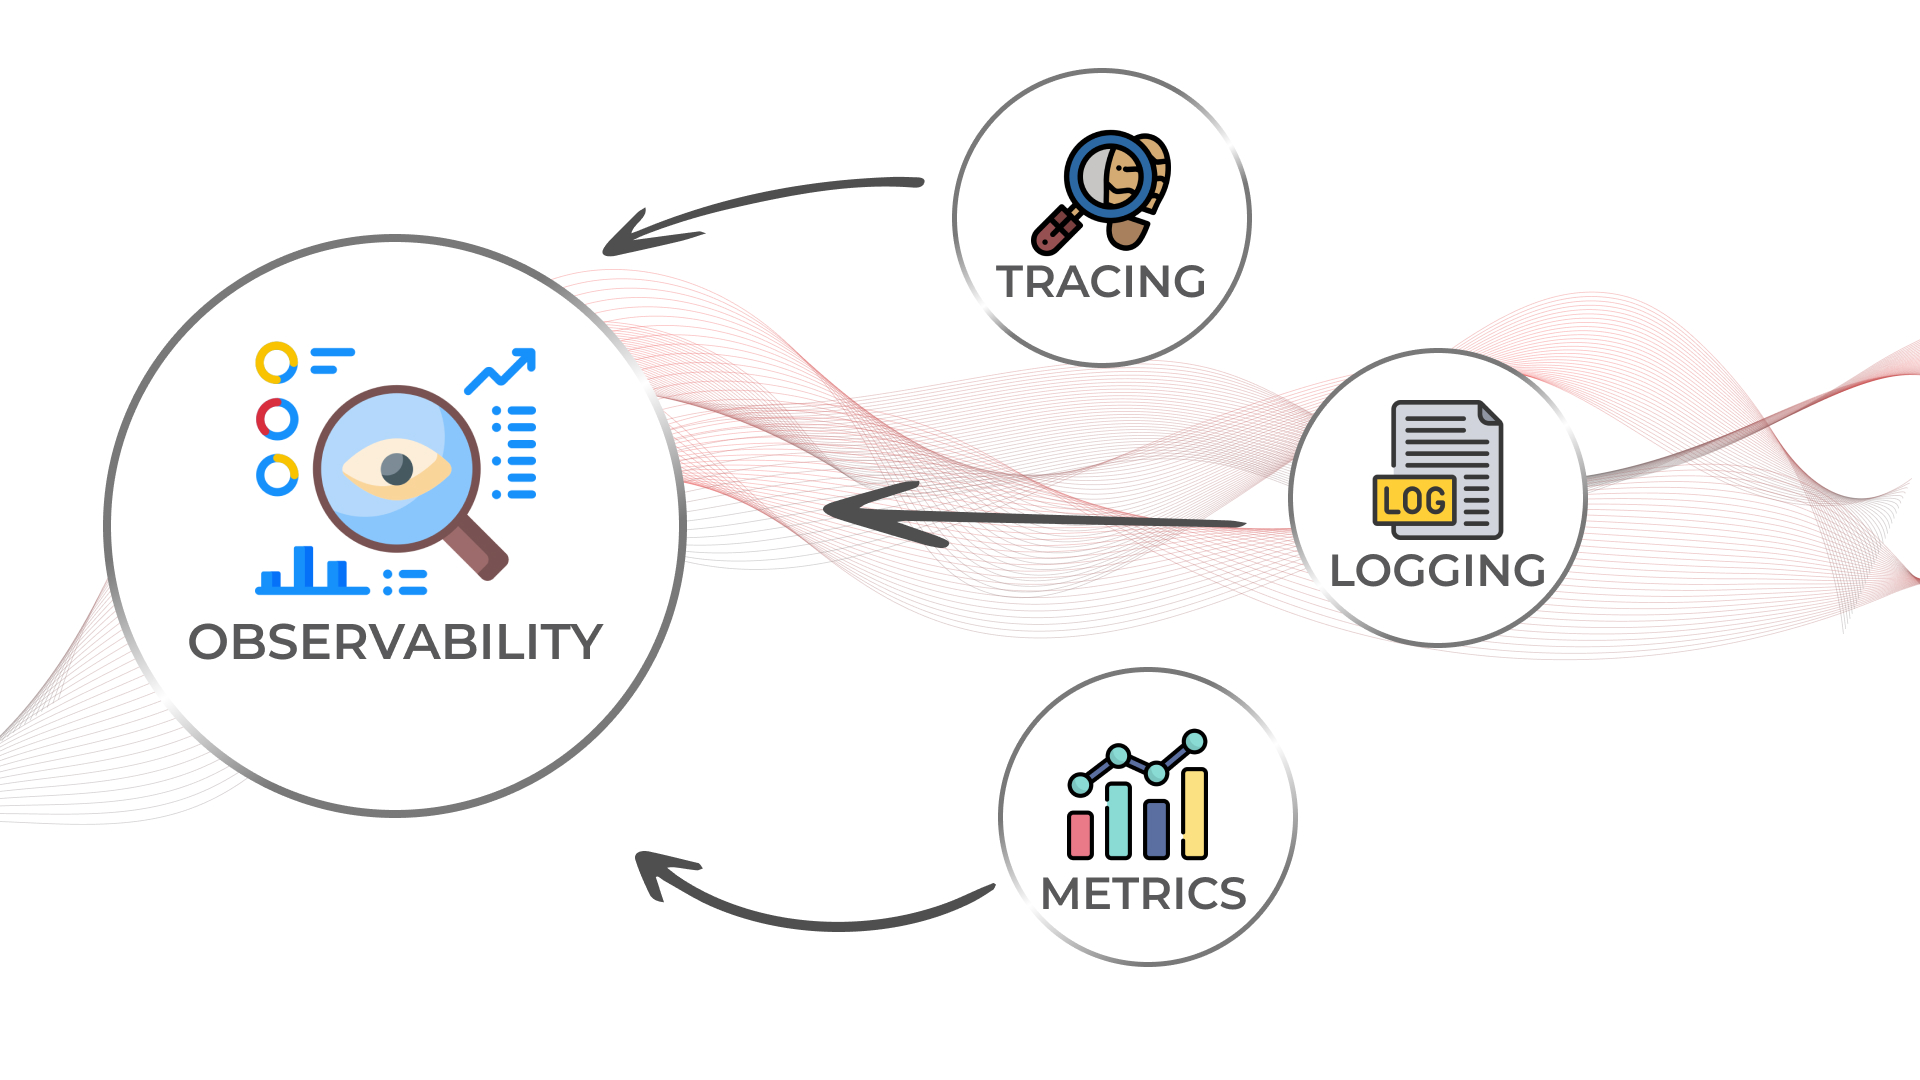
| **API 可观测性**已经成为 API 开发的一部分,因为它解决了与 API 一致性、可靠性和快速迭代 API 功能的相关问题。可观测性可分为三个关键部分:日志、指标、链路追踪,接下来让我们逐个了解它们。 |
| |
|  |
| |
| ## 前提条件 |
| |
| 在进行该教程之前,请确保你已经[公开服务](./expose-api.md)。 |
| |
| ## 日志 |
| |
| 在 APISIX 中,**日志**可分为访问日志和错误日志。访问日志主要记录了每个请求的上下文信息,错误日志则是 APISIX 运行打印的日志信息,包括 NGINX 和插件相关的信息。APISIX 的日志存储在 `./apisix/logs/` 目录下。当然你可以通过一些 APISIX 的日志插件,将 APISIX 的日志发送到指定的日志服务中,APISIX 提供了以下插件: |
| |
| - [http-logger](../plugins/http-logger.md) |
| - [skywalking-logger](../plugins/skywalking-logger.md) |
| - [tcp-logger](../plugins/tcp-logger.md) |
| - [kafka-logger](../plugins/kafka-logger.md) |
| - [rocketmq-logger](../plugins/rocketmq-logger.md) |
| - [udp-logger](../plugins/udp-logger.md) |
| - [clickhouse-logger](../plugins/clickhouse-logger.md) |
| - [error-logger](../plugins/error-log-logger.md) |
| - [google-cloud-logging](../plugins/google-cloud-logging.md) |
| |
| 你可以在 APISIX [插件中心](../plugins/http-logger.md) 查看 APISIX 支持的所有日志插件。接下来我们将使用 `http-logger` 插件为你演示如何将 APISIX 的日志数据发送到 HTTP/HTTPS 服务器中。 |
| |
| :::note 注意 |
| |
| 你可以使用 [mockbin.com](https://mockbin.org/) 生成一个模拟的 HTTP 服务器来存储和查看日志。 |
| |
| ::: |
| |
| 以下示例展示了在指定路由上启动 `http-logger` 的示例。 |
| |
| :::note |
| |
| 您可以这样从 `config.yaml` 中获取 `admin_key` 并存入环境变量: |
| |
| ```bash |
| admin_key=$(yq '.deployment.admin.admin_key[0].key' conf/config.yaml | sed 's/"//g') |
| ``` |
| |
| ::: |
| |
| ```shell |
| |
| curl http://127.0.0.1:9180/apisix/admin/routes/1 \ |
| -H "X-API-KEY: $admin_key" -X PUT -d ' |
| { |
| "plugins": { |
| "http-logger": { |
| "uri": "http://mockbin.org/bin/5451b7cd-af27-41b8-8df1-282ffea13a61" |
| } |
| }, |
| "upstream_id": "1", |
| "uri": "/get" |
| }' |
| |
| ``` |
| |
| :::note 注意 |
| |
| 你可以通过修改 `uri` 属性,将上述 `http-logger` 的服务器地址更换为你的服务器地址: |
| |
| ```json |
| { |
| "uri": "http://mockbin.org/bin/5451b7cd-af27-41b8-8df1-282ffea13a61" |
| } |
| ``` |
| |
| ::: |
| |
| 创建成功后,你可以通过以下命令向 `get` 端点发送请求以生成日志。 |
| |
| ```shell |
| curl -i http://127.0.0.1:9080/get |
| ``` |
| |
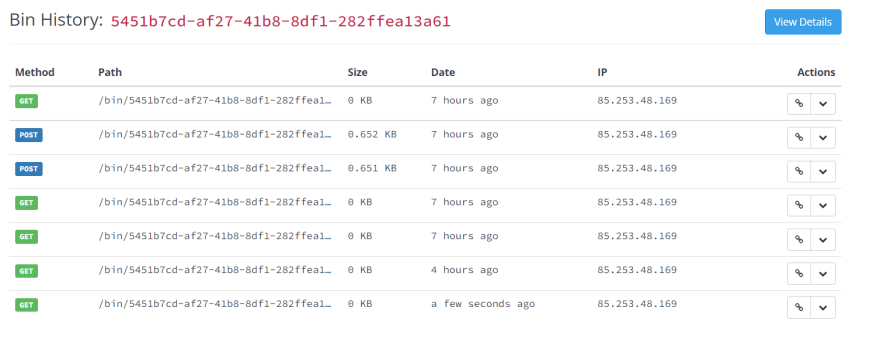
| 请求成功后,你可以单击[模拟服务器链接](http://mockbin.org/bin/5451b7cd-af27-41b8-8df1-282ffea13a61/log)查看访问日志。 |
| |
|  |
| |
| ## 指标 |
| |
| **指标**是在⼀段时间内测量的数值。与⽇志不同,指标在默认情况下是结构化的,这使得查询和优化存储变得更加容易。而 APISIX 也提供了 [Prometheus](../plugins/prometheus.md) 的插件来获取你的 API 指标,并在 Prometheus 中暴露它们。通过使用 APISIX 提供的 Grafana 仪表板元数据,并从 Prometheus 中获取指标,更加方便地监控你的 API。 |
| |
| 你可以通过以下命令启用 `prometheus` 插件: |
| |
| ```shell |
| curl http://127.0.0.1:9180/apisix/admin/routes/1 \ |
| -H "X-API-KEY: $admin_key" -X PUT -d ' |
| { |
| "uri": "/get", |
| "plugins": { |
| "prometheus": {} |
| }, |
| "upstream_id": "1" |
| }' |
| ``` |
| |
| 启用成功后,你可以通过 `/apisix/prometheus/metrics` 接口获取 APISIX 的指标。 |
| |
| ```shell |
| curl -i http://127.0.0.1:9091/apisix/prometheus/metrics |
| ``` |
| |
| 返回结果如下: |
| |
| ```text |
| HTTP/1.1 200 OK |
| Server: openresty |
| Content-Type: text/plain; charset=utf-8 |
| Transfer-Encoding: chunked |
| Connection: keep-alive |
| |
| # HELP apisix_batch_process_entries batch process remaining entries |
| # TYPE apisix_batch_process_entries gauge |
| apisix_batch_process_entries{name="http logger",route_id="1",server_addr="172.19.0.8"} 0 |
| # HELP apisix_etcd_modify_indexes Etcd modify index for APISIX keys |
| # TYPE apisix_etcd_modify_indexes gauge |
| apisix_etcd_modify_indexes{key="consumers"} 17819 |
| apisix_etcd_modify_indexes{key="global_rules"} 17832 |
| apisix_etcd_modify_indexes{key="max_modify_index"} 20028 |
| apisix_etcd_modify_indexes{key="prev_index"} 18963 |
| apisix_etcd_modify_indexes{key="protos"} 0 |
| apisix_etcd_modify_indexes{key="routes"} 20028 |
| ... |
| ``` |
| |
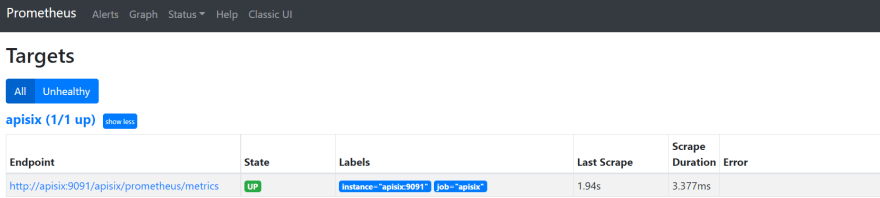
| 你还可以通过 `http://localhost:9090/targets` 在 Prometheus 仪表板上查看端点的状态。 |
| |
|  |
| |
| 如上图,APISIX 公开的指标端点已启动并正在运行。 |
| |
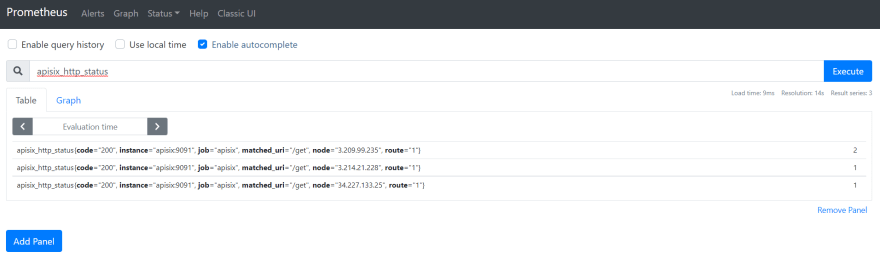
| 现在,你可以查询 `apisix_http_status` 的指标,查看 APISIX 处理了哪些 HTTP 请求及其结果。 |
| |
|  |
| |
| 除此之外,你还可以查看在本地实例中运行的 Grafana 仪表板。请访问 `http://localhost:3000/`。 |
| |
| 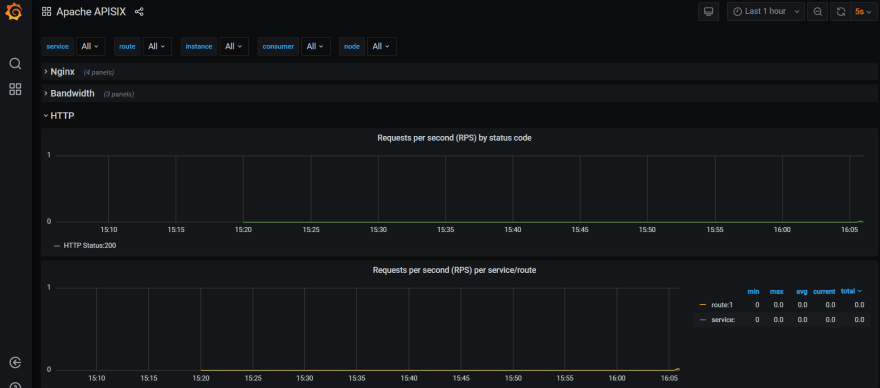 |
| |
| 目前,APISIX 还提供了其他两个关于指标的插件: |
| |
| - [Node status 插件](../plugins/node-status.md)(https://apisix.apache.org/docs/apisix/plugins/node-status/) |
| - [Datadog 插件](../plugins/datadog.md) |
| |
| ## 链路追踪 |
| |
| **链路追踪**就是将一次请求还原成调用链路,并将该请求的调用情况使用拓扑的方式展现,比如展示各个微服务节点上的耗时,请求具体经过了哪些服务器以及每个服务节点的请求状态等内容。 |
| |
| [Zipkin](https://zipkin.io/) 一个开源的分布式追踪系统。APISIX 的[zipkin 插件](../plugins/zipkin.md) 支持根据 [Zipkin API 规范](https://zipkin.io/pages/instrumenting.html) 收集链路信息并报告给 Zipkin Collector。 |
| |
| :::tip 提示 |
| |
| 使用该插件前,请确保你已经有一个正在运行的 Zipkin 实例。你可以使用 Docker 快速启动一个 Zipkin 实例: |
| |
| ``` |
| docker run -d -p 9411:9411 openzipkin/zipkin |
| ``` |
| |
| ::: |
| |
| 你可以通过如下示例,在指定路由中启用 `zipkin` 插件: |
| |
| ```shell |
| curl http://127.0.0.1:9180/apisix/admin/routes/1 \ |
| -H "X-API-KEY: $admin_key" -X PUT -d ' |
| { |
| "methods": [ |
| "GET" |
| ], |
| "uri": "/get", |
| "plugins": { |
| "zipkin": { |
| "endpoint": "http://127.0.0.1:9411/api/v2/spans", |
| "sample_ratio": 1 |
| } |
| }, |
| "upstream_id": "1" |
| }' |
| ``` |
| |
| 你可以通过以下命令请求 APISIX: |
| |
| ```shell |
| curl -i http://127.0.0.1:9080/get |
| ``` |
| |
| 如下所示,返回结果中的 `header` 部分附加了一些额外的跟踪标识符(TraceId、SpanId 和 ParentId): |
| |
| ```text |
| "X-B3-Parentspanid": "61bd3f4046a800e7", |
| "X-B3-Sampled": "1", |
| "X-B3-Spanid": "855cd5465957f414", |
| "X-B3-Traceid": "e18985df47dab632d62083fd96626692", |
| ``` |
| |
| 你可以通过访问 `http://127.0.0.1:9411/zipkin`,在 Zipkin 的 Web UI 上看到请求链路。 |
| |
| 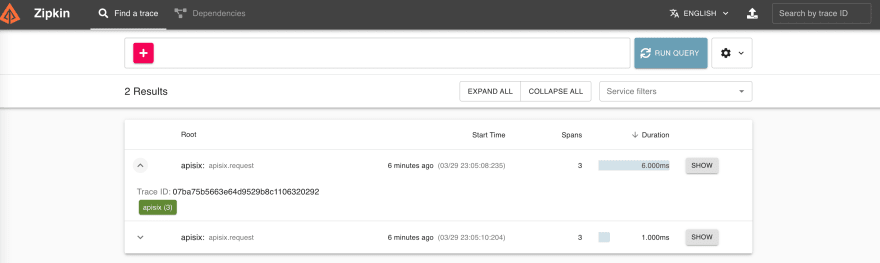 |
| |
| 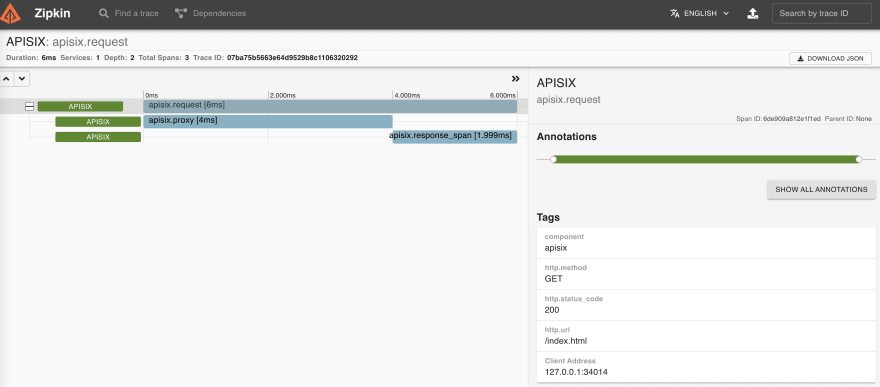 |
| |
| 你也可以通过另外两个插件进行链路追踪: |
| |
| - [Skywalking 插件](../plugins/skywalking.md) |
| |
| - [OpenTelemetry 插件](../plugins/opentelemetry.md) |
| |
| ## 总结 |
| |
| API 可观测性是一种用于在 API 世界中管理应用程序的框架,APISIX 的插件可以通过集成到多个可观测性平台来帮助你监控 API,让你更专注于开发核心业务功能,无需为集成多个可观测性应用花费更多时间。 |