| --- |
| title: zipkin |
| keywords: |
| - Apache APISIX |
| - API Gateway |
| - Plugin |
| - Zipkin |
| description: Zipkin is an open-source distributed tracing system. The zipkin Plugin instruments APISIX and sends traces to Zipkin based on the Zipkin API specification. |
| --- |
| |
| <!-- |
| # |
| # Licensed to the Apache Software Foundation (ASF) under one or more |
| # contributor license agreements. See the NOTICE file distributed with |
| # this work for additional information regarding copyright ownership. |
| # The ASF licenses this file to You under the Apache License, Version 2.0 |
| # (the "License"); you may not use this file except in compliance with |
| # the License. You may obtain a copy of the License at |
| # |
| # http://www.apache.org/licenses/LICENSE-2.0 |
| # |
| # Unless required by applicable law or agreed to in writing, software |
| # distributed under the License is distributed on an "AS IS" BASIS, |
| # WITHOUT WARRANTIES OR CONDITIONS OF ANY KIND, either express or implied. |
| # See the License for the specific language governing permissions and |
| # limitations under the License. |
| # |
| --> |
| |
| <head> |
| <link rel="canonical" href="https://docs.api7.ai/hub/zipkin" /> |
| </head> |
| |
| ## Description |
| |
| [Zipkin](https://github.com/openzipkin/zipkin) is an open-source distributed tracing system. The `zipkin` Plugin instruments APISIX and sends traces to Zipkin based on the [Zipkin API specification](https://zipkin.io/pages/instrumenting.html). |
| |
| The Plugin can also send traces to other compatible collectors, such as [Jaeger](https://www.jaegertracing.io/docs/1.51/getting-started/#migrating-from-zipkin) and [Apache SkyWalking](https://skywalking.apache.org/docs/main/latest/en/setup/backend/zipkin-trace/#zipkin-receiver), both of which support Zipkin [v1](https://zipkin.io/zipkin-api/zipkin-api.yaml) and [v2](https://zipkin.io/zipkin-api/zipkin2-api.yaml) APIs. |
| |
| ## Static Configurations |
| |
| By default, `zipkin` Plugin NGINX variables configuration is set to false in the [default configuration](https://github.com/apache/apisix/blob/master/apisix/cli/config.lua): |
| |
| To modify this value, add the updated configuration to `config.yaml`. For example: |
| |
| ```yaml |
| plugin_attr: |
| zipkin: |
| set_ngx_var: true |
| ``` |
| |
| Reload APISIX for changes to take effect. |
| |
| ## Attributes |
| |
| See the configuration file for configuration options available to all Plugins. |
| |
| | Name | Type | Required | Default | Valid values | Description | |
| |--------------|---------|----------|----------------|--------------|---------------------------------------------------------------------------------| |
| | endpoint | string | True | | | Zipkin span endpoint to POST to, such as `http://127.0.0.1:9411/api/v2/spans`. | |
| |sample_ratio| number | True | | [0.00001, 1] | Frequency to sample requests. Setting to `1` means sampling every request. | |
| |service_name| string | False | "APISIX" | | Service name for the Zipkin reporter to be displayed in Zipkin. | |
| |server_addr | string | False |the value of `$server_addr` | IPv4 address | IPv4 address for the Zipkin reporter. For example, you can set this to your external IP address. | |
| |span_version | integer | False | 2 | [1, 2] | Version of the span type. | |
| |
| ## Examples |
| |
| The examples below show different use cases of the `zipkin` Plugin. |
| |
| ### Send Traces to Zipkin |
| |
| The following example demonstrates how to trace requests to a Route and send traces to Zipkin using [Zipkin API v2](https://zipkin.io/zipkin-api/zipkin2-api.yaml). You will also understand the differences between span version 2 and span version 1. |
| |
| Start a Zipkin instance in Docker: |
| |
| ```shell |
| docker run -d --name zipkin -p 9411:9411 openzipkin/zipkin |
| ``` |
| |
| Create a Route with `zipkin` and use the default span version 2. You should adjust the IP address as needed for the Zipkin HTTP endpoint, and configure the sample ratio to `1` to trace every request. |
| |
| ```shell |
| curl "http://127.0.0.1:9180/apisix/admin/routes" -X PUT \ |
| -H "X-API-KEY: ${admin_key}" \ |
| -d '{ |
| "id": "zipkin-tracing-route", |
| "uri": "/anything", |
| "plugins": { |
| "zipkin": { |
| "endpoint": "http://127.0.0.1:9411/api/v2/spans", |
| "sample_ratio": 1, |
| "span_version": 2 |
| } |
| }, |
| "upstream": { |
| "type": "roundrobin", |
| "nodes": { |
| "httpbin.org": 1 |
| } |
| } |
| }' |
| ``` |
| |
| Send a request to the Route: |
| |
| ```shell |
| curl "http://127.0.0.1:9080/anything" |
| ``` |
| |
| You should receive an `HTTP/1.1 200 OK` response similar to the following: |
| |
| ```json |
| { |
| "args": {}, |
| "data": "", |
| "files": {}, |
| "form": {}, |
| "headers": { |
| "Accept": "*/*", |
| "Host": "127.0.0.1", |
| "User-Agent": "curl/7.64.1", |
| "X-Amzn-Trace-Id": "Root=1-65af2926-497590027bcdb09e34752b78", |
| "X-B3-Parentspanid": "347dddedf73ec176", |
| "X-B3-Sampled": "1", |
| "X-B3-Spanid": "429afa01d0b0067c", |
| "X-B3-Traceid": "aea58f4b490766eccb08275acd52a13a", |
| "X-Forwarded-Host": "127.0.0.1" |
| }, |
| ... |
| } |
| ``` |
| |
| Navigate to the Zipkin web UI at [http://127.0.0.1:9411/zipkin](http://127.0.0.1:9411/zipkin) and click __Run Query__, you should see a trace corresponding to the request: |
| |
| 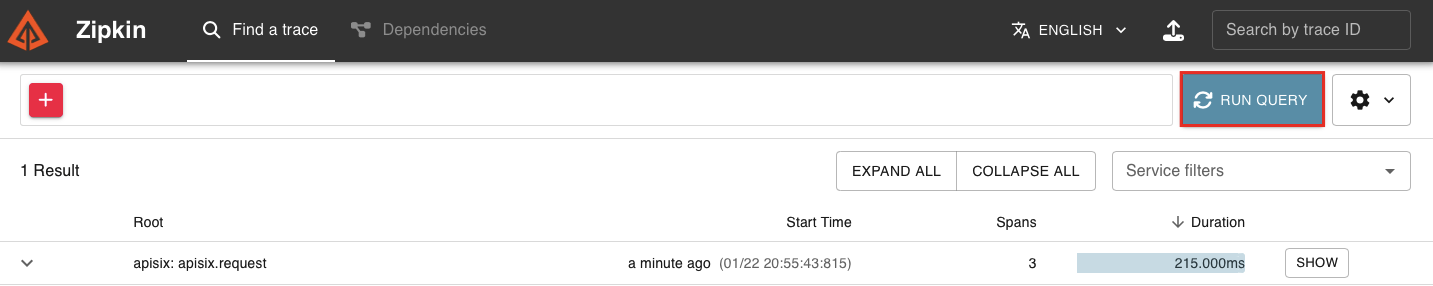 |
| |
| Click __Show__ to see more tracing details: |
| |
| 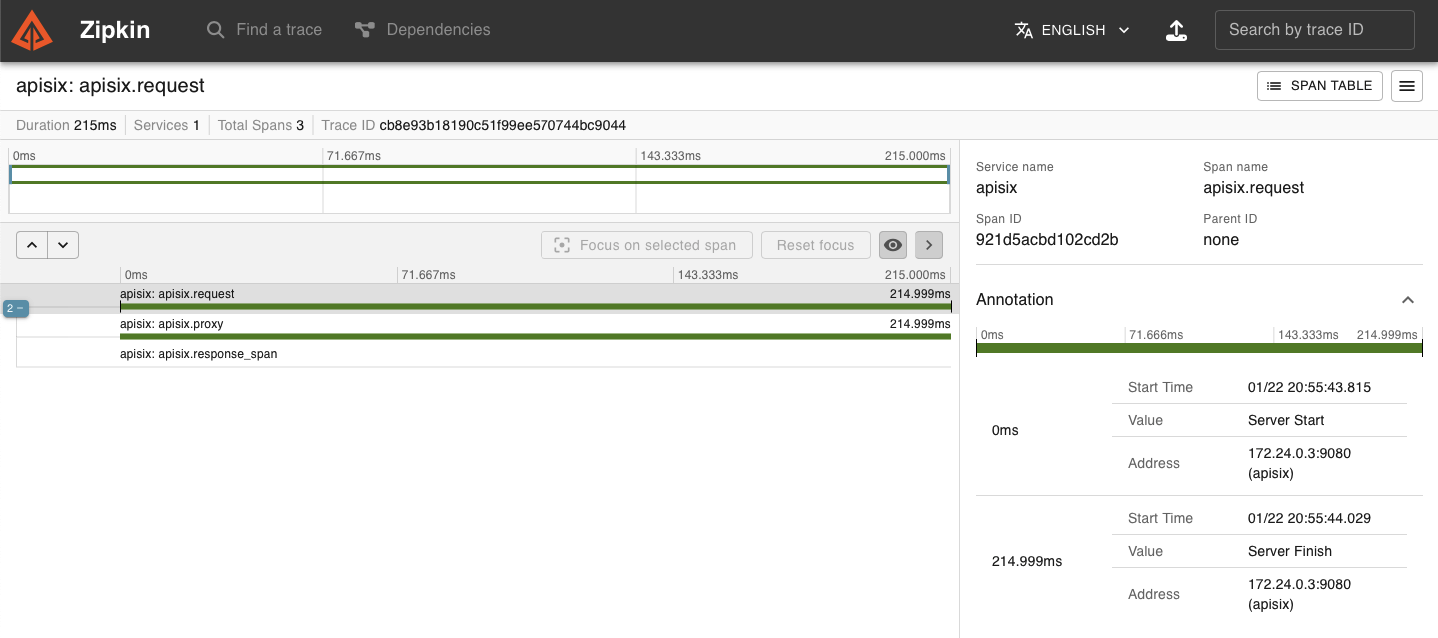 |
| |
| Note that with span version 2, every traced request creates the following spans: |
| |
| ```text |
| request |
| ├── proxy |
| └── response |
| ``` |
| |
| where `proxy` represents the time from the beginning of the request to the beginning of `header_filter`, and `response` represents the time from the beginning of `header_filter` to the beginning of `log`. |
| |
| Now, update the Plugin on the Route to use span version 1: |
| |
| ```shell |
| curl "http://127.0.0.1:9180/apisix/admin/routes/zipkin-tracing-route" -X PATCH \ |
| -H "X-API-KEY: ${admin_key}" \ |
| -d '{ |
| "plugins": { |
| "zipkin": { |
| "span_version": 1 |
| } |
| } |
| }' |
| ``` |
| |
| Send another request to the Route: |
| |
| ```shell |
| curl "http://127.0.0.1:9080/anything" |
| ``` |
| |
| In the Zipkin web UI, you should see a new trace with details similar to the following: |
| |
| 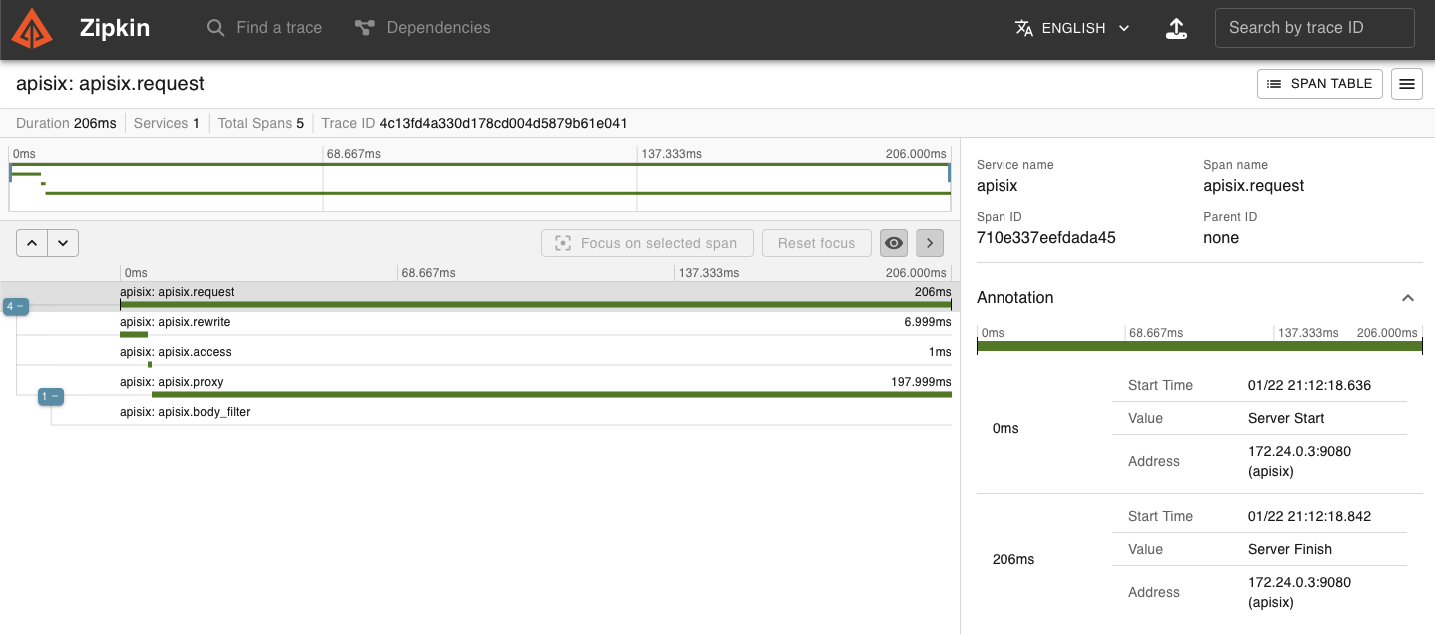 |
| |
| Note that with the older span version 1, every traced request creates the following spans: |
| |
| ```text |
| request |
| ├── rewrite |
| ├── access |
| └── proxy |
| └── body_filter |
| ``` |
| |
| ### Send Traces to Jaeger |
| |
| The following example demonstrates how to trace requests to a Route and send traces to Jaeger. |
| |
| Start a Jaeger instance in Docker: |
| |
| ```shell |
| docker run -d --name jaeger \ |
| -e COLLECTOR_ZIPKIN_HOST_PORT=9411 \ |
| -p 16686:16686 \ |
| -p 9411:9411 \ |
| jaegertracing/all-in-one |
| ``` |
| |
| Create a Route with `zipkin`. Please adjust the IP address as needed for the Zipkin HTTP endpoint, and configure the sample ratio to `1` to trace every request. |
| |
| ```shell |
| curl "http://127.0.0.1:9180/apisix/admin/routes" -X PUT \ |
| -H "X-API-KEY: ${admin_key}" \ |
| -d '{ |
| "id": "kin-tracing-route", |
| "uri": "/anything", |
| "plugins": { |
| "kin": { |
| "endpoint": "http://127.0.0.1:9411/api/v2/spans", |
| "sample_ratio": 1 |
| } |
| }, |
| "upstream": { |
| "type": "roundrobin", |
| "nodes": { |
| "httpbin.org": 1 |
| } |
| } |
| }' |
| ``` |
| |
| Send a request to the Route: |
| |
| ```shell |
| curl "http://127.0.0.1:9080/anything" |
| ``` |
| |
| You should receive an `HTTP/1.1 200 OK` response. |
| |
| Navigate to the Jaeger web UI at [http://127.0.0.1:16686](http://127.0.0.1:16686), select APISIX as the Service, and click __Find Traces__, you should see a trace corresponding to the request: |
| |
| 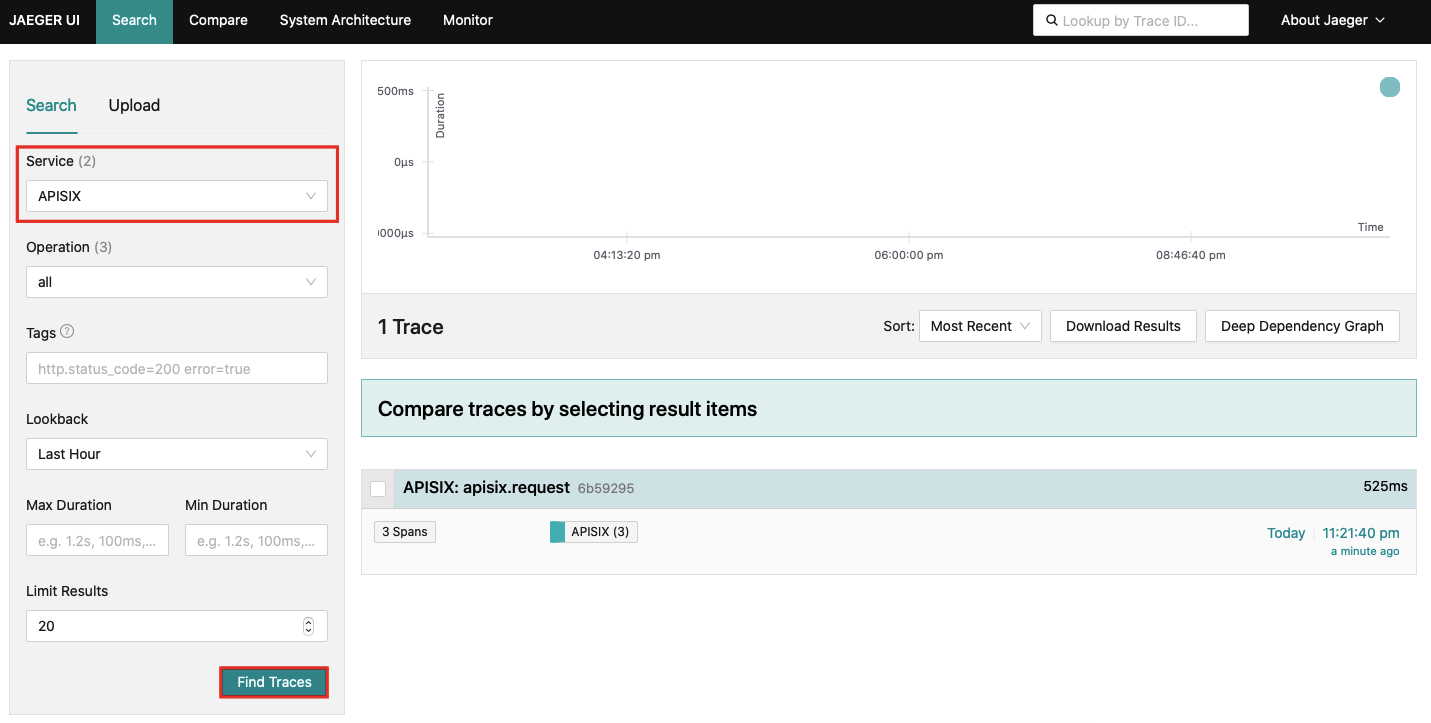 |
| |
| Similarly, you should find more span details once you click into a trace: |
| |
| 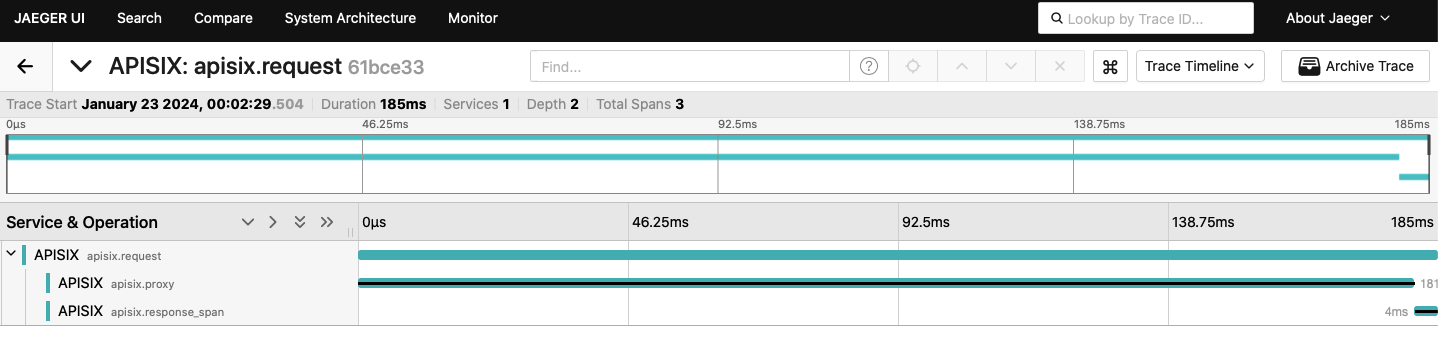 |
| |
| ### Using Trace Variables in Logging |
| |
| The following example demonstrates how to configure the `kin` Plugin to set the following built-in variables, which can be used in logger Plugins or access logs: |
| |
| - `kin_context_traceparent`: [trace parent](https://www.w3.org/TR/trace-context/#trace-context-http-headers-format) ID |
| - `kin_trace_id`: trace ID of the current span |
| - `kin_span_id`: span ID of the current span |
| |
| Update the configuration file as below. You can customize the access log format to use the `zipkin` Plugin variables, and set `zipkin` variables in the `set_ngx_var` field. |
| |
| ```yaml title="conf/config.yaml" |
| nginx_config: |
| http: |
| enable_access_log: true |
| access_log_format: '{"time": "$time_iso8601","zipkin_context_traceparent": "$zipkin_context_traceparent","zipkin_trace_id": "$zipkin_trace_id","zipkin_span_id": "$zipkin_span_id","remote_addr": "$remote_addr"}' |
| access_log_format_escape: json |
| plugin_attr: |
| zipkin: |
| set_ngx_var: true |
| ``` |
| |
| Reload APISIX for configuration changes to take effect. |
| |
| You should see access log entries similar to the following when you generate requests: |
| |
| ```text |
| {"time": "23/Jan/2024:06:28:00 +0000","zipkin_context_traceparent": "00-61bce33055c56f5b9bec75227befd142-13ff3c7370b29925-01","zipkin_trace_id": "61bce33055c56f5b9bec75227befd142","zipkin_span_id": "13ff3c7370b29925","remote_addr": "172.28.0.1"} |
| ``` |